Loading...

Top 10 audiences for Q2

Published: April 9, 2024 by Experian Marketing Services

Experian's top 10 audiences to activate in Q2

At Experian, we understand the critical role that audience targeting plays in the success of marketing campaigns. That’s why we’re excited to share this curated list, aimed at helping agencies and media buyers plan their campaigns and effectively reach their audiences with precision and confidence.

Here’s a look at the Experian audiences that were the most popular in Q2 2023. Which ones will you add to your Q2 campaign planning?

Our top 10 audiences for Q2

Fitness enthusiast

Lifestyle and Interests (Affinity) > Health & Fitness > Fitness Enthusiast

In-store high spender on baby products

Retail Shoppers: Purchase Based > Shopping Behavior > Baby Products: In Store High Spenders

Has a bachelor’s degree

Demographics > Education > Bachelor Degree

In-market for an SUV and CUV

Autos, Cars and Trucks > In Market-Body Styles > SUV and CUV

In-market for a mid-size truck

Autos, Cars and Trucks > In Market-Body Styles > Mid-Size Truck

Homeowner

Demographics > Homeowners/Renters > Homeowner

In-market for a small, mid-size SUV

Autos, Cars and Trucks > In Market-Body Styles > Small Mid-Size SUV

In-market for a full-size truck

Autos, Cars and Trucks > In Market-Body Styles > Full-Size Trucks

In-market for a full-size SUV

Autos, Cars and Trucks > In Market-Body Styles > Full-Size SUVs

Household income level

Demographics > Household Income (HHI) > $75,000+

Our top 5 audiences by vertical

Which audience segments were the most popular by advertiser vertical?

Advanced TV

Household income level

Demographics > Household Income (HHI) > $75,000-$99,999

Interested in dogs

Lifestyle and Interests (Affinity) > Pets > Dogs (FLA / Fair Lending Friendly)1

Homeowner

Demographics > Homeowner/Renter > Homeowner

Household income level

Demographics > Household Income (HHI) > $100,000-$124,999

Interested in arts and entertainment

Lifestyle and Interests (Affinity) > Art and Entertainment > Visual Art and Design (FLA / Fair Lending Friendly)

Agency

Dog owner

Lifestyle And Interests (Affinity) > Pets > Dog Owners

Cat owner

Lifestyle And Interests (Affinity) > Pets > Cat Owners

Active investor

Lifestyle And Interests (Affinity) > Investors > Active Investor

Mutual fund investor

Lifestyle And Interests (Affinity) > Investors > Mutual Fund Investor

In-market for a full-size SUV

Autos, Cars and Trucks > In Market-Body Styles > Full-Size SUVs

Auto

In-market for a new car

Autos, Cars and Trucks > In Market-New/Used > New Car

In-market for a used car

Autos, Cars and Trucks > In Market-New/Used > Buyer Used

In-market for a Honda

Autos, Cars And Trucks > In Market-Make And Models > Honda

In-market for an auto loan

Financial FLA Friendly > In Market Auto Loan

In-market for an auto lease

Financial FLA Friendly > In Market Auto Lease

Chart that shows media preference for consumers who are in market for a vehicle.

Did you know?

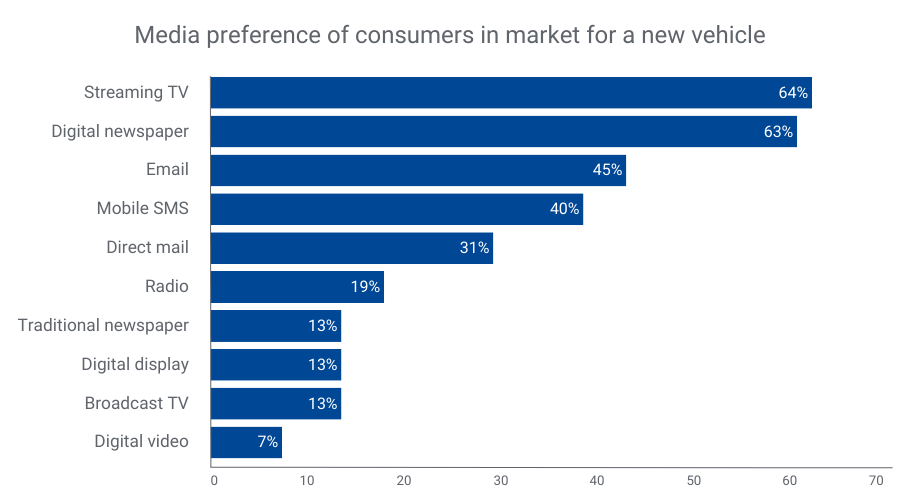
Consumers looking to buy a new vehicle prefer streaming TV, digital newspapers, and email for communication2. By merging our TrueTouchTM engagement channel audiences with our Auto in-market audiences, you can effectively target these consumers through their preferred channels. TrueTouch facilitates personalized advertising campaigns by predicting consumer preferences, ensuring messaging styles align with the right channels and calls to action.

By understanding what types of media people prefer, you can match the best way to talk to them with what to offer, using the right channels for personalized ads. No consumer is the same – and you need to engage with them on their terms to successfully market to them.

Financial

Active in the military

Lifestyle And Interests (Affinity) > Occupation > Military – Active

In-market for a credit union loan

Financial FLA Friendly > In Market Credit Union Loan

40-49 years old

Demographics > Ages > 40-49

30-39 years old

Demographics > Ages > 30-39

Small business owner

Consumer Behaviors > Occupation: Small Business Owners

Health

25-29 years old

Demographics > Ages > 25-29

30-34 years old

Demographics > Ages > 30-34

Weight conscious

Lifestyle and Interests (Affinity) > Health & Fitness > Weight Conscious

Moms interested in fitness

Lifestyle and Interests (Affinity) > Moms, Parents, Families > Fitness Mothers

High spenders at vitamin/supplement stores

Retail Shoppers: Purchase Based > Health and Fitness > Vitamins/Supplements: Vitamins/Supplements

Retail & CPG

Dog owners

Lifestyle And Interests (Affinity) > Pets > Dog Owners

Cat owners

Lifestyle And Interests (Affinity) > Pets > Cat Owners

Fitness enthusiast

Lifestyle and Interests (Affinity) > Health & Fitness > Fitness Enthusiast

Interested in healthy living

Lifestyle and Interests (Affinity) > Health & Fitness > Healthy Living

High spenders at vitamin/supplement stores

Retail Shoppers: Purchase Based > Health and Fitness > Vitamins/Supplements: Vitamins/Supplements

Activate the right audiences with Experian

When you choose Experian’s syndicated audiences, you gain access to over 2,400 audiences that span across 15 verticals and categories. These audiences are directly available for activation on over 30 platforms and can be sent to over 200 media platforms. Experian is ranked #1 for data accuracy (as validated by Truthset) and Experian Marketing Data is the foundation for successful targeting, enrichment, and activation.

For a full list of Experian’s syndicated audiences and activation destinations, download our syndicated audiences guide. Need a custom audience? We can help you build and activate an Experian audience on the platform of your choice.

Check out other seasonal audiences you can activate today.

Footnotes

  1. Fair Lending Act Friendly audiences: “Fair Lending Friendly” indicates data fields that Experian has made available without use of certain demographic attributes that may increase the likelihood of discriminatory practices prohibited by the Fair Housing Act (“FHA”) and Equal Credit Opportunity Act (“ECOA”). These excluded attributes include, but may not be limited to, race, color, religion, national origin, sex, marital status, age, disability, handicap, family status, ancestry, sexual orientation, unfavorable military discharge, and gender. Experian’s provision of Fair Lending Friendly indicators does not constitute legal advice or otherwise assure your compliance with the FHA, ECOA, or any other applicable laws. Clients should seek legal advice with respect to your use of data in connection with lending decisions or application and compliance with applicable laws.
  2. Experian looked at our Auto and TrueTouch audience data to understand media preference trends over the past year.

Latest posts

Loading…
Ask the analyst: Are consumers really cutting the cord?

Q&A with John Fetto, Senior Analyst, Marketing & Research Earlier this year, Experian Marketing Services released our Cross-Device Video Analysis. The analysis has generated such strong and sustained interest from marketers and the media, we wanted to explore the subject further. The following is an exchange with the report’s lead author John Fetto who answers some common questions that we’ve received since the analysis was published. Q: In the Cross-Device Video Analysis, you report that consumers are “cutting the cord” on pay cable and satellite television services. Can you elaborate on this trend? What’s driving it? According to our research at Experian Marketing Services, U.S. consumers are increasingly likely to have high speed Internet at home but no cable or satellite TV subscription. There are two primary consumer trends driving this: 1) Households that never subscribed to a pay TV service are now upgrading to broadband Internet; 2) Households that previously subscribed to both pay TV service and broadband Internet that have since cancelled the cable or satellite TV subscription. While the vast majority of U.S. households pay for either cable or satellite TV, an estimated 15.1 million (or 12.9 percent of households) do not. That’s up from 13.5 million households (11.9 percent) who didn’t pay for TV in 2009. At the same time, the share of broadband households is also rising. Today, 72.7 million homes (61.4 percent) have broadband Internet, up from 65.0 million homes (56.9 percent) in 2009. As Americans’ Internet connection at home is increasingly fast enough to deliver high quality video content through sites like YouTube, Netflix, Hulu and the like, as well as the ability to consume that online video content across an array of devices ranging from Internet-connected televisions to smartphones and tablets to computers, they are increasingly questioning whether they need to continue paying for TV. And more and more consumers are deciding to cut the cord. Q: With more consumers cutting the cord, how are they consuming video content? While the most commonly used device to consume online video is the smartphone — used by 24 percent of adults during a typical week to watch online video, according to our research — “cord cutters” are primarily using Internet-connected TV to consume online video. In fact, an adult who watches online video on their TV is 3.2 times more likely than the average adult to be a cord-cutter. This means that the Internet-connected TV market is critical in predicting the future of the cord-cutting consumer. As existing devices like Apple TV, Chromecast and Roku are upgraded and new devices like Amazon Fire TV are introduced to the market, consumers will have more and more options to consume online video without sacrificing quality or screen size. As a result, more consumers will be reconsidering whether they need to continue paying for TV. Q: What percent of consumers get their television programming from various sources including cable, satellite, online streaming and free over the air TV? Combined, 87.1 percent of U.S. households subscribe to either cable or satellite TV. While Experian Marketing Services doesn’t specifically measure the percent of Americans who watch TV through an over the air feed (OTA) we know that among those who do not subscribe to cable or satellite, the vast majority (77 percent) still watch TV. And while it’s possible that some are viewing TV from a cable or satellite feed away from home, the most likely source of their TV content would be from OTA sources. That means that at least 10 percent of American adults are watching some TV through an OTA feed. In addition, 48 percent of all adults watch online video each week through a variety of devices. Those who don’t pay for TV are 12 percent more likely than those who have cable or satellite TV to watch online video (54 percent vs 48 percent). Q: The cord-cutting trend has many implications for the cable and satellite companies, but what do consumer-facing marketers and advertisers need to know about this trend? The growth in online video viewing creates many opportunities for marketers. Online audiences can be more easily targeted and served up advertising that is more relevant, responsive and measureable. Marketers can also be more confident that their online ad was actually seen, given that viewers are typically unable to skip ads. And while CPMs for online video ads may generally be lower than those of TV, marketers can use that savings to negotiate costs based on clicks or transactions rather than impressions, giving them a better picture into audience interest and insights to inform their budget allocation. Millennials are the most device “agnostic,” with more than one-third saying they don’t mind watching video on a portable device even if it means a smaller screen. That’s more than double the rate of those ages 35 and older. This decentralized viewing can create headaches for marketers who need to start a relationship with Millennials during this stage of their lives when they’re most open to trying out new brands and have yet to settle down. On the plus side, marketers who do manage to reach this audience will find them much more open to advertising than average. In fact, Millennials are more than four times more likely to say that video ads that they view on their cell phone are useful. So while the challenge is big, so is the potential reward.   Download the full analysis to learn more about: Cross-device video behaviors to optimize media mix approach The impact of the growing trend in cord-cutters The rising influence of Internet-connected TV How to get more impact from video content

Oct 08,2014 by

5 tips for back-to-school marketers

School may be out for the summer, but this is the perfect time for marketers to begin back-to-school planning. Follow these five simple tips and be on your way to back-to-school success. Searchers are actively seeking out ideas around clothes, hairstyles and dorm room décor as they prepare for the school year to start. Leverage sites like Pinterest to promote back to school merchandise and content. Don’t forget to include DIY and customization options as these appeal to today’s students. Don’t underestimate the influence of moms and college students. These consumers are more likely to actively search for the best deals online so test using deal-seeking terms like “free” and “sales” in promotional campaigns. In 2013, Marketers experienced a 35 percent lift in unique clicks when they used the word ‘college’ in the subject line. This year, try targeting specific ages for back-to-school by including terms like “college” and kids” in the subject line. Timing of back-to-school campaigns matters. While August is the key month for back-to-school campaigns, there may be more opportunity to mail additional campaigns for school supplies in July, and clothing and accessories in early September. Don’t forget to personalize! Last year, we saw a 44 percent increase in unique open rates for emails that contained personalization in the subject line. These tactics should be included in a strong back-to-school mailing program. For more information on back-to-school planning, download the 5 Lessons for Back-to-school Marketers in 2014 report.

Jul 01,2014 by

Hispanics are mobile-dominant. Are your campaigns?

Experian Marketing Services conducted an analysis into the attitudes, language preferences, spending habits and media behaviors of Hispanic Consumers, some of which were featured in the 2014 Hispanic Market Overview presented by López Negrete Communications. This post highlights findings from that analysis, which focus on Hispanic consumers’ adoption and use of smartphones. Hispanic consumers, who today account for 15 percent of the total U.S. adult population and 22 percent of Millennials, represent an ideal audience for mobile engagement and mobile advertising. While cell phone ownership rates among Hispanic and non-Hispanic adults are equal, Hispanics are more likely to own a smartphone and use it as their primary device to connect to the Internet. According to the latest estimates from Experian Marketing Services, 63 percent of Hispanic adults own a smartphone versus 60 percent of non-Hispanics. That’s up from 52 percent and 51 percent, respectively, since 2012. Among smartphone owners, Hispanics are 17 percent more likely than non-Hispanics to say that they access the Internet more through their phone than through a computer. In fact, 45 percent of Hispanic smartphone owners are mobile-dominant when it comes to going online compared with 38 percent of non-Hispanics. Marketers courting the influential Hispanic consumer must consider this fact and take a mobile-first approach to ensure that online marketing efforts, including everything from email to websites to e-commerce, are designed to engage the customer as effectively on a mobile device as on a computer. Even traditional marketing tactics such as television ads should reflect the growing likelihood that Hispanics have a smartphone either nearby or physically in their hand and are ready to engage. In fact, 37 percent of all Hispanic adults say that they often use their cell phone while watching television compared with 29 percent of non-Hispanics. Among smartphone owners, the share of Hispanics who use their phone while watching television shoots up to 50 percent versus 42 percent of non-Hispanics. Millennial smartphone owners are among the most likely to be splitting their attention between the big and small screen with 61 percent of Hispanic Millennials and 58 percent of non-Hispanic Millennials doing so. Knowing what specific mobile activities Hispanics are engaging in is critical for marketers in identifying the best tactics for reaching them via mobile. The chart below shows that Hispanics engage in most smartphone activities at above average rates, but they are much more likely than non-Hispanics to IM/chat on their phone. As a result they are slightly less likely than non-Hispanics to email from their phone, though the vast majority of Hispanic smartphone owners still use mobile email. Other activities that marketers will find Hispanics engaging in at above average rates include watching videos, using mobile GPS and listening to music. Learn more about how Experian Marketing Services can help your organization more effectively target, reach and engage today’s Hispanic consumer.

May 19,2014 by

Subscribe to our newsletter

Enter your name and email for the latest updates

This site is protected by reCAPTCHA and the Google Privacy Policy and Terms of Service apply.

About Experian Marketing Services

At Experian Marketing Services, we use data and insights to help brands have more meaningful interactions with people. As leaders in the evolution of the advertising landscape, Experian Marketing Services can help you identify your customers and the right potential customers, uncover the most appropriate communication channels, develop messages that resonate, and measure the effectiveness of marketing activities and campaigns.

Visit our website

Subscribe to our newsletter

Stay up to date on the latest industry news and receive expert tips from our marketing experts.
Subscribe now!