
Summer officially arrives on June 21. The busiest travel season of the year is on the horizon, and freecreditscore.com™ wants to help travelers mitigate post-vacation credit debt that can impact their credit long after a vacation ends. Here are five tips to avoid the pitfalls of a post-vacation credit sunburn:

Bankcard and mortgage originations kick off the first quarter with double-digit year-over-year growth
TrendsFurther evidence of economic recovery throughout the nation, an Experian trends analysis of new mortgages and bankcards from Q1 2013 showed a 16 percent year-over-year increase in mortgage origination volume and a 20 percent increase in bankcard limits. Other insights offered by Experian, include evidence of a strong rebound in the Midwest as well as unprecedented lows in bankcard delinquencies.
Experian helps World Omni design, test, execute and continuously improve its automotive finance decision strategies
News Experian has provided World Omni Financial Corp. (World Omni) with a flexible decision management solution based on its PowerCurve™ and Attribute Toolbox™ software that will streamline the processing and decisioning of automotive finance applications.
“We needed a decision management solution, and Experian could deliver cost-effective, robust technology that quickly and seamlessly integrated with our loan origination system. This tool will enable us to grow our automotive finance business,” said Bill Shope, vice president of Portfolio Management at World Omni Financial Corp. “The solution also needed to be flexible enough to provide us with long-term support and growth capabilities as customer needs and market dynamics change.”
Experian has provided World Omni Financial Corp. (World Omni) with a flexible decision management solution based on its PowerCurve™ and Attribute Toolbox™ software that will streamline the processing and decisioning of automotive finance applications.
“We needed a decision management solution, and Experian could deliver cost-effective, robust technology that quickly and seamlessly integrated with our loan origination system. This tool will enable us to grow our automotive finance business,” said Bill Shope, vice president of Portfolio Management at World Omni Financial Corp. “The solution also needed to be flexible enough to provide us with long-term support and growth capabilities as customer needs and market dynamics change.”
Related Posts
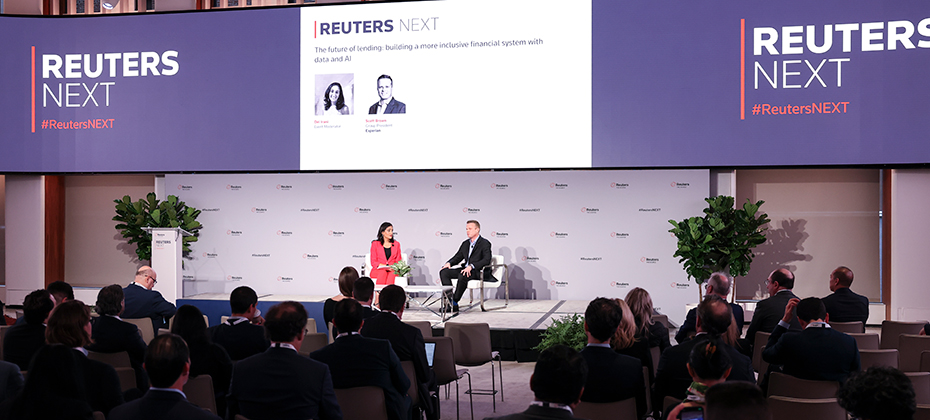
Insights from Reuters Next: Building a More Inclusive Financial System with Data and AI
Data & AnalyticsToday, we stand at the forefront of a digital revolution that is reshaping the financial services industry. And, against this backdrop, financial institutions are at vastly different levels of maturity; the world’s biggest banks are managing large-scale infrastructure migrations and making significant investments in AI while regional banks and credit unions are putting plans in place for modernization strategies, and fintechs are purpose-built and cloud native. To explore this more, I recently had the privilege of attending the annual Reuters NEXT live event in New York City. The event gathers globally recognized leaders across business, finance, technology, and government to tackle some of today’s most pressing issues. On the World Stage, I joined Del Irani, a talented anchor and broadcast journalist, to discuss the future of lending and the pivotal role of data and AI in building a more inclusive financial system. Improving financial access Our discussion highlighted the lack of access to traditional financial systems, and the impact it has on nearly 100 million people in North America alone. Globally, the problem affects over one billion people. These people, who are credit invisible, unscoreable, or have subprime credit scores, are unable to secure everyday financial products that many of us take for granted. What many don’t realize is, this is not a fringe subset of the population. Most of us, myself included, know someone who has faced the challenges of financial exclusion. Everyday Americans, including young people who are just starting out, new immigrants and people from diverse communities, often lack access to mainstream financial products. We discussed how traditional lending has a limited view of a consumer. Like looking through a keyhole, the lender’s understanding of the person in view is often incomplete and obstructed. However, with expanded data, technology, and advanced analytics, there is an opportunity to better understand the whole person, and as a result have a more inclusive financial system. At Experian, we have a unique ability to connect the power of traditional credit with alternative data, bringing a more holistic understanding of consumers and their behaviors. We are dedicated to leveraging our rich history in data and our expertise in technology to create the future of credit and ultimately bring financial power to everyone. The future of lending After spending two days with over 700 industry leaders from around the world, one thing is abundantly clear: much like the early days of the internet, today, we are at the cutting-edge of a technical revolution. Reflecting on my time at Reuters NEXT, I am particularly excited by the collective commitment to drive innovative, and smarter ways of working. We are only beginning to scratch the surface of how data and technology can transform financial services, and Experian is positioned to play a significant role. As we look to the future, I am excited about the ways we will create new opportunities for businesses and consumers alike.
The advertising ecosystem has seen significant transformation over the past few years, with increased privacy regulation, changes in available signals, and the rise of channels like connected TV and retail media. These changes are impacting the way that consumers interact with brands and how brands understand and continue to deliver relevant messages to consumers with precision. Experian has been helping marketers navigate these changes, and as a result, our marketing data and identity solutions underpin much of today’s advertising industry. We’re committed to empowering marketers and agencies to understand and reach their target audiences, across all channels. Today, we are excited to announce our acquisition of Audigent—a leading data and activation platform in the advertising industry. With Audigent’s combination of first-party publisher data, inventory and deep supply-side distribution relationships, publishers, big and small, can empower marketers to better understand their customers, expand the reach of their target audiences and activate those audiences across the most impactful inventory. I am excited to bring together Audigent’s supply-side network as a natural extension to our existing demand-side capabilities. Audigent’s ability to combine inventory with targeted audiences using first-party, third-party and contextual signals provides the best of all worlds, allowing marketers to deliver campaigns centered on consumer choices, preferences, and behaviors. The addition of Audigent further strengthens our strategy to be the premier independent provider of marketing data and identity, ultimately creating more relevant experiences for consumers. To learn more about Experian and Audigent, visit https://www.experian.com/marketing/ and https://audigent.com/.
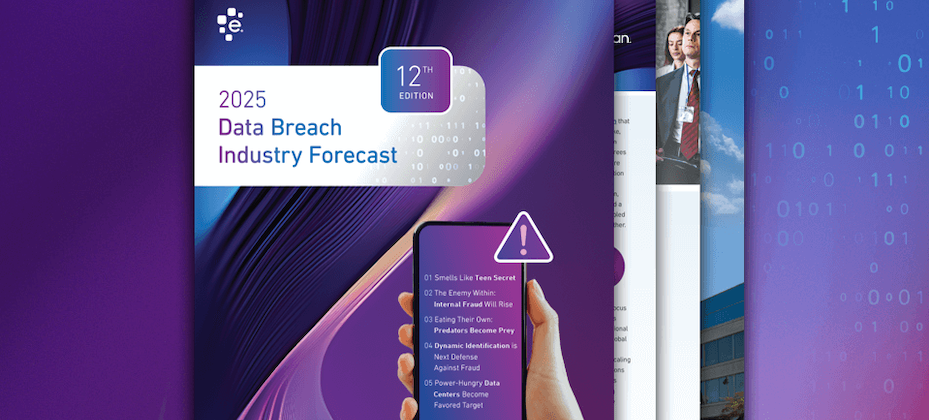
Experian Releases its 12th Annual Data Breach Industry Forecast Highlighting Five Predictions for 2025
Data & AnalyticsWhen it comes to cybercriminals and threat vectors, we need to expect the unexpected. Experian’s 12th annual Data Breach Industry Forecast highlights several potential trends for 2025, with AI playing a central role. This year has already seen more data breaches and impacted consumers than 2023, indicating that global data breaches are not slowing down. Some things to watch out for next year includes the potential for more internal fraud. As companies train employees on AI, there is a growing risk that some will misuse their knowledge for internal theft and sourcing sensitive information. Another trend may be cyberattackers targeting large data centers, with the growth of generative AI introducing power as a new attack vector. It’s reported that a single ChatGPT query uses significantly more electricity than a standard Google search, making data centers and cloud infrastructure vulnerable, especially in countries with varying security standards. We expect AI-related attacks to dominate the headlines next year and investments in cybersecurity will increase to tackle this emerging threat, as hackers leverage AI for phishing, password cracking, malware, and deepfakes. Jim Steven, Head of Crisis and Data Response Services at Experian Global Data Breach Resolution in the UK, anticipates that global data breaches will persist at their current rate next year. He notes that ransomware attacks are likely to become even more sophisticated with the integration of AI. Additionally, Steven predicts that threat actors will escalate their tactics to achieve greater rewards, and the misuse of consumer data to damage reputations will increase in 2025. To access the complimentary report, click here.