All posts by Guest Contributor

Despite rising concerns about identity theft, most Americans aren’t taking basic steps to make it harder for their information to be stolen, according to a survey Experian conducted in August 2017: Nearly 3 in 4 consumers said they’re very or somewhat concerned their email, financial accounts or social media information could be hacked. This is up from 69% in a similar survey Experian conducted in 2015. Nearly 80% of survey respondents are concerned about using a public Wi-Fi network. Yet, barely half said they take the precaution of using a password-protected Wi-Fi network when using mobile devices. 59% of respondents are annoyed by safety precautions needed to use technology — up 12% from 2015. When your customer’s identity is stolen, it can negatively impact the consumer and your business. Leverage the tools and resources that can help you protect both. Protect your customers and your business>

Synthetic identity fraud is on the rise across financial services, ecommerce, public sector, health and utilities markets. The long-term impact of synthetic identity remains to be seen and will hinge largely upon forthcoming efforts across the identity ecosystem made up of service providers, institutions and agencies, data aggregators and consumers themselves. Making measurement more challenging is the fact that much of the assumed and confirmed losses are associated with credit risk and charge offs, and lack of common and consistent definitions and confirmation criteria. Here are some estimates on the scope of the problem: Losses due to synthetic identity fraud are projected to reach more than $800 million in 2017.* Average loss per account is more than $10,000.* U.S. synthetic credit card fraud is estimated to reach $1.257 billion in 2020.* As with most fraud, there is no miracle cure. But there are best practices, and topping that list is addressing both front- and back-end controls within your organization. Synthetic identity fraud webinar> *Aite Research Group

Our national survey found that consumers struggle to find a credit card that meets their needs. They say there are too many options and it’s too time-consuming to research. What do consumers want? With 53% of survey respondents not satisfied with their current cards and 1 in 3 saying they’re likely to get a new card within 6 months, now’s the time to start personalizing offers and growing your portfolio. Start personalizing offers today>

The collections space has been migrating from traditional mail and outbound calls to electronic payment portals, digital collections and virtual negotiators. Now that collectors have had time to test virtual collections, we’ve collected some data points. Here are a few: On average, 52% of consumers who visit a digital site will proceed to a payment schedule if the right offer is made. 21% of the visits were outside the core hours of 8 a.m. to 8 p.m., an indication that traditional business hours don’t always work. Of the consumers who committed to a payment plan, only 56% did it in a single visit. The remaining 44% did so mostly later that day or on a subsequent day. As more financial institutions test this new virtual approach, we anticipate customer satisfaction and resolutions will continue to climb. Get your debt collections right>

With 1 in 6 U.S. residents being Hispanic, now is a great time for financial institutions to reflect on their largest growth opportunity. Here are 3 misconceptions about the multifaceted Hispanic community that are prevalent in financial institutions: Myth 1: Hispanic consumers are only interested in transaction-based products. In truth, product penetration increases faster among Hispanic members compared with non-Hispanic members when there’s a strategic plan in place. Myth 2: Most Hispanics are undocumented. The facts show that of the country’s more than 52 million Hispanics, most are native-born Americans and nearly 3 in 4 are U.S. citizens. Myth 3: The law prevents us from serving immigrants. Actually, financial institutions can compliantly lend to individuals who have an Individual Taxpayer Identification Number. There are many forms of acceptable government-issued identification, such as passports and consular identification cards. Solidifying the right organizational mentality, developing a comprehensive strategy based on segmentation, and defining what success truly looks like. These are all part of laying the foundation for success with the Hispanic market. Learn more>

Direct mail is dead. It’s so 90s. Digital is the way to reach consumers. Marketers have heard this time and again, and many have shifted their campaign focus to the digital space. But as our lives become more and more consumed by digital media, consumers are giving less time and attention to the digital messages they receive. The average lifespan of an email is now just two seconds and brand recall directly after seeing a digital ad is just 44%, compared to direct mail which has a brand recall of 75%. Further research shows direct mail marketing is one of the most effective tools for customer acquisition and loan growth. The current Data & Marketing Association (DMA) response rate report reveals the direct mail response rates for 2016 were at the highest levels since 2003. Additionally, while mailing volume has trended down since October 2016, response rates have trended up, and reached 0.68% in March 2017, up from 0.56% in October 2016. Using data and insights to tailor a direct mail campaign can yield big results. Here are some attention-grabbing tips: Identify Your Target Market: Before developing your offer and messaging strategy, begin with the customer profile you are trying to attract. Propensity models and estimated interest rates are great tools for identifying consumers who are more likely to respond to an offer. Adding them as an additional filter to a credit-qualified population can help increase response rates. Verify your Mailing List: Experian’s address verification software validates the accuracy and completeness of a physical address, flags inaccuracies, and corrects errors before they can negatively impact your campaign. Personalize the Offer: Consumers are more likely to open offers that are personalized, and appeal to their life stage, organizational affiliations or interests. Experian’s Mosiac profile report is a simple, inexpensive way to gather data-based insight into the lifestyle and demographics of your audience. Time the Offer: Timing your campaign with peak market demand is key. For example, personal loan demand is highest in the first quarter after the holidays, while student loans demand peaks in the Spring. Direct mail can help overcome digital fatigue that many consumers are experiencing, and when done right, it’s the printed piece that helps marketers boost response rates.
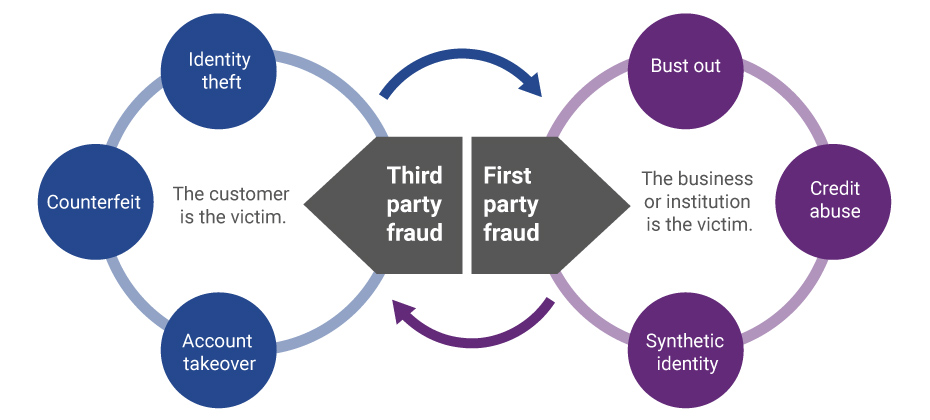
Evolution of first-party fraud to third Third-party and first-party schemes are now interchangeable, and traditional fraud detection practices are less effective in fighting these evolving fraud types. Fighting this shifting problem is a challenge, but it isn’t impossible. To start, incorporate new and more robust data into your identity verification program and provide consistent fraud classification and tagging. Learn more>

It should come as no surprise that the process of trying to collect on past-due accounts has been evolving. We’ve seen the migration from traditional mail and outbound calls, to offering an electronic payment portal, to digital collections and virtual negotiators. Being able to get consumers who have past-due debt on the phone to discuss payments is almost impossible. In fact, a recent informal survey divulged a success rate of a 15% contact rate to be considered the best by several first-party collectors; most reported contact rates in the 8%-range. One can only imagine what it must be like for collection agencies and debt buyers. Perhaps, inviting the consumer to establish a non-threatening dialog with an online system can be a better approach? Now that collectors have had time to test virtual collections, we’ve collected some data points. Conversion rates, revisits, and time of day An analysis of several clients found that on average 52% of consumers that visit a digital site will proceed to a payment schedule if the right offer is made. 21% of the visits were outside the core hours of 8 a.m. to 8 p.m., an indication that consumers were taking advantage of the flexibility of reaching out at any time of the day or night to explore their payment and settlement options. The traditional business hours don’t always work. Here is where it really gets interesting, and invites a clear comparison to the traditional phone calls that collectors make trying to get the consumer to commit to a payment plan on the line. Of the consumers that committed to a payment plan, only 56% did it in a single visit. The remaining 44% that committed to payments did so mostly later that day, or on a subsequent day. This strongly suggests they either took time to check their financial status, or perhaps asked a friend or family to help with the payment. In other words, rather than refusing to agree to an instantaneous agreement pressured by a collector, the consumer took time to reflect and decide what was the best course of action to settle the amount due. On a similar note, the attrition rate of “Promises to Pay” were 24% lower using online digital solutions versus the traditional collector phone call. This would be consistent with more time to agree to a payment plan that could be met, rather than weakly agreeing to a collector phone call just to get the collector off the phone. Another possible reason for a lower attrition rate may be that a well-defined digital collection solution can send out reminders to consumers via email or text in advance of the next scheduled payment, so that the consumer can be reminded to have the funds available when the next payment hits their account. For accounts where settlement offers are part of the mix, a higher percentage of balances is being resolved versus the collection floor. In fact, the average payment improvement is 12% over what collectors tend to get on the collections floor. The reason for this significant change is unclear, but the suspicion is that a digital collection solution will negotiate stronger than a collector, who is often moving to the bottom of an acceptable range too soon. What's next? Further assessing the consumer’s needs and capabilities during the negotiation session will undoubtedly be a theme going forward. Logical next steps will include a “behind-the-scenes” look at the consumer’s entire credit picture to help the creditor craft an optimal settlement amount that both the consumer can meet, and at the same time optimizes recovery. Potential impact to credit scores will also come into the picture. Depending on where the consumer and his past-due debt is in the credit lifecycle, being able to reasonably forecast the negative impact of a missed payment can act as an additional argument for making a past-due or delinquent payment now. As more financial institutions test this new virtual approach, we anticipate customer satisfaction and resolutions will continue to climb.
We recently analyzed millions of online transactions from the first half of 2017 to identify fraud attack rates. Here are the top 3 riskiest states for e-commerce billing and shipping fraud for H1 2017: Riskiest states for billing fraud Oregon Delaware Washington, D.C. Riskiest states for shipping fraud Oregon Delaware Florida Fraudsters are extremely creative, motivated and often connected. Protect all points of contact with your customers to prevent this growing type of fraud. Is your state in the top 10?

National Hispanic Heritage Month is observed each year from Sept. 15 to Oct. 15, by celebrating the histories, cultures and contributions of American citizens whose ancestors came from Spain, Mexico, the Caribbean and Central and South America. With one in six U.S. residents being Hispanic, all communities are impacted by the contributions of Hispanics—and now is a great time for financial institutions to reflect upon their largest growth opportunity. What is the best way to reach Hispanic consumers? What are the nuances of the Hispanic market? What are some of the myths FIs have about the Hispanic community? Miriam De Dios Woodward, CEO of Coopera, a Hispanic market strategy firm that helps credit unions reach and serve the Hispanic consumer segment, recently chatted with Experian about serving the Hispanic market. Here she shares her thoughts: Are there special considerations or insights credit unions should know when serving the Hispanic market? It’s very important to understand the Hispanic market is nuanced. There are 22 Spanish-speaking Latin American countries from which prospective Hispanic credit union members may hail. Add to that the fact, many U.S.-born Hispanics think, speak and behave differently than their parents and grandparents. Layer over this the existence of segments like small business owners or Millennials and you can begin to see the complexities involved with targeting and serving a multi-faceted Hispanic market. A smart Hispanic membership growth strategy will be based on segmentation, so credit unions should be willing to invest upfront in good market research. You have to understand what your local Hispanic community really looks like before you can mobilize your teams and leadership around serving them well. Are there particular consumer trends you have seen in the Hispanic community that impact the financial services space? The increasing digitization of financial services is a trend that definitely impacts Hispanic consumers. That’s because Hispanics typically over-index in studies that look at consumer use of connected devices, online banking and social media. A good Hispanic membership growth strategy will take mobile and digital products and services into account and will be tailored to the specific needs of local Hispanic communities. People often assume the Hispanic market is largely centered in states like California, Arizona, Texas and New Mexico. Are you finding that credit unions outside of these southwestern states are discovering they too need to build out a strategy in partnering with this consumer base? Absolutely. Hispanic population growth is happening far beyond so-called “gateway states” like those you mention above. In fact, states such as North Dakota, Kentucky, Louisiana, Delaware and Maryland actually saw the largest Hispanic population growth between 2007 and 2014. Midwestern states, too, are discovering just as many opportunities for engagement with their own growing numbers of Hispanic residents. Iowa and Wisconsin, for instance, each experienced explosive growth rates and now count Hispanics among one of the largest, fastest-growing and youngest groups in their cities. With a comprehensive and strategic approach to Hispanic membership growth, credit unions in unexpected places can become the preferred financial institution for this important segment. That’s because a great number of Hispanics in the U.S. are not tethered to an existing financial relationship. For more on this, check out our recent white paper Hispanic Member Growth Not Just for 'Gateway States' Anymore. What are the biggest myths financial services companies have about the Hispanic community? While there continue to be many misconceptions about the multifaceted Hispanic community, the following three continue to prevail most heavily. Myth: Hispanic consumers are only interested in transaction-based products. Check cashing and remittances are necessary services for many first generation Hispanic segments. At the same time, many of these consumers are interested in long-term relationships. Our own research indicates product penetration increases at a faster rate among Hispanic members as compared to non-Hispanic members when credit unions execute a strategic plan. Myth: The majority of Hispanics are undocumented. This misperception has been somewhat renewed this year with all the political back and forth on the subject of immigration. That’s why it’s so important for credit unions to educate – from the inside out – stakeholders on the facts. Many people do not know, for instance, that of the country's more than 52 million Hispanics, most are native-born Americans, and nearly three in four are U.S. citizens. Myth: The law prevents us from serving immigrants. There are many forms of acceptable government issued identification, such as passports and consular cards that are in full compliance with the Patriot Act and Customer Identification Program rules. In addition, financial institutions can compliantly lend to individuals who have Individual Taxpayer Identification Numbers. In fact, the NCUA wants credit unions to serve Hispanic members, including Hispanic immigrants. For more on this, check out the recording of the NCUA hosted panel, “Unique Challenges and Opportunities Serving Hispanic Credit Union Members.” For a credit union seeking to build a relationship with this community, what are your recommendations? Are there particular products or touchpoints they should focus on? Solidifying the right organizational mentality first is an important best practice. Building buy-in, doing the market research, developing a comprehensive strategy based on segmentation and defining what success truly looks like – these are all a part of laying the foundation for success with the Hispanic market. Credit unions should also be smart about talking to and partnering with local organizations that already know – and are trusted by – Hispanic residents. Conducting focus groups with the leaders of these groups and the people they serve can give credit unions a wealth of information about the makeup of their local Hispanic community and the value they might bring to the community.

Cybersecurity cannot be successful if siloed. The entire organization must be part of the effort. Take these steps to ensure a more engaged relationship between cybersecurity teams, C-suite executives and other departments: Make the company’s chief information officer accountable directly to the chief executive officer and/or the board. Train employees at every level to spot security risks and to understand their role in protecting the entire organization from cyberattacks. Put cybersecurity on the agenda for every board and executive-level meeting, and incorporate it into quarterly state-of-the-company, all-hands meetings. With cybersecurity threats evolving and escalating daily, companies need to make engagement a priority that starts at the top and continues through every level of the organization. Increasing engagement in cybersecurity >

We use our laptops and mobile phones every day to communicate with our friends, family, and co-workers. But how do software programs communicate with each other? APIs--Application Programming Interfaces--are the hidden backbone of our modern world, allowing software programs to communicate with one another. Behind the scenes of every app and website we use, is a mesh of systems “talking” to each other through a series of APIs. Today, the API economy is quickly changing how the world interacts. Everything from photo sharing, to online shopping, to hailing a cab is happening through APIs. Because of APIs, technical innovation is happening at a faster pace than ever. We caught up with Edgar Uaje, senior product manager at Experian, to find out more about APIs in the financial services space. What exactly are APIs and why are they so important? And how do they apply to B2B? APIs are the building blocks of many of our applications that exist today. They are an intermediary that allows application programs to communicate, interact, and share data with various operating systems or other control programs. In B2B, APIs allow our clients to consume our data, products, and services in a standard format. They can utilize the APIs for internal systems to feed their risk models or external applications for their customers. As Experian has new data and services available, our clients can quickly access the data and services. Are APIs secure? APIs are secure as long as the right security measures are put in place. There are many security measures that can be utilized such as authentication, authorization, channel encryption and payload encryption. Experian takes security seriously and ensures that the right security measures are put in place to protect our data. For example, one of the recent APIs that was built this year utilizes OAuth, channel encryption, and payload encryption. The central role of APIs is promoting innovation and rapid but stable evolution, but they seem to only have taken hold selectively in much of the business world. Is the world of financial services truly ready for APIs? APIs have been around for a long time, but they are getting much more traction recently. Financial tech and online market place lending companies are leading the charge of consuming data, products, and services through APIs because they are nimble and fast. With standard API interfaces, these companies can move as fast as their development teams can. The world of financial services is evolving, and the time is now for them to embrace APIs in day-to-day business. How can APIs benefit a bank or credit union, for example? APIs can benefit a bank or credit union by allowing them to consume Experian data, products, and services in a standard format. The value to them is faster speed to market for applications (internal/external), ease of integration, and control over the user’s experience. APIs allow a bank or credit union to quickly develop new and innovative applications quickly, with the support of their development teams. Can you tell us more about the API Developer Portal? Experian will publish the documentation of our available APIs on our Developer Portal over time as they become available. Our clients will have a one-stop shop to view available APIs, review API documentation, obtain credentials, and test APIs. This is simplifying data access by utilizing REST API, making it easier for our clients.
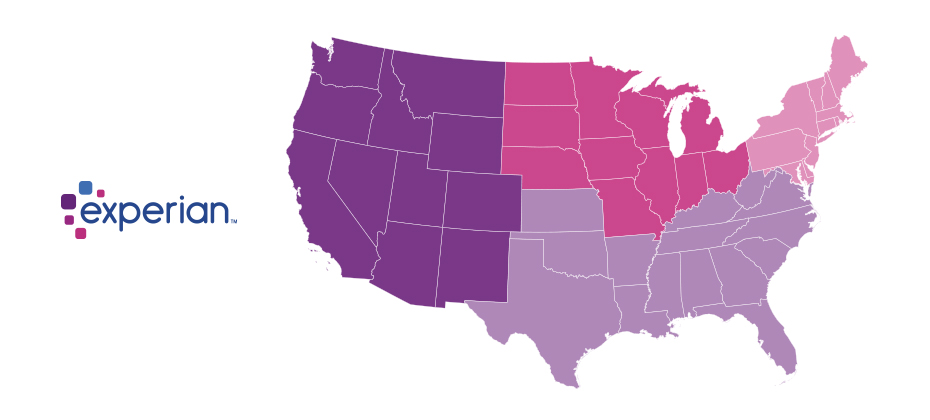
Since the advent of the internet, our lives have changed drastically for the better. We can perform many of life’s daily activities from the comfort of our own home. According to Aite, in 2016 alone 36 million Americans made some form of mobile payment — paying a bill, purchasing something online, paying for fast food or making a mobile wallet purchase at a retailer. Simply put, the internet has made our lives easier. But with the good also comes the bad. While most consumers have moved to the digital world, so have fraudsters. With minimal risk and high reward at stake, e-commerce fraud attacks have increased dramatically over the last few years, with no signs of slowing down. We recently analyzed millions of transactions from the first half of 2017 to identify fraud attack rates based on billing and shipping addresses and broke down the findings into various geographic trends. Fraud attack rates represent the attempted fraudulent e-commerce transactions against the population of overall e-commerce orders. Consumers living out West and in the South have experienced more than their fair share of fraud. During the first half of 2017, the West and the South were the top two regions for both billing and shipping attacks. While both regions were at the top during the same time last year, the attacks themselves have increased substantially. Given the proximity to seaports and major international airports, this is somewhat unsurprising — particularly for shipping fraud — as many fraudsters will leverage reshippers to transport goods soon after delivery. .dataTb{margin:20px auto;width:100%}.dataTb:after{clear:both}.dataTb table{}.dataTb td,.dataTb th{border:1px solid #ddd;padding:.8em}.dataTb th{background:#F4F4F4}.tbL{float:left;width:49%}.tbR{float:right;width:49%;margin:0 0 0 2%} Shipping: Riskiest Regions Region Attack rate West 38.1 South 32.1 Northeast 27.0 North Central 20.7 Billing: Riskiest Regions Region Attack rate West 37.2 South 32.9 Northeast 27.3 North Central 24.0 At the state level, the top three shipping fraud states remained the same as 2016 — Delaware, Oregon and Florida — but the order changed. Oregon was the most targeted, with a fraud rate of 135.2 basis points, more than triple its rate at in the end of 2016. Though no longer in the top spot, Delaware saw alarming spikes as well, with shipping attack rates nearly triple last year’s rate at 128.6 basis points and billing attacks at 79.6 basis points. .dataTb{margin:20px auto;width:100%}.dataTb:after{clear:both}.dataTb table{}.dataTb td,.dataTb th{border:1px solid #ddd;padding:.8em}.dataTb th{background:#F4F4F4}.tbL{float:left;width:49%}.tbR{float:right;width:49%;margin:0 0 0 2%} Shipping: Riskiest States State Attack rate Oregon 135.2 Delaware 128.2 Florida 57.4 New York 45.0 Nevada 36.9 California 36.9 Georgia 33.5 Washington, D.C 30.8 Texas 29.6 Illinois 29.4 Billing: Riskiest States Region Attack rate Oregon 87.5 Delaware 79.6 Washington, D.C. 63.0 Florida 47.4 Nevada 38.8 California 36.9 Arkansas 36.6 New York 35.5 Vermont 34.2 Georgia 33.4 Diving a bit deeper, ZIPTM codes in Miami, Fla., make up a significant portion of the top 10 ZIP CodeTM lists for shipping and billing attacks — in fact, many of the same ZIP codes appear on both lists. The other ZIP Code that appears on both lists is South El Monte, Calif., which has a high percentage of industrial properties — common targets for fraudsters to ship packages, then reship overseas. You can download the top 100 riskiest Zip Codes in the U.S. for H1 2017. .dataTb{margin:20px auto;width:100%}.dataTb:after{clear:both}.dataTb table{}.dataTb td,.dataTb th{border:1px solid #ddd;padding:.8em}.dataTb th{background:#F4F4F4}.tbL{float:left;width:49%}.tbR{float:right;width:49%;margin:0 0 0 2%} Shipping: Top 10 riskiest ZIP™ Codes ZIP Code Attack rate 33122 [Miami, Fla.] 2409.4 91733 [South El Monte, Calif.] 1655.5 33198 [Miami, Fla.] 1295.2 33166 [Miami, Fla.] 1266.0 33195 [Miami, Fla.] 1037.3 33192 [Miami, Fla.] 893.9 97251 [Portland, Ore.] 890.6 07064 [Port Reading, NJ] 808.9 89423 [Minden, Nev.] 685.5 77072 [Houston, Tex.] 629.3 Billing: Top 10 riskiest ZIP™ Codes ZIP Code Attack rate 77060 [Houston, Tex.] 1337.6 33198 [Miami, Fla.] 1215.6 33122 [Miami, Fla.] 1106.2 33166 [Miami, Fla.] 1037.4 91733 [South El Monte, Calif.] 780.1 33195 [Miami, Fla.] 713.7 97252 [Portland, Ore.] 670.8 33191 [Miami, Fla.] 598.8 33708 [St. Petersburg, Fla.] 563.6 33792 [Miami, Fla.] 493.0 As e-commerce fraud continues to grow, businesses need to be proactive to keep themselves and their customers safe. That means incorporating multiple, layered fraud prevention strategies that work together seamlessly — for example, understanding details about users and their devices, knowing how users interact with the business and evaluating previous transaction history. This level of insight can help businesses distinguish real customers from nefarious ones without impacting the customer experience. While businesses are ultimately responsible for the safety of customers and their data, the onus doesn’t rest solely with them. Consumers should also be vigilant when it comes to protecting their digital identities and payment information. That means creating strong, unique passwords; actively monitoring online accounts; and using two-factor authentication to secure account access. At the end of the day, e-commerce fraud is a challenge that businesses and consumers will experience for the foreseeable future. But rising attack rates don’t have to spell doom and gloom for the industry. E-commerce growth is still extremely strong, as consumers interact through multiple channels (in-store, mobile and web) and expect a personalized experience. Establishing trust and verifying digital identities are key to meeting these latest expectations, which provide new opportunities for businesses and consumers to interact seamlessly and transact securely. With multiple safeguards in place, businesses have a variety of options to protect their customers and their brand reputation. Experian is a nonexclusive full-service provider licensee of the United States Postal Service®. The following trademarks are owned by the United States Postal Service®: ZIP and ZIP Code. The price for Experian’s services is not established, controlled or approved by the United States Postal Service.

There’s a consensus that too many C-suite executives are disengaged with their organization’s cybersecurity efforts. That indifference can seriously hamper an organization’s ability to quickly and effectively respond to an incident. To best protect the organization, cybersecurity professionals should take the following steps to increase engagement: Pinpoint the greatest cybersecurity issues your organization faces and create descriptive verbiage that simplifies these risks. Engage in one-on-one meetings with key leaders to help them understand how cybersecurity risks affect not only the overall organization, but their domain as well. Stage a cybersecurity simulation exercise for your C-suite executives in which members role-play a data breach scenario. Leadership is not the only department that should be invested in protecting the organization. Next week, we’ll look at how to engage the entire organization in cybersecurity efforts. If you’d like, you can jump ahead and read it now. Increasing engagement in cybersecurity

Leadership and Cybersecurity Multiple studies suggest many executives aren’t as engaged as they should be when ensuring their organizations are prepared to mitigate and manage cybersecurity risks. Insights from our Fourth Annual Data Breach Preparedness Survey, conducted by the Ponemon Institute, support this sentiment. Of the privacy, compliance and IT professionals polled: 57% said their company’s board, chairman and chief executive officer were not informed about or involved in data breach response planning. 60% have leadership who don’t want to know immediately when a material breach occurs. 66% have a board that doesn’t understand the specific cybersecurity threats their organization faces. 74% said their board isn’t willing to take ownership for successful incident response plan implementation. For organizations to protect themselves, cybersecurity professionals need to create greater engagement among the organization’s leadership. Next week, we’ll look at how they can accomplish this. If you’d like, you can jump ahead and read it now. Fourth Annual Data Breach Preparedness Survey