All posts by Guest Contributor

Winning the loyalty of millennials continues to be a key area of opportunity for financial institutions.

While marketers typically begin deploying Halloween emails in September, last-minute mailings receive the highest response.
According to the latest State of the Automotive Finance Market report, a record 55.5% of all used vehicles were financed in Q2 2015, compared to 53.8% the previous year.

Driver of success: Mitigate auto lending risk A culture of learning is a key driver of success. Does your risk culture continue to adapt? There are many issues within auto lending that are unique to other financial services ecosystems: the direct versus indirect relationship, insights of the asset influencing the risk insights, new versus used vehicle transactions influencing risk and terms, and more. However, there is one universal standard common to all financial services cultures — change.. Change is constant, and an institution’s marketing and risk organizations need to be constantly learning to stay abreast of dealer, consumer, competitor and regulatory issues. No one has said it better than Jack Welch: “An organization’s ability to learn, and translate that learning into action rapidly, is the ultimate competitive advantage.” This statement was quickly followed by a command: “Change before you have to.” So the challenge for the portfolio manager is to ensure there are the system features, data sources, management reporting structures, data access features, analytic skills, broad management team skill sets, and employee feedback and incentive plans to drive the organization to a constant state of renewal. The challenge for many smaller and midsize lenders is to determine what systems and skills need to be in-house and what tasks are better left for a third party to handle. For consumer-level data, vehicle history and valuation data, and fraud alert flags, it seems reasonable to leverage solutions from established third parties: credit reporting agencies. After that, the solutions to the many other needs may be more specific to the lender legacy skill set and other support relationships: Are there strong in-house data-management and analytic skills? There is a significant difference between management information and data analysis driving policy and portfolio performance forecasts. Does the internal team have both? Is the current operating platform(s) feature-rich and able to be managed and enhanced by internal resources within tight time frames? Is the management team broadly experienced and constantly updating best-practice insights? Is the in-house team frequently engaged with the regulatory community to stay abreast of new mandates and initiatives? There is a solution. Experian® offers the data, software, solutions, management information, analytic solutions and consulting services to tie everything together for a lender-specific best configuration. We look forward to hearing from you to discuss how we can help.

Key drivers to auto financial services are speed and precision. What model year is your decisioning system? In the auto world the twin engineering goals are performance and durability. Some memorable quotes have been offered about the results of all that complex engineering. And some not so complex observations. The world of racing has offered some best examples of the latter. Here’s a memorable one: “There’s no secret. You just press the accelerator to the floor and steer left. – Bill Vukovich When considering an effective auto financial services relationship one quickly comes to the conclusion that the 2 key drivers of an improved booking rate is the speed of the decision to the consumer/dealer and the precision of that decision – both the ‘yes/no’ and the ‘at what rate’. In the ‘good old days’ a lender relied upon his dealer relationship and a crew of experienced underwriters to quickly respond to a sales opportunities. Well, these days dealers will jump to the service provider that delivers the most happy customers. But, for all too many lenders some automated decisioning is leveraged but it is not uncommon to still see a significantly large ‘grey area’ of decisions that falls to the experienced underwriter. And that service model is a failure of speed and precision. You may make the decision to approve but your competition came in with a better price at the same time. His application got booked. Your decision and the cost incurred was left in the dust – bin. High on the list of solutions to this business issue is an improved use of available data and decisioning solutions. Too many lenders still underutilize available analytics and automated decisions to deliver an improved booking rate. Is your system last year’s model? Does your current underwriting system fully leverage available third party data to reduce delays due to fraud flags. Is your ability to pay component reliant upon a complex application or follow-up requests for additional information to the consumer? Does your management information reporting provide details to the incidence and disposition of all exception processes? Are you able to implement newer analytics and/or policy modifications in hours or days versus sitting in the IT queue for weeks or months? Can you modify policies to align with new dealer demographics and risk factors? The new model is in and Experian® is ready to help you give it a ride. Purchase auto credit data now.

Key drivers to auto financial services are speed and precision. What model year is your decisioning system? In the auto world the twin engineering goals are performance and durability. Some memorable quotes have been offered about the results of all that complex engineering. And some not so complex observations. The world of racing has offered some best examples of the latter. Here’s a memorable one: “There’s no secret. You just press the accelerator to the floor and steer left. – Bill Vukovich When considering an effective auto financial services relationship one quickly comes to the conclusion that the 2 key drivers of an improved booking rate is the speed of the decision to the consumer/dealer and the precision of that decision – both the ‘yes/no’ and the ‘at what rate’. In the ‘good old days’ a lender relied upon his dealer relationship and a crew of experienced underwriters to quickly respond to a sales opportunities. Well, these days dealers will jump to the service provider that delivers the most happy customers. But, for all too many lenders some automated decisioning is leveraged but it is not uncommon to still see a significantly large ‘grey area’ of decisions that falls to the experienced underwriter. And that service model is a failure of speed and precision. You may make the decision to approve but your competition came in with a better price at the same time. His application got booked. Your decision and the cost incurred was left in the dust – bin. High on the list of solutions to this business issue is an improved use of available data and decisioning solutions. Too many lenders still underutilize available analytics and automated decisions to deliver an improved booking rate. Is your system last year’s model? Does your current underwriting system fully leverage available third party data to reduce delays due to fraud flags. Is your ability to pay component reliant upon a complex application or follow-up requests for additional information to the consumer? Does your management information reporting provide details to the incidence and disposition of all exception processes? Are you able to implement newer analytics and/or policy modifications in hours or days versus sitting in the IT queue for weeks or months? Can you modify policies to align with new dealer demographics and risk factors? The new model is in and Experian® is ready to help you give it a ride. Purchase auto credit data now.

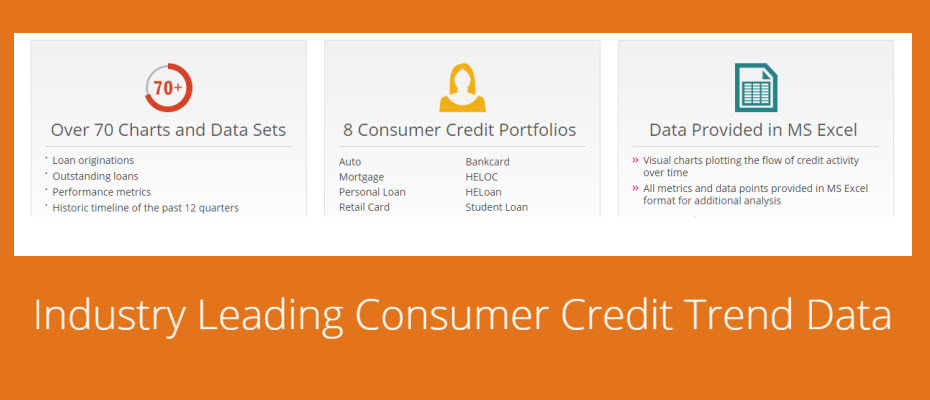
VantageScore® models are the only credit scoring models to employ the same characteristic information and model design across the three credit bureaus.

With the holidays around the corner, retailers are getting ready to release their holiday campaigns.
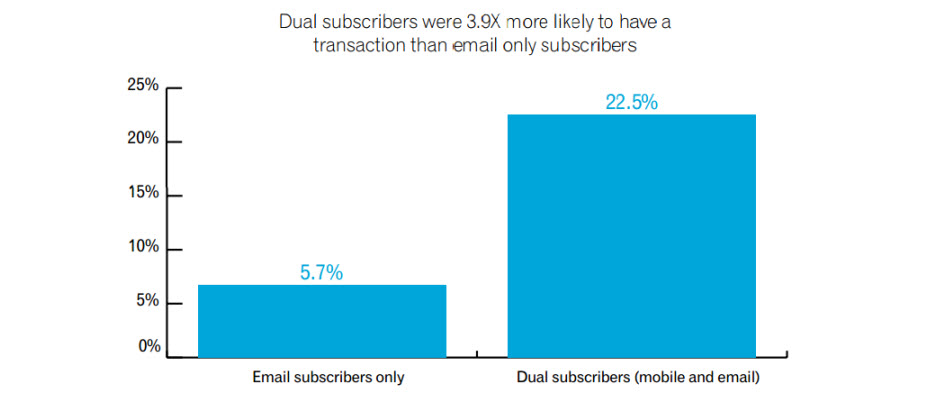
While mobile subscriber lists typically are much smaller than email lists, mobile subscribers tend to be loyal and highly engaged customers.

A recent Experian study found student loans have increased by 84% since the recession (from 2008 to 2014), surpassing credit card debt, home-equity loans and lines of credit, and automotive debt.
Driver of success: Mitigate auto lending risk A culture of learning is a key driver of success. Does your risk culture continue to adapt? There are many issues within auto lending that are unique to other financial services ecosystems: the direct versus indirect relationship, insights of the asset influencing the risk insights, new versus used vehicle transactions influencing risk and terms, and more. However, there is one universal standard common to all financial services cultures — change.. Change is constant, and an institution’s marketing and risk organizations need to be constantly learning to stay abreast of dealer, consumer, competitor and regulatory issues. No one has said it better than Jack Welch: “An organization’s ability to learn, and translate that learning into action rapidly, is the ultimate competitive advantage.” This statement was quickly followed by a command: “Change before you have to.” So the challenge for the portfolio manager is to ensure there are the system features, data sources, management reporting structures, data access features, analytic skills, broad management team skill sets, and employee feedback and incentive plans to drive the organization to a constant state of renewal. The challenge for many smaller and midsize lenders is to determine what systems and skills need to be in-house and what tasks are better left for a third party to handle. For consumer-level data, vehicle history and valuation data, and fraud alert flags, it seems reasonable to leverage solutions from established third parties: credit reporting agencies. After that, the solutions to the many other needs may be more specific to the lender legacy skill set and other support relationships: Are there strong in-house data-management and analytic skills? There is a significant difference between management information and data analysis driving policy and portfolio performance forecasts. Does the internal team have both? Is the current operating platform(s) feature-rich and able to be managed and enhanced by internal resources within tight time frames? Is the management team broadly experienced and constantly updating best-practice insights? Is the in-house team frequently engaged with the regulatory community to stay abreast of new mandates and initiatives? There is a solution. Experian® offers the data, software, solutions, management information, analytic solutions and consulting services to tie everything together for a lender-specific best configuration. We look forward to hearing from you to discuss how we can help.

According to a recent Experian Marketing Services study, 99% of companies believe achieving a single customer view is important to their business, but only 24% have a single customer view today.

According to the latest State of the Automotive Finance Market report, consumers are continuing to extend loan terms as a way to keep payments low.
A recent Experian study on data insights found that 83% of chief information officers see data as a valuable asset that is not being fully exploited within their organization, resulting in the need for more organizations to appoint a dedicated chief data officer (CDO).
While auto delinquencies declined slightly year over year (3.01% for accounts 30 days past due or greater in Q2 2015 versus 3.03% a year earlier), it is interesting to note the variance in delinquency by lender channel.