Financial Services
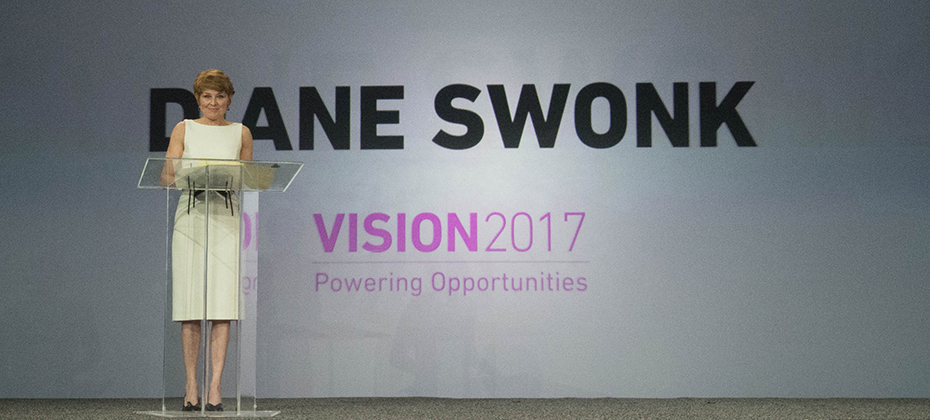
In just a few short hours, Vision attendees immersed themselves into the depths of the economy, risk models, specialty finance data, credit invisibles, student loan data, online marketplace lending and more. The morning kicked off with one of the most respected and trusted macroeconomists in the U.S., Diane Swonk. With a rap sheet filled with advising central banks and multinational companies, Swonk treated a packed house to a look back on what has transpired in the U.S. economy since the Great Recession, as well as launching into current state and speculating on the months ahead. She described the past decade not as “lost, but rather lagging.” She went onto to say this past year was transitional, and while markets slowed slightly during the months leading up the U.S. presidential election, good things are happening: We’ve finally broken out of the 2% wage rut Recruiting on college campuses has picked up The labor force is growing Debt-to-income levels have returned to where they were prerecession and Investment is coming back. “I believe we’ll see growth over 2% this year,” said Swonk. Still, change is underway. She commented on how the way U.S. consumer spending is changing, and of course we’re seeing a restructuring in the retail space. While JC Penney announces store closings, you simultaneously see Amazon moving from “click to brick,” dabbling in the opening of some actual storefronts. Globally, she said the economy is the strongest it has been in eight years. She closed by noting there is a great deal of political change and unrest in the world today, but says, “Never underestimate our abilities when we tap our human capital.” -- More than 100 attendees filled a room to hear about the current trends and the future of online lending with featured guests from Oliver Wyman, Marlette Funding and Lending USA. While speakers commented on the “hiccup” in the space last year with some layoffs and mergers, volume has continued to double every year for the past several years with roughly $40 billion in cumulative originations today. Panelists discussed the use of alternative data to decision, channel bias, the importance of partnerships and how the market will see fewer and fewer players offering just one product specialty. “It is expensive to acquire customers, so you don’t just want to have one product to sell, but rather a range,” said Sharat Shankar of Lending USA. -- The numbers in the student lending universe are astounding. In a session focused on the U.S. student loan market, new Experian data reveals there is $1.49 billion in total student loan outstandings. In fact, total outstandings have grown 21% over the past four years, while the number of trades have only grown 4%. Costs are skyrocketing. The average balance per trade has grown 17% over the past four years. “We don’t ration education in this country,” said Joe DePaulo of College Ave. Student Loans. “We give everyone access to liquidity when it comes to federal student loans – and it’s not like that in other countries.” While DePaulo notes the access is great, offering many students the opportunity to obtain higher education, he says the problem is with disclosures. Guardians are often the individuals filling out the FAFSA, but the students inherit the loans. Students, he says, rarely understand how much their monthly payment will ultimately be after graduation. For every $10,000 in student loans, he says that will generally equate to a $100 monthly payment. -- Tomorrow, Vision attendees will be treated to more breakout sessions and a concluding keynote with legendary quarterback Tom Brady.
So many insights and learnings to report after the first full day of 2017 Vision sessions. From the musings shared by tech engineer and pioneer Steve Wozniak, to a panel of technology thought leaders, to countless breakout sessions on a wide array of business topics … here’s a look at our top 10 from the day. A mortgage process for the digital age. At last. In his opening remarks, Experian President of Credit Services Alex Lintner asked the audience to imagine a world when applying for a mortgage simply required a few clicks or swipes. Instead of being sent home to collect a hundred pieces of paper to verify employment, income and assets, a consumer could click on a link and provide a few credentials to verify everything digitally. Finally, lenders can make this a reality, and soon it will be the only way consumers expect to go through the mortgage process. The global and U.S. economies are stable. In fact, they are strong. As Experian Vice President of Analytics Michele Raneri notes, “the fundamentals and technicals look really solid across the countries.” While many were worried a year ago that Brexit would turn the economy upside down, it appears everything is good. Consumer confidence is high. The Dow Jones Index is high. The U.S. unemployment rate is at 4.7%. Home prices are up year-over-year. While there has been a great deal of change in the world – politically and beyond – the economy is holding strong. The rise of the micropreneur. This term is not officially in the dictionary … but it will be. What is it? A micropreneur is a business with 0 to 4 employees bringing in no more than $200k in annual revenue. But the real story is that numbers show microbusiness are improving on many fronts when it comes to contribution to the economy and overall performance compared to other small businesses. Keep an eye on these budding business people. Fraud is running fierce. Synthetic identity losses are estimated in the hundreds of millions annually, with 50% year-over year growth. Criminals are now trying to use credit cleaners to get tradelines removed from used Synthetic IDs. Oh, and it is essential for businesses to ready themselves for “Dark Web” threats. Experts advise to harden your defenses (and play offense) to keep pace with the criminal underground. As soon as you think you’ve protected everything, the criminals will find a gap. The cloud is cool and so are APIs. A panel of thought leaders took to the main stage to discuss the latest trends in tech. Experian Global CIO Barry Libenson said, “The cloud has changed the way we deliver services to our customers and clients, making it seamless and elastic.” Combine that with API, and the goal is to ultimately make all Experian data available to its customers. Experian President of Decision Analytics Steve Platt added, “We are enabling you to tap into what you need, when you need it.” No need to “rip and replace” all your tech. Expect more regulation – and less. A panel of regulatory experts addressed the fast-changing regulatory environment. With the new Trump administration settling in, and calls for change to Dodd-Frank and the Consumer Financial Protection Bureau (CFPB), it’s too soon to tell what will unfold in 2017. CFPB Director Richard Cordray may be making a run for governor of Ohio, so he could be transitioning out sooner than the scheduled close of his July 2018 term. The auto market continues to cruise. Experian’s auto expert, Malinda Zabritski, revealed the latest and greatest stats pertaining to the auto market. A few numbers to blow your mind … U.S. passenger cars and light trucks surpassed 17 million units for the second consecutive year Most new vehicle buyers in the U.S. are 45 years of age or older Crossover and sport utility vehicles remain popular, accounting for 40% of the market in 2016 – this is also driving up finance payments since these vehicles are more expensive. There are signs the auto market is beginning to soften, but interest rates are still low, and leasing is hot. Defining alternative data. As more in the industry discuss the need for alternative data to decision, it often gets labeled as something radical. But in reality, alternative data should be simple. Experian Sr. Director of Government Affairs Liz Oesterle defined it as “getting more financial data in the system that is predicted, validated and can be disputed.” #DeathtoPasswords – could it be a reality? It’s no secret we live in a digital world where we are increasingly relying on apps and websites to manage our lives, but let’s throw out some numbers to quantify the shift. In 2013, the average U.S. consumer had 26 online accounts. By 2015, that number increased to 118 online accounts. By 2020, the average person will have 207 online accounts. When you think about this number, and the passwords associated with these accounts, it is clear a change needs to be made to managing our lives online. Experian Vice President David Britton addressed his session, introducing the concept of creating an “ultimate consumer identity profile,” where multi-source data will be brought together to identify someone. It’s coming, and all of us managing dozens of passwords can’t wait. “The Woz.” I guess you needed to be there, but let’s just say he was honest, opinionated and notes that while he loves tech, he loves it even more when it enables us to live in the “human world.” Too much wonderful content to share, but more to come tomorrow …

In a May 4 speech before the ACA International Conference in Washington, FCC Commissioner Michael O’Rielly criticized the FCC’s past decisions on Telephone Consumer Protection Act (TCPA) and outlined his vision on the direction that the new Commission should head to provide more certainty to businesses. Commissioner O’Rielly noted that prior decisions by the FCC and courts have “expanded the boundaries of TCPA far beyond what I believe Congress intended.” He said that the new leadership at the Commission and a new Bureau head overseeing TCPA, provides the FCC with the opportunity to “undo the misguided and harmful TCPA decisions of the past that exposed legitimate companies to massive legal liability without actually protecting consumers.” O’Rielly laid out three principles that he thought would help to frame discussions and guide the development of replacement rules. First, he said that legitimate businesses need to be able to contact consumers to communicate information that they want, need or expect to receive. This includes relief for informational calls, as well as valid telemarketing calls or texts. Second, Commissioner O’Rielly said that FCC should change the definition of an autodialer so that valid callers can operate in an efficient manner. He went on to say that if FCC develops new rules to clarify revocation of consent, it should do so in a clear and convenient way for consumers, but also does not upend standard best practices of legitimate companies. Third, O’Rielly said that the FCC should focus on actual harms and bad actors, not legitimate companies. While Commissioner O’Rielly’ s comments signal his approach to TCPA reform, it is important to note that FCC action on the issue us unlikely to happen overnight. A rule must be considered by the Commission, which will have to allow for public notice and comment. Experian will continue to monitor regulatory and legislative developments on TCPA.

As we enter May, a month dedicated to recognizing our U.S. Armed Forces, it’s only fitting to think about how we are honoring this special group of people. Yes, there will likely be car deals, coupons, and even a few beautiful ceremonies, but as both lawmakers and leaders have recognized, these individuals and their families deserve protections every day. Especially in the financial services universe. There should be no exorbitant fees. No excessively high interest rates. And when they are called to active-duty, they should have avenues to ease their financial commitments and/or exit out of lease agreements. Thankfully, the Servicemembers Civil Relief Act (SCRA) and a strengthened Military Lending Act (MLA) were introduced to help. In fact, we are in year one of the enhanced MLA Final Rule in which compliance was mandated by Oct. 3, 2016. The extended MLA protections include a 36% Military Annual Percentage Rate (MAPR) cap to a wider range of credit products, including payday loans, vehicle title loans, refund application loans, deposit advance loans, installment loans and unsecured open-end lines of credit. The cap additionally applies to fees tacked on for credit-related ancillary products including finance charges and certain application and participation fees. The amended rule covers credit offered or extended to active-duty service members and their dependents, if the credit is subject to a finance charge or is payable by written agreement in more than four installments. And finally, one of the most important additions is that creditors must verify active-duty and dependents at origination. Right now, this can be accomplished by either working with a bureau, like Experian, or by vetting lists directly with the Department of Defense’s (DOD) own database. To continue to help with client need, the bureaus are working with the DOD and financial institutions to ensure alignment in delivery of military member and dependent data for a consistent, immediate and accurate MLA verification process. While much has been introduced over the past year to strengthen protections, there is still more to come. The compliance date for credit cards is Oct. 3, 2017. To date, the MLA status of millions upon millions of consumer credit applications have been verified, ensuring our military members and their dependents receive the financial protections they are entitled to under law. There are roughly 3.4 million military members and dependents in the MLA database, and this is an audience who sacrifices a great deal for our country. Thankfully, protections are finally being enforced to ensure they are taken care of too.

Experian and Creative Strategies share survey results about Apple’s AirPods, Google Home, Amazon Echo and Echo Dot for consumer behavior with voice devices.
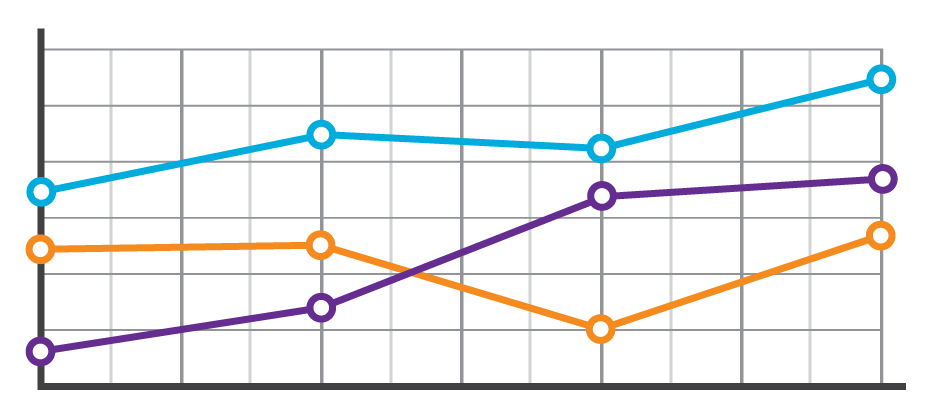
Sometimes life throws you a curve ball. The unexpected medical bill. The catastrophic car repair. The busted home appliance. It happens, and the killer is that consumers don’t always have the savings or resources to cover an additional cost. They must make a choice. Which bills do they pay? Which bills go to the pile? Suddenly, a consumer’s steady payment behavior changes, and in some cases they lose control of their ability to fulfill their obligations altogether. These shifts in payment patterns aren’t always reflected in consumer credit scores. At a single point in time, consumers may look identical. However, when analyzing their past payment behaviors, differences emerge. With these insights, lenders can now determine the appropriate risk or marketing decisions. In the example below, we see that based on the trade-level data, Consumer A and Consumer B have the same credit score and balance. But once we see their payment pattern within their trended data, we can clearly see Consumer A is paying well over the minimum payments due and has a demonstrated ability to pay. A closer look at Consumer B, on the other hand, reveals that the payment amount as compared to the minimum payment amount is decreasing over time. In fact, over the last three months only the minimum payment has been made. So while Consumer B may be well within the portfolio risk tolerance, they are trending down. This could indicate payment stress. With this knowledge, the lender could decide to hold off on offering Consumer B any new products until an improvement is seen in their payment pattern. Alternatively, Consumer A may be ripe for a new product offering. In another example, three consumers may appear identical when looking at their credit score and average monthly balance. But when you look at the trend of their historical bankcard balances as compared to their payments, you start to see very different behaviors. Consumer A is carrying their balances and only making the minimum payments. Consumer B is a hybrid of revolving and transacting, and Consumer C is paying off their balances each month. When we look at the total annual payments and their average percent of balance paid, we can see the biggest differences emerge. Having this deeper level of insight can assist lenders with determining which consumer is the best prospect for particular offerings. Consumer A would likely be most interested in a low- interest rate card, whereas Consumer C may be more interested in a rewards card. The combination of the credit score and trended data provides significant insight into predicting consumer credit behavior, ultimately leading to more profitable lending decisions across the customer lifecycle: Response – match the right offer with the right prospect to maximize response rates and improve campaign performance Risk – understand direction and velocity of payment performance to adequately manage risk exposure Retention – anticipate consumer preferences to build long-term loyalty All financial institutions can benefit from the value of trended data, whether you are a financial institution with significant analytical capabilities looking to develop custom models from the trended data or looking for proven pre-built solutions for immediate implementation.

It should come as no surprise that reaching consumers on past-due accounts by traditional dialing methods is increasingly ineffective. The new alternative, of course, is to leverage digital channels to reach and collect on debts. The Past: Dialing for dollars. Let’s take a walk down memory lane, shall we? The collection approach used for many years was to initially send the consumer a collection letter recapping the obligation and requesting payment, usually when an account was 30 days late. If the consumer failed to respond, a series of dialing attempts were then made, trying to reach the consumer and resolve the debt. Unfortunately, this approach has become less effective through the years due to several reasons: The use of traditional landlines continues to drop as consumers shift to cell and Voice Over Internet Protocol (VOIP) services. The cost of reaching consumers by cell is more costly since predictive dialers can’t be used without prior consent, and the obtaining and maintaining consent presents its own set of tricky challenges. Consumers simply aren’t answering their phones. If they think a bill collector is calling, they don’t pick up. It’s that simple. In fact, here is a breakdown by age group that Gallup published in 2015, highlighting the weakness of traditional phone-dialing. The Present: Hello payment portal. With the ability to get the consumer on the phone to negotiate a payment on the wane, the logical next step is to go digital and use the Internet or text messaging to reach the consumer. With 71 percent of consumers now using smartphones and virtually everyone having an Internet connection, this can be a cost-effective approach. Some companies have already implemented an electronic payment portal whereby a consumer can make a payment using his or her PC or smartphone. Usually this is prompted by a collection letter, or if permitted by consumer consent, a text message to their smartphone. The Future: Virtual negotiation. But what if the consumer wants to negotiate different terms or payment plans? What if they want to try and settle for less than the full amount? In the past – and for most companies operating today – this translates into a series of emails or letters being exchanged, or the consumer must actually speak to a debt collector on the phone. And let’s be honest, the consumer generally does not want to speak to a collector on the phone. Fortunately, there is a new technology involving a virtual negotiator approach coming into the market now. It works like this: The credit grantor or agency contacts the consumer by letter, email, or text reminding them of their debt and offering them a link to visit a website to negotiate their debt without a human being involved. The consumer logs onto the site, negotiates with the site and hopefully comes to terms with what is an acceptable payment plan and amount. In advance, the site would have been fed the terms by which the virtual negotiator would have been allowed to use. Finally, the consumer provides his payment information, receives back a recap of what he has agreed to and the process is complete. This is the future of collections, especially when you consider the younger generations rarely wanting to talk on the phone. They want to handle the majority of their matters digitally, on their own terms and at their own preferred times. The collections process can obviously be uncomfortable, but the thought is the virtual negotiator approach will make it less burdensome and more consumer-friendly. Learn more about virtual negotiation.

Knowing where e-commerce fraud takes place matters We recently hosted a Webinar with Mike Gross, Risk Strategy Director at Experian and Julie Conroy, Research Director at Aite Research Group, looking at the current state of card-not-present fraud, and what to prepare for in the coming year. Our biannual analysis of fraud attacks, served as a backdrop for the trends we’ve been seeing. I wanted to share some observations from the Webinar. Of course, if you prefer to hear it firsthand, you can download the archive recording here. I’ll start with the current landscape of card-not-present fraud. Julie shared 5 key trends her firm has identified regarding e-commerce fraud: Rising account take-over fraud Loyalty points targeted Increasingly global transactions Frustrating false declines Increasingly mobile consumers One particularly interesting note that Julie made was regarding consumer frustration levels towards forgotten passwords. While consumers are more frustrated when they’re locked out of access to their banking accounts (makes sense, it’s their money), forgotten passwords are more detrimental to e-commerce retailers since consumers are likely to go to another site. This equates to a frustrated consumer, and lost revenue for the business. Next, Mike went through the findings from our 2016 e-commerce fraud attack analysis. Fraud attack rates show the attempted fraudulent e-commerce transactions against the population of overall e-commerce orders. Overall, e-commerce attack rates spiked 33% in 2016. The biggest trends we saw included: Increased EMV adoption is driving a shift from counterfeit to card-not-present fraud 2B breached records disclosed in 2016, more than 3x any previous year Consumers reporting credit card fraud jumped from 15% in 2015 to over 32% in 2016 Attackers shifting locations slightly and international orders rely on freight forwarders 10 states saw an increase of over 100% in fraudulent orders Over 70 of the top 100 riskiest postal codes were not in last year’s list So, what will 2017 bring? Be prepared for more attacks, more global rings, more losses for businesses, and the emergence of IoT fraud. Businesses need to anticipate an increase of fraud over time and to be prepared. The value of employing a multi-layered approach to fraud prevention especially when it comes to authenticating consumers to validate transactions cannot be understated. By looking at all the points of the customer journey, businesses can better protect themselves from fraud, while maintaining a good consumer experience. Most importantly, having the right fraud solution in place can help businesses prevent losses both in dollars and reputation.

Investors and financial institutions continue to invest in fintech to help meet the dynamic expectations of consumers who want fast, easy and hassle-free access to new financial products and services. Just last week, in his annual letter to shareholders, JP Morgan Chase CEO Jamie Dimon noted that the bank has invested approximately $600 million “on emerging fintech solutions – which include building and improving digital and mobile services and partnering with fintech companies.” Meanwhile, policymakers in Washington continue to grapple with how to spur responsible innovation and how fintech fits into the existing regulatory paradigm. The Office of the Comptroller of the Currency (OCC) continues to move forward with the development of a special purpose national charter for fintech lenders. On March 15, the OCC issued a draft supplement to its existing Licensing Manual that describes how the agency “will apply the licensing standards and requirements in its existing regulations and policies to fintech companies applying for a special purpose national bank charter.” The draft manual, which is open for a 30-day public comment period ending April 14, 2017, would prohibit fintech lenders from offering products “with predatory features” or entities that inappropriately mingle banking and commerce. The agency also defended its legal authority to make the move without a new law from Congress or any formal rulemaking process, saying it’s doing nothing more than expanding a longstanding practice. At the same time, a group of House Republicans, led by House Financial Services Committee Chairman Jeb Hensarling (R-Tex.), has asked Comptroller of the Currency Thomas Curry to slow down plans to grant special charters to fintech firms. In the letter, the lawmakers state that OCC should provide “full and fair opportunity” for public comment on standards for granting fintech charters and allow President Trump’s pick for the next comptroller to weigh in. The lawmakers go on to say that if OCC “proceeds in haste” to create new limited-purpose charter for fintech, Congress will examine the agency’s actions and “if appropriate, overturn them.” The issue will likely continue to bubble under the surface as Congress and the Trump Administration tackle larger issues such as tax reform, infrastructure spending and possibly wider financial services reform. However, the fintech charter is a legacy item for Comptroller Curry and he is likely to seek to move this to closure given that his term expires at the end of April (although he would remain in place until President Trump nominates and confirms his replacement).

The U.S. Senate declared April to be Financial Literacy Month back in 2004. Fast forward 13 years and one has to question if we’ve moved the needle on educating Americans about personal finance and money management. There is still no national standard or common curriculum to teach our kids the basics in schools, and only five states require high school students to take one semester of personal finance in order to graduate. I read an interesting stat years back that high school seniors spend more time shopping for their prom attire than they do researching financial education options for college. No wonder there is sticker shock post-graduation when those first student loan bills coming. The lack of investment shows. In a 2016 Mintel study, very few consumers gave themselves high grades for their knowledge of personal finance, and the situation was worse among women, with twice as many assigning themselves a “C” as an “A.” Having worked in the financial services industry for more than a decade, I can say with certainty I’m a bit of a personal finance geek. Learning about the latest products and economic shifts has been rolled into my job, and I’ve sadly seen the consequences of what happens to consumers when they make poor financial decisions. Slumping credit scores. Delinquent payments. Repossessed vehicles. Hard times. The good news? There are plenty of resources to help Americans learn. The challenge? Finding the right ways to capture mind share via the right mediums at the right time. There is obviously a benefit to the consumer to be more financially literate, but financial institutions benefit as well when consumers are money smart. Individuals who understand financial products and how they can use them to achieve their goals are more likely to purchase those products throughout their financial lives. So how can financial institutions help close the financial literacy gap? Make online education and resources readily available. Research shows more consumers would like to get information about finance through the use of online resources rather than seminars. This preference is likely due to the fact that online resources can be accessed on one’s own schedule and gives the user more control over the topics s/he wants to explore. Provide parents resources to launch smart money talks with their kids. Study after study reveals parents are one of the most powerful teachers in their kids’ lives – and this includes providing an education and modeling strong money management skills. Consider adding online education for kids – or partnering with a provider who has already built a money app for youngsters. Additionally, educate parents about when it might be time to help a child establish their first savings account. Advise them on ways to finance college. Talk about co-signing on vehicles. Explain the power of saving. Train up your next wave of customers and they will likely remain loyal to you. Offer one-on-one credit education sessions. A high-touch solution is sometimes the perfect opportunity to grow a customer in the right financial direction. Perhaps a low credit score prevents an individual from securing an ideal interest rate for an auto or home loan. Each person’s financial situation is different, and a one-on-one session with a trained agent can help them understand what is specifically contributing to their low score. With a few insights, a customer can determine if they need to pay down some debt, address a few late payments, or reduce their number of credit lines. Knowledge is power, and consumers will appreciate this service and personable touch. --- Lenders have a vested interest to close the financial literacy gap, and while they can’t solve for everything, they can certainly make a difference with some basic steps and investments. If nothing else, April seems like a perfect time to evaluate what you’re doing and what resolutions you can make for the year ahead. Just as every saved penny counts, so does every effort to educate Americans on manning their money more effectively.

Turns out, Americans still don’t know much about CyberSecurity. That’s according to new research from the Pew Data Center, which conducted a cybersecurity knowledge quiz. The 13 question quiz was designed to test American’s knowledge on a number of cybersecurity issues and terms. A majority of online adults can identify a strong password and recognize the dangers of using public Wi-Fi. However, many struggle with more technical cybersecurity concepts, such as how to identify true two-factor authentication or determine if a webpage they are using is encrypted. As we in the industry know, cybersecurity is a complicated and diverse subject, but given the pervasiveness of news around cybersecurity, I was still a little surprised by the lack of knowledge. The typical (median) respondent answered only five of the 13 questions correctly (with a mean of 5.5 correct answers). 20% answered more than eight questions accurately, and just 1% received a “perfect score” by correctly answering all 13 questions. The study showed that public knowledge of cybersecurity is low on some relatively technical issues, like identifying the correct example of multi-factor authentication, understanding how VPNs minimize risk and knowing what a botnet is. On the flip side, the two questions that the majority of respondents answered correctly included identifying the strongest password from a list of four options and understanding that public Wi-Fi networks have risk even when they are password protected. Given the median scores, I was proud of missing only one question – guess I have more reading to do on Botnets. As an industry, it is our duty to not only create systems and securities to improve the tactical effectiveness of fraud prevention, but to educate consumers on many of these topics as well. They often are the first line of defense in stopping fraud and reducing the threat of breaches.

Pay your bills on time, have cash set aside for emergencies, and invest your money for the future. These are the rules financial pros say people should follow if they want to build wealth. Straightforward advice, but for many people these milestones can seem out of reach. A recent financial literacy study by Mintel shows that many Americans are struggling with money management and lack confidence in their financial knowledge, with just 19 percent of respondents giving themselves an “A” grade on financial knowledge. The survey and other reports released recently shed light on how well Americans are handling their money. Here are some of the prevailing trends: Young people are struggling. The Mintel study revealed less than 30 percent of Americans have an emergency savings account that equals 3-6 months of household income. Of that total number, 19 percent of iGeneration has saved for a rainy day, followed by Millennials (20 percent), Gen Xers (28 percent), Baby Boomers (37 percent) and World War II/Swing Generation (40 percent). Not surprisingly, people who make more money save a bigger percentage of their pay. People in the bottom 90 percent of the income scale save close to none of their pay each year, while those in the top 10 percent save close to 15 percent. Most are not planning for the future. The majority of people are not doing everything they can to prepare for retirement, including meeting with a financial adviser to devise a plan, researching Social Security or even talking to friends or family about planning. Even more, 21 percent of Americans are “not at all confident” they will be able to reach their financial goals. Parents plan more than non-parents. People with children have many demands on their money, and as a result think ahead and follow budgets, contribute to retirement accounts and hire a financial adviser to help them create plans and budgets. Consumers who don’t have children don’t have as many competing demands, but aren’t as sensible about following a financial plan. In Mintel’s study, just 10 percent of non-parents have a written financial plan and 26 percent contribute regularly to a retirement account. Most people have a budget. Nearly one in three Americans prepare a detailed written or computerized household budget each month that tracks their income and expenses, but a large majority do not. Those with at least some college education, conservatives, Republicans, independents, and those making $75,000 a year or more are slightly more likely to prepare a detailed household budget than are their counterparts, according to Gallup. The good news is, the majority of Americans are open to more financial education. April—which is Financial Literacy Month—is a great time to look at education efforts for your customers. Financial literacy won’t change overnight, nor in a year. Yet initiatives taken in schools, workplaces, and in communities add up. What are you doing for your customers to build financial literacy?

Experian recently acquired a minority stake in Finicity, a leading financial data aggregator enabling innovation in the FinTech industry through its modern RESTful API and Finicity Aggregation Platform. Steve Smith—chairman, CEO and co-founder of Finicity—has a passion and experience in developing innovative and disruptive technology, products and services that leads to efficiency for markets and, ultimately, improvements for consumers. Here he shares his thoughts about disruptive technology in the lending space and its benefits to lenders and consumers. Q: Finicity has said its objective is to take a loan application approval from weeks to minutes using its technology. That sounds pretty great, but how is that possible? How does this play out behind the scenes? A: Well, we’re living in a world where we, as consumers, expect very user-friendly experiences and we expect things to happen at digital speeds. The loan process is no exception. To deliver the experience consumers are expecting requires us to leverage the technology trends of digitization, mobility and big data. Finicity plays a foundational role by leveraging thousands of digital connections across financial institutions to aggregate consumer-permissioned account data. Once we have this data, we’re able to deliver real-time insights into an individual's financial health. This financial health assessment includes income and assets, two critical components to the loan approval process. All that’s required is the borrower to permission use of the data. Once that’s done, we’re able to gather all appropriate data across multiple accounts, rapidly analyze it and send a verification report to the lender. No papers. No multiple requests. No questions on the validity of the data. All done in minutes, not weeks. Q: This is very disruptive technology. What are the benefits for lenders? Consumers? A: Well, as we discussed, one of the major benefits is the speed to a loan. Furthermore, this reduces cost for the lender by maximizing loan officer’s time, while also freeing up loan capital as they can move through loans more quickly with a higher quality assessment. Another benefit for lenders is reduced fraud. Our information on income and assets is coming from real-time bank validated information. This eliminates the possibility of altered data. For consumers, it’s a dramatically simplified process. No need to chase down multiple documents. There are virtually no second requests for information, which we often see in the process. And they’re always in control of their information. All in all, it’s a dramatically better experience for both the lender and the borrower. Q: What sets this solution apart from others in the market? A: A few things set Finicity apart in delivering the quality of insights required. First, we are an industry leader in the number of financial institutions we connect with, ensuring broader access for more customers. Second, 95 percent of our integrations provide access to formatted data, something that’s critical to credit decisioning solutions. In these cases, we’re not screen scraping. This enhances our ability to collect bank validated transactions; we provide the financial institution transaction ID. This provides assurance of data quality. Finally, is our ability to categorize and analyze the transactions. This allows us to identify income streams and assets. Through this process, we’re also able to flag unusual transactions, like large deposits, that may skew actual assets. Q: The future of financial technology is still evolving. What lies ahead? A: We’re very excited about the future of financial technology and the impact that aggregation will have. Whether it’s financial management, digital payments or credit decisioning, real-time data will improve the experiences and the outcomes. As we’re talking about lending, this is one of the spaces that could see significant disruption. Our ability to generate a richer view of an individual’s or organization’s financial health will more accurately determine their ability to repay a loan. This will be a great benefit for those that have thin file or no credit history. We see a world where suitability for a loan will be driven by their actual financial life independent of their use of credit. One of the largest markets in the US is millennials. However, for consumers under 30, two-thirds have subprime or non-prime credit scores and one-third of millennials don't have any credit history. This is just one group underserved because legacy models don’t leverage the full extent of data available. Q: Is there anything else you can tell us about Finicity and its role changing customer experiences across financial service? A: For us, it all comes down to one thing: enabling individuals and organizations to have the information and insights they need to make smarter financial decisions. The data is there. We’re helping to unlock the potential of that data by working with innovative partners like Experian. To learn more about Experian and Finicity's account aggregation solutions, visit www.experian.com/finicity

Knowing a consumer’s credit information at a single point in time only tells part of the story. I often hear one of our Experian leaders share the example of two horses, running neck-in-neck, at the races. Who will win? Well, if you had multiple insights into those two horses – and could see the race in segments – you might notice one horse losing steam, and the other making great strides. In the world of credit consumers, the same metaphor can ring true. You might have two consumers with identical credit scores, but Consumer A has been making minimum payments for months and showing some payment stress, while Consumer B has been aggressively making larger pay-offs. Trended data adds that color to the story, and suddenly there is more intel on who to market to for future offers. To understand the whole story, lenders need the ability to assess a consumer’s credit behavior over time. Understanding how a consumer uses credit or pays back debt over time can help lenders: Offer the right products & terms to increase response rates Determine up sell and cross sell opportunities Prevent attrition Identify profitable customers Avoid consumers with payment stress Limit loss exposure The challenge with trended data, however, is finding a way to sort through the payment patterns in the midst of huge datasets. At the singular level, one consumer might have 10 trades. Trended data in turn reveals five historical payment fields and then you multiple all of this by 24 months and you suddenly have 1,200 data points. But let’s be real … a lender is not going to look at just one consumer as they consider their marketing or retention campaigns. They may look at 100,000 consumers. And on that scale you are now looking at sorting through 120M data points. So while a lender may think they need trended data – and there is definitely value in accessing it – they likely also need a solution to help them wade through it all, assessing and decisioning on those 120M data points. Tapping into something like Credit3D, which bundles in propensity scores, profitability models and trended attributes, is the solution that truly unveils the value of trended data insights. By layering in these solutions, lenders can clearly answer questions like: Who is likely to respond to an offer? How does a consumer use credit? How can I identify revolvers, transactors and consolidators? Is there a better way to understand risk or to conduct swap set analysis? How can I acquire profitable consumers? How do I increase wallet share and usage? Trended data sounds like a “no-brainer” and it definitely has the ability to shed light on that consumer credit horse race. Lenders, however, also need to have the appropriate analytics and systems to assess on the huge volume of data points. Need more information on Trended Data and Credit 3D? Contact Us

Direct mail is not dead, but it's 2017. Financial services companies need to acknowledge there might be other ways to deliver credit offers and capture consumer eyeballs. There are multiple screens competing for our attention, including one of the originals - TV. Advertising and TV have been married forever, but addressable TV allows marketers to target on a much more sophisticated level. Welcome to credit marketing in the digital age. To help financial services companies understand the addressable TV channel, Experian marketing expert Brienna Pinnow answered the following questions in a short interview. What is addressable TV? Addressable TV is an amazing 1-to-1 direct marketing capability. To put it simply, addressable TV is the ability for an advertiser to deliver a TV ad to a specific household. From a consumer perspective, that means even if you and your next door neighbor are watching the latest episode of The Voice, you may see an ad for a mini-van while your neighbor sees an ad for upcoming one-day sale from their favorite retailer. With addressable TV, brands can define their target audience based on 1st, 2nd or 3rd party data (like Experian’s). With the help of satellite and cable companies, they can deliver a personalized, measurable experience. This is an exciting departure from the way that TV advertising has been planned and targeted for nearly 70 years. Instead of focusing on the program, marketers can now focus on the person. Addressable TV makes reaching a precise audience – the same way you would with a direct mail piece or an email – a marketing reality. How long have marketers been leveraging addressable TV? Experian has been an pivotal player in the development of the addressable TV space. Since the first addressable TV trials back in 2004, nearly 13 years ago, Experian has provided the audience targeting data and privacy-compliant matching capabilities that make addressable TV possible. The past 3 years, however, have demonstrated unprecedented, hockey-stick growth in addressable TV. In 2016 alone, the volume of addressable campaigns doubled from the previous year accounting for nearly $300 million spend. That trajectory remains the same in 2017 and beyond. So why are we seeing this growth now? Here are a few reasons addressable TV is continuing to grow… Scale: Millions of households can now be targeted using addressable technology, and the footprint continues to grow with smart TVs and additional cable operators. Data: As organizations put data at the heart of their business, addressable TV enables them to infuse their most important customer information into the targeting. Education: Agencies, data providers, and TV providers have invested time educating brands on the process and power of addressable TV. And now, advertisers are becoming more experienced at making this a consistent part of their marketing plan. Accountability: You’ll be hard pressed to find a marketer that doesn’t have to demonstrate ROI on their marketing campaigns. The measurement capabilities that addressable TV provides adds a layer of accountability and insight that was not previously possible. Technology: Experian has developed an audience management platform, the Audience Engine, which makes addressable TV possible in a matter of clicks. In the past year alone, our platform has distributed over 1,800 audiences for addressable advertising campaigns. What types of companies have been utilizing addressable TV? Have you seen many financial services companies test this channel? The early adopters of addressable TV were primarily automotive advertisers. Compared to other verticals, auto advertisers still spend the largest proportion of their budgets across TV. For that reason, they know it’s a necessity to see if their dollars are actually driving sales for their big-ticket items. Addressable TV solves that problem for auto advertisers. In a DIRECTV campaign leveraging Experian’s automotive data for audience targeting and post-campaign sales reporting, one major auto OEM saw a 26.2% lift in sales for the advertised model compared to the control group. In the past few years, Experian has worked closely with advertisers across verticals – from retail to travel to finance – to launch addressable campaigns. Financial services clients particularly find Experian’s financial related segments, such as income or net worth, to be accurate and powerful in creating qualified target audiences that improve campaign performance. I’ve read that millennials are abandoning cable and TV providers in favor of services like Hulu and Netflix. Does this mean the market for addressable TV will shrink in the coming years? There is a segment of consumers who are abandoning traditional cable services. However, this doesn’t mean they are abandoning content. In fact, content consumption is at an all-time high with offerings from Roku, Hulu, Netflix, Sling TV, CBS, and beyond. All this shift in behavior means is that the definition of TV is becoming more fluid. “TV” doesn’t have to be a big screen sitting in your living room; it can be a laptop on a red-eye flight. And from a marketing perspective, the concept of addressable, 1-to-1 targeting is already moving into some of these products and services. The footprint of addressable TV will only continue to rise as consumers stay connected to the content they love. How can companies measure the success of utilizing addressable TV as a channel? Not only does addressable TV provide laser-targeted ad delivery, but it also opens up measurement capabilities that were never possible for TV advertisers in the past. Traditionally, TV audience measurement has focused simply on eyeballs and not revenue impact, with little insight into how TV advertising converts into sales. The primary source for audience measurement in the TV world has been program ratings and expensive brand studies. With addressable TV, that story is changing. With companies that collect second-by-second viewership data linked to households, marketers now have the ability to tie this data back to their online and offline sales. Experian is pivotal in making closed-loop TV reporting possible. As a data and matching safe-haven, we link together the viewing information from the target audience with the sales data provided by the advertiser. The end result is a privacy compliant report that clearly demonstrates the impact of the campaign on the target audience. Did the targeted audience visit a bank location? Email customer service? Sign up for a new account? Spend a certain amount? These are all questions our TV attribution reporting answers for clients. If a company wants to begin marketing in addressable TV, what is required in terms of set-up? Addressable TV may sound new, exciting or even complex. But it doesn’t have to be. Getting started is as simple as defining the target audience. Decide whether you would like to leverage your own CRM data, a custom model, third-party data or a combination of these data sources. If you’re still not sure where to start, ask yourself a very simple question, “Who am I sending a direct mail piece or email to in the next month?” There’s your audience. Better yet, you will be amplifying your message, reaching the customer with a consistent message and meeting them wherever they are. After you’ve determined who you want to target, a matching partner like Experian can work with you to show you the reach of your audience across TV providers. You’ll finalize your budget, creative and media plan while Experian distributes your audience to the selected media destinations. Before you know it, your campaign will be live, and reaching your target audience whether they’re watching Shark Tank or Sharknado. When the campaign wraps, you’ll be on your way to measuring results like never before. Are there any additional trends you see emerging in the addressable TV space? The future of addressable TV is related to both the targeting and measurement capabilities. More advertisers are working with Experian, for example, to launch coordinated campaigns. That doesn’t just mean launching a digital campaign and TV campaign at the same time. It really means targeting the same exact people for the digital and TV campaign. We like to consider this a "surround sound" approach where the customer or prospect experiences a consistent message across channels. As for measurement, Experian is working closely with advertisers to explore the power of mobile data. Recently, Experian partnered with Ninth Decimal and DIRECTV to incorporate mobile location data into the post-campaign measurement process for Toyota. The results proved a 19% lift in dealership visits for those exposed to the campaign. This is an exciting development because this approach can translate well for any other advertiser who wants to measure metrics like location visitation. If you’d like to learn more, check out our Addressable TV whitepaper.