Debt & Collections

Article written by Melanie Smith, Senior Copywriter, Experian Clarity Services, Inc. It’s been almost a decade since the Great Recession in the United States ended, but consumers continue to feel its effects. During the recession, millions of Americans lost their jobs, retirement savings decreased, real estate reduced in value and credit scores plummeted. Consumers that found themselves impacted by the financial crisis often turned to alternative financial services (AFS). Since the end of the recession, customer loyalty and retention has been a focus for lenders, given that there are more options than ever before for AFS borrowers. To determine what this looks like in the current climate, we examined today’s non-prime consumers, what their traditional scores look like and if they are migrating to traditional lending. What are alternative financial services (AFS)? Alternative financial services (AFS) is a term often used to describe the array of financial services offered by providers that operate outside of traditional financial institutions. In contrast to traditional banks and credit unions, alternative service providers often make it easier for consumers to apply and qualify for lines of credit but may charge higher interest rates and fees. More than 50% of new online AFS borrowers were first seen in 2018 To determine customer loyalty and fluidity, we looked extensively at the borrowing behavior of AFS consumers in the online marketplace. We found half of all online borrowers were new to the space as of 2018, which could be happening for a few different reasons. Over the last five years, there has been a growing preference to the online space over storefront. For example, in our trends report from 2018, we found that 17% of new online customers migrated from the storefront single pay channel in 2017, with more than one-third of these borrowers from 2013 and 2014 moving to online overall. There was also an increase in AFS utilization by all generations in 2018. Additionally, customers who used AFS in previous years are now moving towards traditional credit sources. 2017 AFS borrowers are migrating to traditional credit As we examined the borrowing behavior of AFS consumers in relation to customer loyalty, we found less than half of consumers who used AFS in 2017 borrowed from an AFS lender again in 2018. Looking into this further, about 35% applied for a loan but did not move forward with securing the loan and nearly 24% had no AFS activity in 2018. We furthered our research to determine why these consumers dropped off. After analyzing the national credit database to see if any of these consumers were borrowing in the traditional credit space, we found that 34% of 2017 borrowers who had no AFS activity in 2018 used traditional credit services, meaning 7% of 2017 borrowers migrated to traditional lending in 2018. Traditional credit scores of non-prime borrowers are growing After discovering that 7% of 2017 online borrowers used traditional credit services in 2018 instead of AFS, we wanted to find out if there had also been an improvement in their credit scores. Historically, if someone is considered non-prime, they don’t have the same access to traditional credit services as their prime counterparts. A traditional credit score for non-prime consumers is less than 600. Using the VantageScore® credit score, we examined the credit scores of consumers who used and did not use AFS in 2018. We found about 23% of consumers who switched to traditional lending had a near-prime credit score, while only 8% of those who continued in the AFS space were classified as near-prime. Close to 10% of consumers who switched to traditional lending in 2018 were classified in the prime category. Considering it takes much longer to improve a traditional credit rating, it’s likely that some of these borrowers may have been directly impacted by the recession and improved their scores enough to utilize traditional credit sources again. Key takeaways AFS remains a viable option for consumers who do not use traditional credit or have a credit score that doesn’t allow them to utilize traditional credit services. New AFS borrowers continue to appear even though some borrowers from previous years have improved their credit scores enough to migrate to traditional credit services. Customers who are considered non-prime still use AFS, as well as some near-prime and prime customers, which indicates customer loyalty and retention in this space. For more information about customer loyalty and other recently identified trends, download our recent reports. State of Alternative Data 2019 Lending Report

Retailers are already starting to display their Christmas decorations in stores and it’s only early November. Some might think they are putting the cart ahead of the horse, but as I see this happening, I’m reminded of the quote by the New York Yankee’s Yogi Berra who famously said, “It gets late early out there.” It may never be too early to get ready for the next big thing, especially when what’s coming might set the course for years to come. As 2019 comes to an end and we prepare for the excitement and challenges of a new decade, the same can be true for all of us working in the lending and credit space, especially when it comes to how we will approach the use of alternative data in the next decade. Over the last year, alternative data has been a hot topic of discussion. If you typed “alternative data and credit” into a Google search today, you would get more than 200 million results. That’s a lot of conversations, but while nearly everyone seems to be talking about alternative data, we may not have a clear view of how alternative data will be used in the credit economy. How we approach the use of alternative data in the coming decade is going to be one of the most important decisions the lending industry makes. Inaction is not an option, and the time for testing new approaches is starting to run out – as Yogi said, it’s getting late early. And here’s why: millennials. We already know that millennials tend to make up a significant percentage of consumers with so-called “thin-file” credit reports. They “grew up” during the Great Recession and that has had a profound impact on their financial behavior. Unlike their parents, they tend to have only one or two credit cards, they keep a majority of their savings in cash and, in general, they distrust financial institutions. However, they currently account for more than 21 percent of discretionary spend in the U.S. economy, and that percentage is going to expand exponentially in the coming decade. The recession fundamentally changed how lending happens, resulting in more regulation and a snowball effect of other economic challenges. As a result, millennials must work harder to catch up financially and are putting off major life milestones that past generations have historically done earlier in life, such as homeownership. They more often choose to rent and, while they pay their bills, rent and other factors such as utility and phone bill payments are traditionally not calculated in credit scores, ultimately leaving this generation thin-filed or worse, credit invisible. This is not a sustainable scenario as we enter the next decade. One of the biggest market dynamics we can expect to see over the next decade is consumer control. Consumers, especially millennials, want to be in the driver’s seat of their “credit journey” and play an active role in improving their financial situations. We are seeing a greater openness to providing data, which in turn enables lenders to make more informed decisions. This change is disrupting the status quo and bringing new, innovative solutions to the table. At Experian, we have been testing how advanced analytics and machine learning can help accelerate the use of alternative data in credit and lending decisions. And we continue to work to make the process of analyzing this data as simple as possible, making it available to all lenders in all verticals. To help credit invisible and thin-file consumers gain access to fair and affordable credit, we’ve recently announced Experian Lift, a new suite of credit score products that combines exclusive traditional credit, alternative credit and trended data assets to create a more holistic picture of consumer creditworthiness that will be available to lenders in early 2020. This new Experian credit score may improve access to credit for more than 40 million credit invisibles. There are more than 100 million consumers who are restricted by the traditional scoring methods used today. Experian Lift is another step in our commitment to helping improve financial health of consumers everywhere and empowers lenders to identify consumers who may otherwise be excluded from the traditional credit ecosystem. This isn’t just a trend in the United States. Brazil is using positive data to help drive financial inclusion, as are others around the world. As I said, it’s getting late early. Things are moving fast. Already we are seeing technology companies playing a bigger role in the push for alternative data – often powered by fintech startups. At the same time, there also has been a strong uptick in tech companies entering the banking space. Have you signed up for your Apple credit card yet? It will take all of 15 seconds to apply, and that’s expected to continue over the next decade. All of this is changing how the lending and credit industry must approach decision making, while also creating real-time frictionless experiences that empower the consumer. We saw this with the launch of Experian Boost earlier this year. The results speak for themselves: hundreds of thousands of previously thin-file consumers have seen their credit scores instantly increase. We have also empowered millions of consumers to get more control of their credit by using Experian Boost to contribute new, positive phone, cable and utility payment histories. Through Experian Boost, we’re empowering consumers to play an active role in building their credit histories. And, with Experian Lift, we’re empowering lenders to identify consumers who may otherwise be excluded from the traditional credit ecosystem. That’s game-changing. Disruptions like Experian Boost and newly announced Experian Lift are going to define the coming decade in credit and lending. Our industry needs to be ready because while it may seem early, it’s getting late.

To provide consumers with clear-cut protections against disturbance by debt collectors, the Consumer Financial Protection Bureau (CFPB) issued a Notice of Proposed Rulemaking (NPRM) to implement the Fair Debt Collection Practices Act (FDCPA) earlier this year. Among many other things, the proposal would set strict limits on the number of calls debt collectors may place to reach consumers weekly and clarify requirements for consumer-facing debt collection disclosures. A bigger discussion Deliberation of the debt collection proposal was originally scheduled to begin on August 18, 2019. However, to allow commenters to further consider the issues raised in the NPRM and gather data, the comment period was extended by 20 days to September 18, 2019. It is currently still being debated, as many argue that the proposed rule does not account for modern consumer preferences and hinders the free flow of information used to help consumers access credit and services. The Association of Credit and Collection Professionals (ACA International) and US House lawmakers continue to challenge the proposal, stating that it doesn’t ensure that debt collectors’ calls to consumers are warranted, nor does it do enough to protect consumers’ privacy. Many consumer advocates have expressed doubts about how effective the proposed measures will be in protecting debtors from debt collector harassment and see the seven-calls-a-week limit on phone contact as being too high. In fact, it’s difficult to find a group of people in full support of the proposal, despite the CFPB stating that it will help clarify the FDCPA, protect lenders from litigation and bring consumer protection regulation into the 21st century. What does this mean? Although we don’t know when, or if, the proposed rule will go into effect, it’s important to prepare. According to the Federal Register, there are key ways that the new regulation would affect debt collection through the use of newer technologies, required disclosures and limited consumer contact. Not only will the proposed rules apply to debt collectors, but its provisions will also impact creditors and servicers, making it imperative for everyone in the financial services space to keep watch on the regulation’s status and carefully analyze its proposed rules. At Experian, our debt collection solutions automate and moderate dialogues and negotiations between consumers and collectors, making it easier for collection agencies to connect with consumers while staying compliant. Our best-in-class data and analytics will play a key role in helping you reach the right consumer, in the right place, at the right time. Learn more

Earlier this year, the Consumer Financial Protection Bureau (CFPB) issued a Notice of Proposed Rulemaking (NPRM) to implement the Fair Debt Collection Practices Act (FDCPA). The proposal, which will go into deliberation in September and won't be finalized until after that date at the earliest, would provide consumers with clear-cut protections against disturbance by debt collectors and straightforward options to address or dispute debts. Additionally, the NPRM would set strict limits on the number of calls debt collectors may place to reach consumers weekly, as well as clarify how collectors may communicate lawfully using technologies developed after the FDCPA’s passage in 1977. So, what does this mean for collectors? The compliance conundrum is ever present, especially in the debt collection industry. Debt collectors are expected to continuously adapt to changing regulations, forcing them to spend time, energy and resources on maintaining compliance. As the most recent onslaught of developments and proposed new rules have been pushed out to the financial community, compliance professionals are once again working to implement changes. According to the Federal Register, here are some key ways the new regulation would affect debt collection: Limited to seven calls: Debt collectors would be limited to attempting to reach out to consumers by phone about a specific debt no more than seven times per week. Ability to unsubscribe: Consumers who do not wish to be contacted via newer technologies, including voicemails, emails and text messages must be given the option to opt-out of future communications. Use of newer technologies: Newer communication technologies, such as emails and text messages, may be used in debt collection, with certain limitations to protect consumer privacy. Required disclosures: Debt collectors will be obligated to send consumers a disclosure with certain information about the debt and related consumer protections. Limited contact: Consumers will be able to limit ways debt collectors contact them, for example at a specific telephone number, while they are at work or during certain hours. Now that you know the details, how can you prepare? At Experian, we understand the importance of an effective collections strategy. Our debt collection solutions automate and moderate dialogues and negotiations between consumers and collectors, making it easier for collection agencies to reach consumers while staying compliant. Powerful locating solution: Locate past-due consumers more accurately, efficiently and effectively. TrueTraceSM adds value to each contact by increasing your right-party contact rate. Exclusive contact information: Mitigate your compliance risk with a seamless and unparalleled solution. With Phone Number IDTM, you can identify who a phone is registered to, the phone type, carrier and the activation date. If you aren’t ready for the new CFPB regulation, what are you waiting for? Learn more Note: Click here for an update on the CFPB's proposal.

The fact that the last recession started right as smartphones were introduced to the world gives some perspective into how technology has changed over the past decade. Organizations need to leverage the same technological advancements, such as artificial intelligence and machine learning, to improve their collections strategies. These advanced analytics platforms and technologies can be used to gauge customer preferences, as well as automate the collections process. When faced with higher volumes of delinquent loans, some organizations rapidly hire inexperienced staff. With new analytical advancements, organizations can reduce overhead and maintain compliance through the collections process. Additionally, advanced analytics and technology can help manage customers throughout the customer life cycle. Let’s explore further: Why use advanced analytics in collections? Collections strategies demand diverse approaches, which is where analytics-based strategies and collections models come into play. As each customer and situation differs, machine learning techniques and constraint-based optimization can open doors for your organization. By rethinking collections outreach beyond static classifications (such as the stage of account delinquency) and instead prioritizing accounts most likely to respond to each collections treatment, you can create an improved collections experience. How does collections analytics empower your customers? Customer engagement, carefully considered, perhaps comprises the most critical aspect of a collections program—especially given historical perceptions of the collections process. Experian recently analyzed the impact of traditional collections methods and found that three percent of card portfolios closed their accounts after paying their balances in full. And 75 percent of those closures occurred shortly after the account became current. Under traditional methods, a bank may collect outstanding debt but will probably miss out on long-term customer loyalty and future revenue opportunities. Only effective technology, modeling and analytics can move us from a linear collections approach towards a more customer-focused treatment while controlling costs and meeting other business objectives. Advanced analytics and machine learning represent the most important advances in collections. Furthermore, powerful digital innovations such as better criteria for customer segmentation and more effective contact strategies can transform collections operations, while improving performance and raising customer service standards at a lower cost. Empowering consumers in a digital, safe and consumer-centric environment affects the complete collections agenda—beginning with prevention and management of bad debt and extending through internal and external account resolution. When should I get started? It’s never too early to assess and modernize technology within collections—as well as customer engagement strategies—to produce an efficient, innovative game plan. Smarter decisions lead to higher recovery rates, automation and self-service tools reduce costs and a more comprehensive customer view enhances relationships. An investment today can minimize the negative impacts of the delinquency challenges posed by a potential recession. Collections transformation has already begun, with organizations assembling data and developing algorithms to improve their existing collections processes. In advance of the next recession, two options present themselves: to scramble in a reactive manner or approach collections proactively. Which do you choose? Get started

Have you seen the latest Telephone Consumer Protection Act (TCPA) class action lawsuit? TCPA litigations in the communications, energy and media industries are dominating the headlines, with companies paying up to millions of dollars in damages. Consumer disputes have increased more than 500 percent in the past five years, and regulations continue to tighten. Now more than ever, it’s crucial to build effective and cost-efficient contact strategies. But how? First, know your facts. Second, let us help. What is the TCPA? As you’re aware, TCPA aims to safeguard consumer privacy by regulating telephone solicitations and the use of prerecorded messages, auto-dialed calls, text messages and unsolicited faxes. The rule has been amended and more tightly defined over time. Why is TCPA compliance important? Businesses found guilty of violating TCPA regulations face steep penalties – fines range from $500 to $1500 per individual infraction! Companies have been delivered hefty penalties upwards of hundreds of thousands, and in some cases, millions of dollars. Many have questions and are seeking to understand how they might adjust their policies and call practices. How can you protect yourself? To help avoid risk for compliance violations, it’s integral to assess call strategies and put best practices in place to increase right-party contact rates. Strategies to gain compliance and mitigate risk include: Focus on right and wrong-party contact to improve customer service: Monitoring and verifying consumer contact information can seem like a tedious task, but with the right combination of data, including skip tracing data from consumer credit data, alternative and other exclusive data sources, past-due consumers can be located faster. Scrub often for updated or verified information: Phone numbers can continuously change, and they’re only one piece of a consumer’s contact information. Verifying contact information for TCPA compliance with a partner you can trust can help make data quality routine. Determine when and how often you dial cell phones: Or, given new considerations proposed by the CFPB, consider looking at collections via your consumers’ preferred communication channel – online vs. over the phone. Provide consumers user-friendly mechanisms to opt-out of receiving communications At Experian, our TCPA solutions can help you monitor and verify consumer contact information, locate past-due consumers, improve your right-party contact rates and automate your collections process. Get started

Friend or foe? Sophisticated criminals put a great deal of effort into creating convincing, verifiable personas (AKA synthetic identities). Once the fictional customer has embedded itself in your business, everything from the acquisition of financial instruments to healthcare benefits, utility services, and tax filings and refunds become vulnerable to synthetic identity fraud. Information attached to synthetic IDs can run several levels deep and be so complete that it includes public record data, credit information, documentary evidence and social media profiles that may even contain photo sets and historical details intended to deceive—all complicating your efforts to identify these fake customers before you do business with them. See real-world examples of how synthetic identity fraud is souring various markets – from auto and healthcare to financial services and public sector – in our tip sheet, Four common synthetic scenarios. Stopping synthetic ID fraud — at the door and thereafter. There are efforts underway in the market to collectively improve your ability to identify, shut down and prevent synthetic identities from entering your portfolio. This overall trend is great news for the future, but there are also near-term solutions you can apply to protect your business starting now. While it’s important to identify synthetic identities when they knock on your door, it’s just as important to conduct regular portfolio checkups to prevent negative impacts to your collections efforts. Every circumstance has its own unique parameters, but the overarching steps necessary to mitigate fraud from synthetic IDs remain the same: Identify current and near-term exposure using targeted segmentation analysis. Apply technology that alerts you when identity data doesn’t add up. Differentiate fraudulent identities from those simply based on bad data. Review front- and back-end screening procedures until they satisfy best practices. Achieve a “single view of the customer” for all account holders across access channels—online, mobile, call center and face-to-face. The right tools for the job. In addition to the steps mentioned above, stopping these fake customers from entering and then stealing from your organization isn’t easy—but with the right tools and strategies, it is possible. Here are a few of our top recommendations: Forensics Isolate and segment identities based on signals received during early account pathing, from both individuals and their device. For example, even sophisticated fraud networks can’t mimic natural per-device user interaction because these organizations work with hundreds or thousands of synthetic identities using just a few devices. It’s highly unlikely that multiple geographically separate account holders would share the same physical device. High-risk fraud scores Not all synthetic identity fraud manifests the same way. Using sophisticated logic and unique combinations of data, a high-risk fraud score looks at a consumer’s credit behavior and credit relationships over time to uncover previously undetectable risk. These scores are especially successful in detecting identities that are products of synthetic identity farms. And by targeting a specific data set and relationships, you can maintain a frictionless customer experience and reduce false positives. Analytics Use a solution that develops models of bad applicant behavior, then compares and scores your portfolio against these models. There isn’t a single rule for detecting fraudulent identities, but you can develop an informed set of rules and targeted models with the right service partner. Cross-referencing models designed to isolate high-risk identity theft cases, first-party or true-name fraud schemes, and synthetic identities can be accomplished in a decisioning strategy or via a custom model that incorporates the aggregate scores and attributes holistically. Synthetic identity detection rules These specialized rules consist of numerous conditions that evaluate a broad selection of consumer behaviors. When they occur in specific combinations, these behaviors indicate synthetic identity fraud. This broad-based approach provides a comprehensive evaluation of an identity to more effectively determine if it’s fabricated. It also helps reduce the incidence of inaccurately associating a real identity with a fictitious one, providing a better customer experience. Work streams Address synthetic identities confidently by applying analytics to work streams throughout the customer life cycle: Credit risk assessment Know Your Customer/Customer Identification Program checks Risk-based identity proofing and authentication Existing account management Manual reviews, investigations and charge-offs/collections activities Learn more about these tools and others that can help you mitigate synthetic identities in our white paper, Synthetic identities: getting real with customers. If your organization is like most, detecting SIDs hasn't been your top priority. So, there's no time to waste in preventing them from entering your portfolio. Criminals are highly motivated to innovate their approaches as rapidly as possible, and it’s important to implement a solution that addresses the continued rise of synthetic IDs from multiple engagement points. With the right set of analytics and decisioning tools, you can reduce exposure to fraud and losses stemming from synthetic identity attacks from the beginning and across the customer life cycle. We can help you detect and mitigate these fake customers before they become delinquent. Learn more

Debt management is becoming increasingly complex. People don’t answer their phones anymore. There are many, many communication channels available (email, text, website, etc.) and just as many preferences from consumers regarding how they communicate. Prioritizing how much time and effort to spend on a debtor often requires help from advanced analytics and machine learning to optimize those strategies. Whether you are manually managing your collections strategies or are using advanced optimization to increase recovery rates, we’ve got keys to help you improve your recover rates. Watch our webinar, Keys to unlocking debt management success, to learn about: Minimizing the flow of accounts into collections and ensuring necessary information (e.g. risk, contact data) is used to determine the best course of action for accounts entering collections Recession readiness – prepare for the next recession to minimize impact Reducing costs and optimizing collections treatment strategies based on individual consumer circumstances and preferences Increasing recovery rates and improving customer experience by enabling consumers to interact with your organization in the most effective, efficient and non-threatening way possible Watch on-demand now>

Financial institutions preparing for the launch of the Financial Accounting Standard Board’s (FASB) new current expected credit loss model, or CECL, may have concerns when it comes to preparedness, implications and overall impact. Gavin Harding, Experian’s Senior Business Consultant and Jose Tagunicar, Director of Product Management, tackled some of the tough questions posed by the new accounting standard. Check out what they had to say: Q: How can financial institutions begin the CECL transition process? JT: To prepare for the CECL transition process, companies should conduct an operational readiness review, which includes: Analyzing your data for existing gaps. Determining important milestones and preparing for implementation with a detailed roadmap. Running different loss methods to compare results. Once losses are calculated, you’ll want to select the best methodology based on your portfolio. Q: What is required to comply with CECL? GH: Complying with CECL may require financial institutions to gather, store and calculate more data than before. To satisfy CECL requirements, financial institutions will need to focus on end-to-end management, determine estimation approaches that will produce reasonable and supportable forecasts and automate their technology and platforms. Additionally, well-documented CECL estimations will require integrated workflows and incremental governance. Q: What should organizations look for in a partner that assists in measuring expected credit losses under CECL? GH: It’s expected that many financial institutions will use third-party vendors to help them implement CECL. Third-party solutions can help institutions prepare for the organization and operation implications by developing an effective data strategy plan and quantifying the impact of various forecasted conditions. The right third-party partner will deliver an integrated framework that empowers clients to optimize their data, enhance their modeling expertise and ensure policies and procedures supporting model governance are regulatory compliant. Q: What is CECL’s impact on financial institutions? How does the impact for credit unions/smaller lenders differ (if at all)? GH: CECL will have a significant effect on financial institutions’ accounting, modeling and forecasting. It also heavily impacts their allowance for credit losses and financial statements. Financial institutions must educate their investors and shareholders about how CECL-driven disclosure and reporting changes could potentially alter their bottom line. CECL’s requirements entail data that most credit unions and smaller lenders haven’t been actively storing and saving, leaving them with historical data that may not have been recorded or will be inaccessible when it’s needed for a CECL calculation. Q: How can Experian help with CECL compliance? JT: At Experian, we have one simple goal in mind when it comes to CECL compliance: how can we make it easier for our clients? Our Ascend CECL ForecasterTM, in partnership with Oliver Wyman, allows our clients to create CECL forecasts in a fraction of the time it normally takes, using a simple, configurable application that accurately predicts expected losses. The Ascend CECL Forecaster enables you to: Fulfill data requirements: We don’t ask you to gather, prepare or submit any data. The application is comprised of Experian’s extensive historical data, delivered via the Ascend Technology PlatformTM, economic data from Oxford Economics, as well as the auto and home valuation data needed to generate CECL forecasts for each unsecured and secured lending product in your portfolio. Leverage innovative technology: The application uses advanced machine learning models built on 15 years of industry-leading credit data using high-quality Oliver Wyman loan level models. Simplify processes: One of the biggest challenges our clients face is the amount of time and analytical effort it takes to create one CECL forecast, much less several that can be compared for optimal results. With the Ascend CECL Forecaster, creating a forecast is a simple process that can be delivered quickly and accurately. Q: What are immediate next steps? JT: As mentioned, complying with CECL may require you to gather, store and calculate more data than before. Therefore, it’s important that companies act now to better prepare. Immediate next steps include: Establishing your loss forecast methodology: CECL will require a new methodology, making it essential to take advantage of advanced statistical techniques and third-party solutions. Making additional reserves available: It’s imperative to understand how CECL impacts both revenue and profit. According to some estimates, banks will need to increase their reserves by up to 50% to comply with CECL requirements. Preparing your board and investors: Make sure key stakeholders are aware of the potential costs and profit impacts that these changes will have on your bottom line. Speak with an expert

What is CECL? CECL (Current Expected Credit Loss) is a new credit loss model, to be leveraged by financial institutions, that estimates the expected loss over the life of a loan by using historical information, current conditions and reasonable forecasts. According to AccountingToday, CECL is considered one of the most significant accounting changes in decades to affect entities that borrow and lend money. To comply with CECL by the assigned deadline, financial institutions will need to access much more data than they’re currently using to calculate their reserves under the incurred loss model, Allowance for Loan and Lease Losses (ALLL). How does it impact your business? CECL introduces uncertainty into accounting and growth calculations, as it represents a significant change in the way credit losses are currently estimated. The new standard allows financial institutions to calculate allowances in a variety of ways, including discounted cash flow, loss rates, roll-rates and probability of default analyses. “Large banks with historically good loss performance are projecting increased reserve requirements in the billions of dollars,” says Experian Advisory Services Senior Business Consultant, Gavin Harding. Here are a few changes that you should expect: Larger allowances will be required for most products As allowances will increase, pricing of the products will change to reflect higher capital cost Losses modeling will change, impacting both data collection and modeling methodology There will be a lower return on equity, especially in products with a longer life expectancy How can you prepare? “CECL compliance is a journey, rather than a destination,” says Gavin. “The key is to develop a thoughtful, data-driven approach that is tested and refined over time.” Financial institutions who start preparing for CECL now will ultimately set their organizations up for success. Here are a few ways to begin to assess your readiness: Create a roadmap and initiative prioritization plan Calculate the impact of CECL on your bottom line Run altered scenarios based on new lending policy and credit decision rules Understand the impact CECL will have on your profitability Evaluate current portfolios based on CECL methodology Run different loss methods and compare results Additionally, there is required data to capture, including quarterly or monthly loan-level account performance metrics, multiple year data based on loan product type and historical data for the life of the loan. How much time do you have? Like most accounting standards, CECL has different effective dates based on the type of reporting entity. Public business entities that file financial statements with the Security and Exchange Commission will have to comply by 2020, non-public entity banks must comply by 2022 and non-SEC registered companies have until 2023 to adopt the new standard. How can we help: Complying with CECL may require you to gather, store and calculate more data than before. Experian can help you comply with CECL guidelines including data needs, consulting and loan loss calculation. Experian industry experts will help update your current strategies and establish an appropriate timeline to meet compliance dates. Leveraging our best-in-class industry data, we will help you gain CECL compliance quickly and effectively, understand the impacts to your business and use these findings to improve overall profitability. Learn more
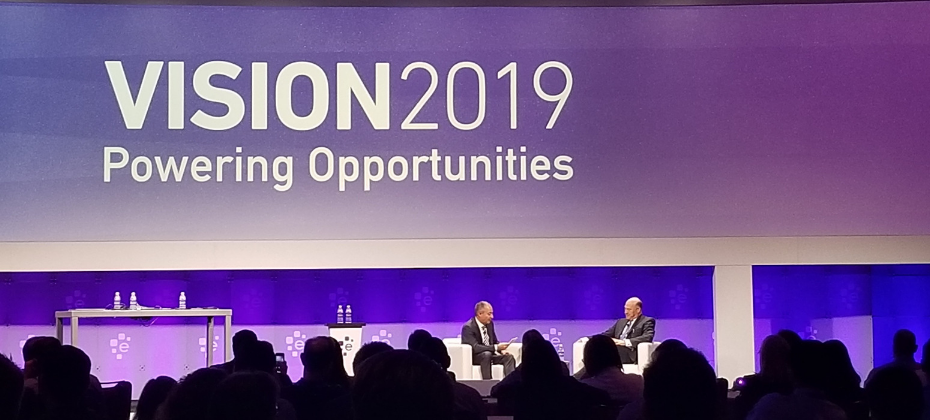
“Experian is transforming our business from a traditional credit bureau to a true technology and software provider,” said Craig Boundy, CEO of Experian, North America, as part of his opening remarks Monday morning to kick off the 2019 Experian Vision Conference. “We are committed to working as a force of good.” Covering the themes of financial inclusion, giving consumers control of their lives and better outcomes, a digital-first society, and the latest trends in fraud and security, Boundy addressed a crowd of over 850. Alex Lintner, Experian’s Group President, gave a quick history of the past 3,000 years, from the first credit card, to the addition of wheels to a suitcase, to the iPhone and artificial intelligence. “Innovation is not invention,” Lintner said. He gave the example of the iPhone and how a tear down analysis revealed there were no new elements; however, it was the translation of an idea into a good or service that benefited everyone (as the entire audience raised their hand when asked who had a smart phone). Lintner’s mainstage presentation also featured three live demos, including how the Ascend Technology Platform takes complex model building and outputs from days and weeks to a few clicks, to the incorporation of Small Business Financial Exchange (SBFE) data into the Ascend Analytical Sandbox (incorporating more than 17 years of small business tradeline data and 150 predictive attributes) and lastly, Experian Boost, which according to a live tracker, has boosted consumer credit scores by a total of 3.2 million points, as of this morning, since its launch eight weeks ago. Keynote Speaker: Gary D. Cohn Gary D. Cohn, Former Director of the U.S. National Economic Council, was Monday morning’s keynote speaker. He weighed in on the domestic and global economy, policy issues, financial institutions’ responsibilities and some of his predictions. Cohn brought attention to the ever-changing financial services space, including new forms of encryption and the world of biometric security, calling the financial services industry the “tip of the spear” when it comes to the digitization of the world. Session Highlights - Day 1 Machine Learning From the building blocks of neural networks to artificial intelligence, machine learning has been used in the areas of financial services that do not have adverse actions – think fraud, ID, collections. As we look to harness machine learning for models and other spaces (including adverse action), it’s important to delineate descriptive data (what’s happening now); predictive data (what’s happening in the future); prescriptive data (what am I going to do now); and cognitive data (are we asking the right question?). In addition, it’s necessary to address the five advanced analytic drivers including customer experience, cost, risk and loss, growth and compliance. Home Equity & Lending US macroeconomic trends show consumer confidence is still on an upward trend. While investor confidence is a little volatile, the GDP remains strong (though slightly slowing down) and unemployment is low and forecasted to remain low. Since 2006, the US hasn’t returned in the HELOC space. Mortgage and personal loans are up 20% and 13% respectively, while mortgages have dropped 1% and HELOCs have dropped 2%. With an estimated market potential of over $700 billion, HELOCs may be an untapped credit line given the strength of the economy. Identity Evolution From dumpster divers, aka pulling receipts out of dumpsters behind businesses, to today’s identity-based authentication, there’s been an evolution of how identity is defined as well as its corresponding risks. According to Experian’s Global Fraud & Identity Report, 74% of consumers value security as the most important part of the online experience (over convenience and personalization). However, 74% of consumers abandoned a shopping session that required too much information, and 72% of consumers said they were willing to share more data if it meant a seamless experience. What does this mean? Consumers want it all. Identity today now includes proxies and activity, which can also mean greater risk. Because of aggregators and other associated entities acting on a consumer’s behalf, there are lots of nuances that will need to be looked through. Consumer-Permissioned Data In order to be more consumer-centric, there are four levers through which consumers are given control: data accuracy, knowing their financial profile, the ability to improve their scores (via Experian BoostTM and UltraFICOTM) and protecting consumers when they permission access to their identity credentials. Using Experian Boost, consumers have seen an average increase of 13 points for consumers with positive changes. Additionally, using alternative credit data, financial institutions can score more people and score more accurately. One hundred million consumers could gain greater access to credit with consumer-permissioned data sources. --- Meanwhile, the tech showcase featured over 20 demos covering alternative data, digital credit marketing, consumer empowerment, fraud and identity, integrated decisioning and technology. More insights from Vision to come. Follow @ExperianVision and #ExperianVision on Twitter to see more of the action.

Experian’s 38th annual Vision Conference kicks off on Sunday, May 5 in San Antonio, Texas. The sold-out thought leadership conference, is known for driving discussions on the industry’s hard-hitting topics as well as introducing the latest and greatest in technology, innovation and data science. “For 38 years, Experian’s Vision Conference has connected business leaders to new ideas and solutions through cutting edge data and insights. Our goal is to power opportunities for you to target new markets, grow existing customer bases, improve response rates, reduce fraud and increase profits by using our data, analytics and technology. The intimate setting of the conference allows for unique networking opportunities with the industry’s most sought-after thought leaders,” said Klaudette Christensen, Experian’s Chief Operations Officer. A few spotlight sessions include: Several sessions about machine learning and artificial intelligence, highlighting opportunities related to best practices, underwriting and fraud detection A deep dive into the modern mortgage, leveraging insights on home equity and how to leverage data and analytics to redefine the process as it’s known today Sessions on credit delinquency, collections and the Great Recession Marketing analytics and the latest releases from Experian’s Ascend Platform Sessions on advanced analytics and integrated decisioning as they relate to commercial and consumer insights The event, which runs through Tuesday evening, continues its tradition of featuring several noteworthy keynote speakers. On Monday, Gary D. Cohn, American business leader, philanthropist and former Director of the U.S. National Economic Council, will kick off the event. On Tuesday, Aimée Mullins will take the stage discussing what is “possible” by drawing from her experiences as a record-breaking Olympic athlete, model and actress. The closing keynote will feature five-time NBA Champion and two-time Olympic Gold Medalist, Kobe Bryant. The event will also include a Tech Showcase, featuring hands-on demos for attendees to experience. Stay tuned for additional highlights and insights on our social media platforms throughout the course of the conference. Follow Experian Insights on Twitter and LinkedIn and check out #ExperianVision.

Your consumers’ credit score plays an important role in how lenders and financial institutions measure their creditworthiness and risk. With a good credit score, which is generally defined as a score of 700 or above, they can quickly be approved for credit cards, qualify for a mortgage, and have easier access to loans with lower interest rates. In the spirit of Financial Literacy Month, we’ve rounded up what it takes for consumers to have a good credit score, in addition to some alternative considerations. Pay on Time Life gets busy and sometimes your consumers miss the “credit card payment due” note on their calendar squished between their work meetings and doctor’s appointment. However, payment history is one of the top factors in most credit scoring models and accounts for 35% of their credit score. As the primary objective of your consumers’ credit score is to illustrate to lenders just how likely they are to repay their debts, even one missed payment can be viewed negatively when reviewing their credit history. However, if there is a missed payment, consider checking their alternative financial services payments. They may have additional payment histories that will skew their creditworthiness more so than just their record according to traditional credit lines alone. Limit Credit Cards When your consumers apply for a new loan or credit card, lenders “pull” their credit report(s) to review their profile and weigh the risk of granting them credit or loan approval. The record of the access to their credit reports is known as a “hard” inquiry and has the potential to impact their credit score for up to 12 months. Plus, if they’re already having trouble using their card responsibly, taking on potential new revolving credit could impact their balance-to-limit ratio. For your customers that may be looking for new cards, Experian can estimate your consumers spend on all general-purpose credit and charge cards, so you can identify where there is additional wallet share and assign their credit lines based on actual spending need. Have a Lengthy Credit History The longer your consumers’ credit history, the more time they’ve spent successfully managing their credit obligations. When considering credit age, which makes up 21% of their credit score, credit scoring models evaluate the ages of your consumers’ oldest and newest accounts, along with the average age of all their accounts. Every time they open new credit cards or close an old account, the average age of their credit history is impacted. If your consumer’s score is being negatively affected by their credit history, consider adding information from alternative credit data sources for a more complete view. Manage Debt Wisely While some types of debt, such as a mortgage, can help build financial health, too much debt may lead to significant financial problems. By planning, budgeting, only borrowing when it makes sense, and setting themselves up for unexpected financial expenses, your consumers will be on the path to effective debt management. To get a better view of your consumers spending, consider Experian’s Trended3DTM, a trended attribute set that helps lenders unlock valuable insights hidden within their consumers’ credit scores. By using Trended3DTM data attributes, you’ll be able to see how much of your consumers’ credit line they typically utilize, whether they tend to revolve or transact, and if they are likely to transfer a balance. By adopting these habits and making smart financial decisions, your consumers will quickly realize that it’s never too late to rebuild their credit score. For example, they can potentially instantly improve their score with Experian Boost, an online tool that scans their bank account transactions to identify mobile phone and utility payments. The positive payments are then added to their Experian credit file and increase their FICO® Score in real time. Learn More About Experian Boost Learn More About Experian Trended 3DTM

A court in a Northern China province has developed a mobile app designed to enforce court rulings and create a socially credible environment. The app, which can be accessed via WeChat, China's most popular instant messaging platform, is designed to alert users when they are within a 500-meter radius of someone in debt. Users will get personal information about the debtors, including their exact location, names, national ID numbers, and why they have a low score. It's the latest innovation to become integrated into China's social credit system. What is a social credit system? China's social credit system, which will be enforced in 2020, aims to standardize the social reputation of citizens and businesses. It will rank citizens by attaching a score to various aspects of their social life - ranging from paying court fees to drinking alcohol to failing to pay bills. Although there are proposed consequences for low scorers, including travel bans and loan declines, 80% of citizens recently surveyed by the Washington Post support it. While the app seems like it could be a plotline from a "Black Mirror" episode, with its emphasis on reputation scoring and location-based activation, there are reasons it makes sense for the rather remote northern province. With many people in China still not having formal access to traditional banks, being able to alternatively assess their trustworthiness and risk could provide them the ability to access loans, rent houses, and even send their children to school. Additionally, to increase their scores, Chinese citizens are displaying improved behavior. China isn't the first country to attempt to gain a robust understanding of its consumers through alternative data sources. While U.S. financial institutions have experimented with using social media as a factor in determining a borrower's risk, Philippines-based Lenddo, a world leader in scoring and identity verification technology, is doing that and more. The company looks at social media, email, and mobile headset activity to determine repayment ability. Moreover, Discovery Bank in South Africa believes there's a correlation between fiscal responsibility and physical health. The South African bank plans to begin tracking the habits of its 4.4 million customers and offering better deals to those who are living a healthier lifestyle. For example, consumers can earn points for visiting the gym, getting a flu shot, or buying healthy groceries. The more points a consumer collects the better deals and savings they'll receive. The willingness to share data is not a characteristic unique to South African or Chinese citizens. A recent Accenture study of 47,000 banking and insurance customers showed that consumers are willing to share personal data in exchange for better customer assistance and discounts on products and services. The full extent of the impact on social credit to Chinese citizens is impossible to calculate, simply because the system doesn't fully exist yet. However, it does serve as an example of the many ways that credit scoring and the use of customer-permissioned data are evolving. Long gone are the days of mailing checks, ordering from a catalog, or even needing to carry cash. What's next?

When it comes to relationships and significant others, debt is topping lists of what people look for - or don't look for - in their partner. Where looks, pedigree, or career trajectory were previous motivation drivers for mate selection (or at least companionship), recent studies indicate debt is a deal-breaker for many looking for love. Late payments from lifestyles past, less-than-stellar credit scores, and cancelled credit cards are all exhibits of debt and destruction influencing personal relationships, not to mention the relationship financial institutions have with these consumers. Are certain relationships – or rather, specific partners – more likely to carry debt? Women were found to be more financially vulnerable, according to the Survey of Consumer Finances, conducted by the Federal Reserve, that examined how men and women who had never been married felt about debt. Recent Experian data found that while both men and women share the same amount of revolving utilization at 30%, men carry more debt than women, $27,067 compared to $23,881 for women. Men are also more likely to have larger mortgage debt at $214,908 compared to $198,622 for women. Women have more credit cards and more retail cards but lower balances than men on both. From a generational viewpoint, Gen X and Boomer generations have a higher than average number of credit cards and higher than average number of retail cards (and the highest average balance on credit cards and retail cards). Gen X also has the highest average debt by generation for both non-mortgage and mortgage debt. While Boomer and Silent Generations have lower than average mortgage debt, the boomer generation still has higher than average non-mortgage debt. With nearly 3 in 4 American adults saying they would reconsider their romantic relationship because of their partner’s debt, consumers should consider revamping their balance sheets before updating their online dating profiles. For the hopeless romantics, the star-crossed lovers, and those instead celebrating Singles Awareness Day whose finances could use a little love, perhaps a digital collections portal or personalized options to consolidate debt might speak to their love language. Or, in the meantime, maybe a list of the top cities for singles with the best credit scores could be a start.