Uncategorized

Trivia question: Millennials don’t purchase new vehicles. True or False?

There are many factors attributing to the success of dealerships. When it comes to dealers, empirical guidance is a great way to study effective advertising. Experian brought Auto, Targeting, and the Dealer Positioning System capabilities together in a nationwide study to answer the ultimate question: what drives sales? The answers can be found in Experian’s 2018 Attribution Study. This is a wide-ranging, dealer-focused sales-driven attribution study that analyzed a few key variables. We deployed 187,701 tracking pixels to devices in 41,012 distinct households, focused on 15 digital metrics to learn about shopper behavior, and tied that digital shopping data to 2,436 vehicle sales. An industry first, Experian’s ability to combine automotive registration data, sales data, and website analytics and online behavior data puts us in a position to do something that very few companies can do. We use the household identifiers to not only see who bought a car and who bought specifically from a participating dealer, but also how they shopped the dealer’s site. Our ability to accurately identify a household’s digital behavior is based on the fact that we are a source compiler of the data and have it sitting under one roof. Others that attempt to provide this type of insight need to contract out for registrations, sales data imports from the dealership, website analytics, household identifiers, or all the above, which generally adds time to the insights. Using our sales-based approach, we can deliver unbiased attribution. Sales-based attribution is attributing credit to different advertising sources/campaigns based on actual vehicle sales – including those targeted consumers that may have purchased outside of the dealership. This is the Holy Grail of attribution for car dealers since it ties an offline activity such as buying a car back to the online advertising that’s taking up most their budgets every month. Because of that offline-online disconnect, sales-based attribution is difficult. Other automotive attribution models are typically focused on website conversions or website behavior – “what advertising can I attribute website leads to” (conversions) or “what advertising is driving users who follow the behavior that I think shows they’re likely to buy from my dealership” (website behavior.) What are the takeaways? We found three takeaways from our study. First off, we look at shopper behavior instead of isolating KPIs. Later we will discuss how traditional website metrics do not tie-in to sales. Second, we look at optimizing your paid advertising. Finally, we look at third-party investments. Although third parties drive sales, they may not be your sales. Looking at shopper behavior, not isolated KPI’s Traditional website metrics don’t tell the sales story for dealers. Traditional conversion stats are equal for buyers vs. all traffic such as VDPs or page views What this means is on average, buyers converted at a lower rate than overall website traffic. Looking solely at form submissions, hours and directions pageviews, and mobile clicks-to-call, don’t give the best view of what advertising is driving sales. With that, 98% of buyer traffic never submitted a form or went to the hours and directions page. This is a typical website conversion that dealers, vendors, and advertising agencies focus on. Since traditional web metrics don’t tell the story, there is another way. These are called High-Value Users, or HVU. They purchase at a 34% higher rate than overall traffic although they make up 11% of all traffic. High-Value Users are an Experian derived KPI. What makes someone an HVU are four different measurements. They must visit a website at least three times Spend at least six minutes on the site in total View at least eight pages in total View at least one VDP High-Value Users correlates to sales better than Vehicle Detail Page or VDP metrics. In this study, the correlation for VDP was measured at .595 which is rated a medium correlation. Meanwhile, HVU scored a .698 which is rated a high correlation. Looking at many different behavioral KPIs, like we do with our High-Value User (HVU) metric, correlates better to sales than just looking at how many VDPs you had. Driving more VDPs won’t necessarily help sales. But driving more HVUs is more likely to correlate with more sales. This also gets back to the attribution discussion above: Experian sales-based attribution is the best, and Experian’s HVUs are a good method for web-based attribution. From this attribution study, High-Value Users are a vital group for dealers to utilize. In our next post, we will go over the second and third takeaways from the attribution study: optimizing paid advertising and evaluating third-party investments.

Although it’s hard to imagine, some synthetic identities are being used for purposes other than fraud. Here are 3 types of common synthetic identities and why they’re created: Bad — To circumvent lag times and delays in establishing a legitimate identity and data footprint. Worse — To “repair” credit, hoping to start again with a higher credit rating under a new, assumed identity. Worst — To commit fraud by opening various accounts with no intention of paying those debts or service fees. While all these synthetic identity types are detrimental to the ecosystem shared by consumers, institutions and service providers, they should be separated by type — guiding appropriate treatment. Learn more in our new white paper produced with Whitepages Pro, Fighting synthetic identity theft: getting beyond Social Security numbers. Download now>

The economy remains steady, maintaining a positive outlook even though the GDP growth slowed in the first quarter. Real estate is holding ground even as rates rise. We’ve reached a 7-year high in 30-year fixed-rate mortgages, which could have a longer-term effect on this market. Bankcard may be reaching its limit — outstanding balances hit $764 billion and delinquency rates continue to rise. While auto originations were flat in Q1, performance is improving as focus moves away from subprime lending. The economy remains steady as we transition from 2017. Keep an eye on inflation and interest rates in regard to their possible short-term economic impact. Learn more about these and other economic trends with the on-demand recording of the webinar. Watch now

There is a delicate balance in delivering a digital experience that instills confidence while providing easy and convenient account access. When it comes to a frictionless, secure customer experience, our 2018 Global Fraud and Identity Report research showed: 52% of businesses have chosen to prioritize the user experience over detecting the mitigating fraud. 78% of consumers will create an account to complete ecommerce purchased because it is a trusted brand/website. 60% of consumers will follow through with a transaction even if they have forgotten their user name or password. Consumers believe that having simple, instant and easy-to-access verification methods are important to their experience when shopping online. Are your providing this? 2018 Global Fraud and Identity Report

Marketers are keenly aware of how important it is to “Know thy customer.” Yet customer knowledge isn’t restricted to the marketing-savvy. It’s also essential to credit risk managers and model developers. Identifying and separating customers into distinct groups based on various types of behavior is foundational to building effective custom models. This integral part of custom model development is known as segmentation analysis. Segmentation is the process of dividing customers or prospects into groupings based on similar behaviors such as length of time as a customer or payment patterns like credit card revolvers versus transactors. The more similar or homogeneous the customer grouping, the less variation across the customer segments are included in each segment’s custom model development. So how many scorecards are needed to aptly score and mitigate credit risk? There are several general principles we’ve learned over the course of developing hundreds of models that help determine whether multiple scorecards are warranted and, if so, how many. A robust segmentation analysis contains two components. The first is the generation of potential segments, and the second is the evaluation of such segments. Here I’ll discuss the generation of potential segments within a segmentation scheme. A second blog post will continue with a discussion on evaluation of such segments. When generating a customer segmentation scheme, several approaches are worth considering: heuristic, empirical and combined. A heuristic approach considers business learnings obtained through trial and error or experimental design. Portfolio managers will have insight on how segments of their portfolio behave differently that can and often should be included within a segmentation analysis. An empirical approach is data-driven and involves the use of quantitative techniques to evaluate potential customer segmentation splits. During this approach, statistical analysis is performed to identify forms of behavior across the customer population. Different interactive behavior for different segments of the overall population will correspond to different predictive patterns for these predictor variables, signifying that separate segment scorecards will be beneficial. Finally, a combination of heuristic and empirical approaches considers both the business needs and data-driven results. Once the set of potential customer segments has been identified, the next step in a segmentation analysis is the evaluation of those segments. Stay tuned as we look further into this topic. Learn more about how Experian Decision Analytics can help you with your segmentation or custom model development needs.
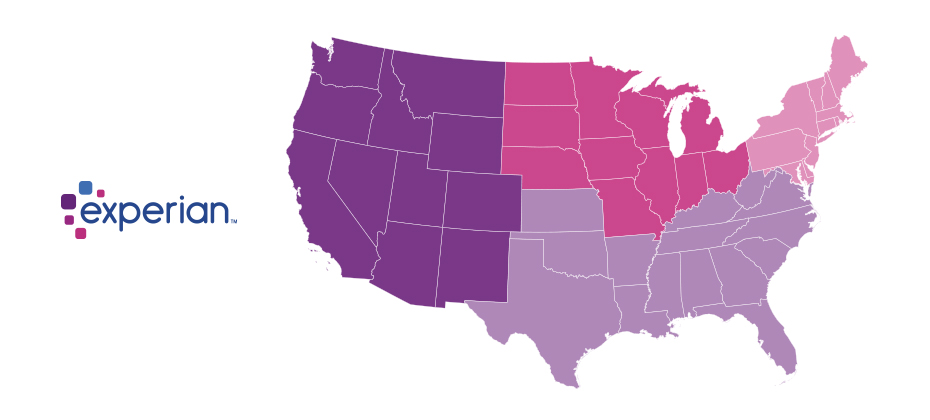
With 16.7 million reported victims of identity fraud in 2017 (that’s 6.64 percent of the U.S. population), it was another record year for the number of fraud victims. And as online and mobile transaction growth continued to significantly outpace brick-and-mortar growth, criminal attacks also grew rapidly. This past year, we saw an increase of more than 30 percent in e-commerce fraud attacks compared with 2016. As we’ve done over the past three years, Experian® analyzed millions of online transactions to identify fraud attack rates for both shipping and billing locations across the United States. We looked at several data points, including geography and IP address, to help businesses better understand how and where fraud is being perpetrated so they can better protect against it. The 2017 e-commerce fraud attack rate analysis shows: Delaware and Oregon continue to be the riskiest states for both billing and shipping fraud. Delaware; Oregon; Washington, D.C.; Florida; and Georgia are the top five riskiest states for billing fraud. Delaware, Oregon, Florida, New York and California are the top five riskiest states for shipping fraud, accounting for 50 percent of total fraud attacks. South El Monte, Calif., is the riskiest city overall, with an increase in shipping fraud of approximately 230 percent. Shipping fraud most often occurs near major airports and seaports due to reshippers and freight forwarders that receive domestic goods and often send them overseas. When a transaction originates from an international IP address, shipping fraud is 6.7 times likelier than the average, while billing fraud becomes 7.1 times likelier. Where is e-commerce fraud happening? Typically, the highest-risk areas for fraud are in ZIP™ codes and cities near large ports of entry or airports. These are ideal locations to reship fraudulent merchandise, enabling criminals to move stolen goods more effectively. Top 10 riskiest billing ZIP™ codes Top 10 riskiest shipping ZIP™ codes 97252 Portland, OR 97079 Beaverton, OR 33198 Miami, FL 33122 Miami, FL 33166 Miami, FL 91733 South El Monte, CA 33122 Miami, FL 97251 Portland, OR 77060 Houston, TX 97250 Portland, OR 33195 Miami, FL 33166 Miami, FL 97250 Portland, OR 97252 Portland, OR 97251 Portland, OR 33198 Miami, FL 33191 Miami, FL 33195 Miami, FL 97253 Portland, OR 33192 Miami, FL Source: Experian.com Source: Experian.com What’s more, many of the riskiest ZIP™ codes and cities experience a high volume of transactions originating from international IP addresses. In fact, the top 10 riskiest ZIP codes overall tend to experience fraudulent activity from numerous countries overseas, including China, Venezuela, Taiwan and Hong Kong, and Argentina. These fraudsters tend to implement complex fraud schemes that can cost businesses millions of dollars in fraud losses. Additionally, the analysis shows that traffic coming from a proxy server — which could originate from domestic and international IP addresses — is 74 times riskier than the average transaction. The problem The increase in e-commerce fraud attacks shouldn’t come as a huge surprise. The uptick in data breaches, merchants’ continued adoption of EMV-enabled terminals to protect against counterfeit card fraud and the abundance of consumer data on the dark web means that information is even more accessible to criminals. This enables them to open fraudulent accounts, take over legitimate accounts and submit fraudulent transactions. Another reason for the increase is automation. In the past, criminals needed a strong understanding of fraud methods and technology, but they can now bring down an entire organization by simply downloading a file and automating the submission of thousands of applications or transactions simultaneously. Since fraudsters need to make these transactions appear as normal as possible, they often leverage the cardholder’s actual billing details with slight differences, such as e-mail address or shipping location. Unfortunately, the mass availability of compromised data and the abundance of fraudsters makes it increasingly challenging to identify and separate legitimate customers from attackers across the country. Because of the widespread prevalence of fraud and data compromises, we don’t see billing fraud concentrated in just one region of the country. In fact, the top five states for billing fraud make up only about 18 percent of overall fraud attacks. Top 5 riskiest billing fraud states Top 5 riskiest shipping fraud states State Fraud attack rate State Fraud attack rate Delaware 93.4 Delaware 195.9 Oregon 86.1 Oregon 170.1 Washington, D.C. 46.5 Florida 45.1 Florida 39.2 New York 37.3 Georgia 31.5 California 32.6 Source: Experian.com Source: Experian.com Prevention and protection need to be the priority As businesses get a better understanding of how and where fraud is perpetrated, they can implement proactive strategies to detect and prevent attacks, as well as protect payment information. While no one single strategy can address the entire scope of fraud, there are advanced data sets and technology — such as device intelligence, behavioral and physical biometrics, document verification and entity resolution — that can help businesses make better fraud decisions. Fortunately, consumers can also play a major role in safeguarding their information. In addition to regularly checking their credit reports and bank/credit card statements for fraudulent activity, consumers can limit the data they share on social networking sites, where attackers often begin when perpetrating identity fraud. While we continue to help both organizations and consumers limit their exposure to e-commerce fraud, we anticipate that criminals will attempt more sophisticated fraud schemes. But businesses can stay ahead of the curve. This comes down to having a keen understanding of how fraud is being perpetrated, as well as leveraging data, technology and multiple layered strategies to better recognize legitimate customers and make more precise fraud decisions. View our e-commerce fraud heat map and download the top 100 riskiest ZIP codes in the United States. Experian is a nonexclusive full-service provider licensee of the United States Postal Service®. The following trademark is owned by the United States Postal Service®: ZIP. The price for Experian’s services is not established, controlled or approved by the United States Postal Service.

Managing your customer accounts at the identity level is ambitious and necessary, but possible Identity-related fraud exposure and losses continue to grow. The underlying schemes have elevated in complexity. Because it’s more difficult to perpetrate “card present” fraud in the post–chip-and-signature rollout here in the United States, bad guys are more motivated and getting better at identity theft and synthetic identity attacks. Their organized nefarious response takes the form of alternate attack vectors and methodologies — which means you need to stamp out any detected exposure point in your fraud prevention strategies as soon as it’s detected. Experian’s recently published 2018 Global Fraud and Identity Report suggests two-thirds, or 7 out of every ten, consumers want to see visible security protocols when they transact. But an ever-growing percentage of them, fueled in no small part by those tech-savvy millennials, expect to be recognized with little or no friction. In fact, 42 percent of the surveyed consumers who stated they would do more transactions online if there weren’t so many security hurdles to overcome were — you guessed it — millennials. So how do you implement identity and account management procedures that are effective and, in some cases, even obvious while being passive enough to not add friction to the user experience? In other words, from the consumer’s perspective, “Let me know you know me and are protecting me but not making it too difficult for me when I want to access or manage my account.” Let’s get one thing out of the way first. This isn’t a one-time project or effort. It is, however, a commitment to the continued informing of your account management strategies with updated identity intelligence. You need to make better decisions on when to let a low-risk account transaction (monetary or nonmonetary) pass and when to double down a bit and step up authentication or risk assessment checks. I’d suggest this is most easily accomplished through a single, real-time access point to myriad services that should, at the very least, include: Identity verification and reverification checks for ongoing reaffirmation of your customer identity data quality and accuracy. Know Your Customer program requirements, anyone? Targeted identity risk scores and underlying attributes designed to isolate identity theft, first-party fraud and synthetic identity. Fraud risk comes in many flavors. So must your analytics. Device intelligence and risk assessment. A customer identity is no longer just their name, address, Social Security number and date of birth. It’s their phone number, email address and the various devices they use to access your services as well. Knowing how that combination of elements presents itself over time is critical. Layered passive or more active authentication options such as document verification, biometrics, behavioral metrics, knowledge-based verification and alternative data sources. Ongoing identity monitoring and proactive alerting and segmentation of customers whose identity risk has shifted to the point of required treatment. Orchestration, workflow and decisioning capabilities that allow your team to make sense of the many innovative options available in customer recognition and risk assessment — without a “throw the kitchen sink at this problem” approach that will undoubtedly be way too costly in dollars spent and good customers annoyed. Fraud attacks are dynamic. Your customers’ perceptions and expectations will continue to evolve. The markets you address and the services you provide will vary in risk and reward. An innovative marketplace of identity management services can overwhelm. Make sure your strategic identity management partner has good answers to all of this and enables you to future-proof your investments.

From malware and phishing to expansive distributed denial-of-service attacks, the sophistication, scale and impact of cyberattacks have evolved significantly in recent years. Mitigate risk by employing these best practices: Manage third-party risks. Regularly review response plans. Opt in to software updates. Educate, educate, educate. Organizations must adopt stronger, more advanced technical solutions to protect sensitive data. While enhanced technology is necessary for defending against data breaches, it can’t work independently. Learn more

Trended attributes and consumer lending Digging deeper into consumer credit data can help provide new insights into trending behavior, providing more than just point-in-time credit evaluation. The information derived through trended attributes can help you understand your customers’: Payment rates and account migration behavior. Slope of balance changes. Delinquency patterns over time. Today’s consumer lending environment is more dynamic and competitive than ever. Trended attributes can give additional lift in your segmentation strategies and custom models and provides a high-definition lens that opens a world of opportunity. Learn more

June 2018 will mark the one-year anniversary of the National Institute of Standards and Technology (NIST) release of Special Publication 800-63-3, Digital Identity Guidelines. While federal agencies are the most directly impacted, this guidance signals a seismic shift in identity proofing across the entire ecosystem of consumers, private sector businesses and public sector agencies. It’s the clearest claim I’ve seen to date that traditional, and rather basic, personally identifiable information (PII) verification should no longer be trusted for remote user interaction. For those of us in the fraud and identity space, this isn’t a new revelation, but one we as an industry have been dealing with for years. As the data breach floodgates continue to be pushed further open, PII is a commodity for the fraudsters, evident in PII prices on the dark web, which are often lower than your favorite latte. Identity-related schemes have increased due to fraud attacks shifting away from card compromise (due to the U.S. rollout of chip-and-signature cards), double-digit growth in online and mobile consumer channels, and high-profile fraud events within both the public and private sector. It’s no shock that NIST has taken a sledgehammer to previous guidance around identity proofing and replaced it with an aggressive and rather challenging set of requirements seemingly founded in the assumption that all PII (names, addresses, dates of birth, Social Security numbers, etc.) is either compromised or easily can be compromised in the future. So where does this leave us? I applaud the pragmatic approach to the new NIST standards and consider it a signal to all of us in the identity marketplace. It’s aggressive and aspirational in raising the bar in identity proofing and management. I welcome the challenge in serving our public sector clients, as we have done for nearly a decade. Our innovative approach to layered levels of identity verification, validation, risk assessment and monitoring adhere to the recommendations of the new NIST standards. I do, however, recommend that any institution applying these standards to their own processes and applications ensure they place equal focus on comparable alternatives for those addressable populations and users who are likely to either opt out of, or fail, initial verification steps stringently aligned with the new requirements. While too early to accurately forecast, it’s relatively safe to assume that the percentage of the population “falling out of the process” may easily be counted in the double digits. It’s only through advanced analytics and technology reliant on a significant breadth and depth of identity data and observations that we can provide trust and confidence across such a diverse population in age, demographics, expectations and access.

The average number of retail trades per consumer has been trending down since 2007. But the average consumer retail debt is trending up, roughly $73 year-over-year. When analyzing single-store credit card debt by state in 2017, we found: States with the highest retail debt: Texas ($2,198) Alaska ($2,170) Arkansas ($2,067) States with the lowest amount of retail debt: Wisconsin ($1,374) Minnesota ($1,440) Hawaii ($1,442) Whether you’re a retailer, credit union or financial institution, stay ahead of the competition by using advanced analytics to target the right customers and increase profitability. More credit trends

Organizations that can mobilize their data assets to power critical business initiatives will see a distinct advantage in the coming years. In fact, most C-level executives (87%) believe data has greatly disrupted their organization’s operations over the past 12 months. Here are more insights from the newly released 2018 global data management benchmark report: As digital transformation efforts proliferate and become commonplace, organizations will need to implement processes and technology that scale with the demands of data-driven business. Read the full report

It’s clear the digital marketplace is here to stay. Online activities among consumers reflect the increased adoption of digital commerce. In fact, recent findings from our 2018 Global Fraud and Identity Report show the top activity on mobile devices is online shopping, followed closely by personal banking. Consumers trust technology and, by proxy, the businesses that help enable it. It’s critical for organizations to continue to build trust online without disrupting the consumer experience. It’s the goal — and the responsibility — of businesses. Learn more

Experian® is honored to be an MRC Technology Award nominee. But we can’t win the MRC People’s Choice Award without your help! The annual MRC Technology Awards recognize the most elite solution providers making significant contributions in the fraud, payments and risk industries. CrossCore® is the first smart, open, plug-and-play platform for fraud and identity services. We know, and our clients agree, that it delivers a better way to modify strategies quickly, catch fraud faster, improve compliance and enhance the customer experience. Need further convincing? Here are the top 3 reasons you should vote for CrossCore. Reason 1: common access Manage your entire fraud and identity portfolio. Start immediately by turning on Experian services through a single integration. Connect to services quickly with a common, flexible API. Reason 2: open approach Control the data being used in decisions. CrossCore supports a best-in-class approach to managing a portfolio of services that work together in any combination — including Experian solutions, third-party services and client systems — delivering the level of confidence needed for each transaction. Reason 3: workflow decisioning Act quickly and adapt to new risks with built-in strategy design and workflow capabilities. You can precisely tailor strategies based on transaction type or risk threshold. Make changes dynamically, with no downtime. We hope you’ll vote for CrossCore as a better way to manage fraud prevention and identity services.