Tag: analytics

Small SUVs became the most financed vehicle segment in Q3 2020, making up 26.01% of all financed vehicles during the quarter.

While things aren't quite back to normal in Q3 2020, there were a number of positive trends that demonstrates the automotive industry's resilience.

Financial services companies have long struggled to make inclusive decisions for small businesses and for low- and moderate-income consumers. One key reason: to make accurate predictions of the financial risks associated with those customers’ accounts requires lenders to rely on a wider variety of data than a credit score alone. To accurately assess risk, expanded Fair Credit Reporting Act regulated data is helpful – including rental data, trended data, enhanced public records, alternative financial services data and more. This expanded FCRA data is one key to financial inclusion. Without that data, lenders risk rejecting potentially profitable customers, including so-called credit invisibles and thin file consumers. In fact, The Federal Reserve, along with four important financial services regulators, highlighted the consumer benefits of alternative data in their December 2019 interagency statement. That statement also highlighted the increased importance of managing compliance when firms use alternative data in credit underwriting. With hundreds of data sources available to help with important tasks such as verifying identity, checking credit, and assessing the value of automotive and real-estate collateral, why have some lenders been slow to use the most appropriate data attributes when making credit decisions? One reason is a matter of IT Architecture; another is priorities. Changing a business process to take advantage of new data requirements can be prohibitively lengthy and costly – in terms of both analytical and IT resources. This is especially true for older systems—which were seldom adapted to use Application Programming Interfaces (APIs) supporting modern data structures such as JSON. Furthermore, data access to older systems can require specific types of system connectivity such as VPNs or leased lines. Latency is important in this type of application: some of these tasks have to be done instantly in a digital-first or digital-only lending environment. So is time to market: lenders deploying analytics processes cannot wait for overtaxed IT teams to complete lengthy projects. Lenders’ analytics and IT teams have long known they need to be more agile and efficient, faster to market, and increasingly secure. Their answer, largely, has been a slow but steady migration of their systems to the cloud. A 2019 McKinsey survey revealed that CIOs were modernizing their infrastructures primarily to achieve four goals: agility and time to market, quality and reliability, cost, and security. There are other benefits as well. But if the business case for a cloud strategy was somewhat clear to IT and analytics leaders, it became crystal clear to the rest of the business in 2020. As companies shifted to at-home work using cloud-based collaboration tools, especially videoconferencing services, most companies conquered what was perhaps the final barrier to entry—the fear that the issues of data privacy and security were somehow more insurmountable with virtual machines, containers, and microservices than with on-premise infrastructure. Last quarter, the leading cloud providers Amazon Web Services, Google Cloud Platform, and Microsoft Azure reported incredible annual revenue growth: 29%, 45%, and 48% respectively. COVID-19 has proven to be the catalyst that greatly sped up the transition to cloud technologies. The jump to the cloud means that lenders are suddenly more capable than ever at making analytically sound – and therefore more financially inclusive decisions. The key to analytical decision-making is to use the right data and to make the most appropriate calculations (called attributes) as part of a business strategy or a mathematical model. With Experian programs such as Attribute Toolbox now available in the cloud, calculating those all-important attributes is as simple for the IT department as coding an API call. Lenders will soon be able just as easily to retrieve and process raw data from over 100 data sources, to recognize their native formats and to extract the desired information quickly enough for real-time and batch decisioning. The pandemic has brought economic distress to millions of Americans—it is unlike anything in our lifetimes. The growth of cloud computing promises to enable these consumers to obtain additional products as well as more favorable pricing and terms. It’s ironic that COVID has accelerated the adoption of the very technologies that will expand access to credit for many people who cannot currently access it from mainstream financial firms. To learn more about our Attribute Toolbox, click here. Learn More

The global pandemic has created major shifts in the ways companies operate and innovate. For many organizations, a heavy reliance on cloud applications and cloud services has become the new normal, with cloud applications being praised as “an unsung hero” for accommodating a world in crisis, as stated in an article from the Channel Company. However, cloud computing isn’t just for consumers and employees working from home. In the last few years, cloud computing has changed the way organizations and businesses operate. Cloud-based solutions offer the flexibility, reduced operational costs and fast deployment that can transform the ways traditional companies operate. In fact, migrating services and software to the cloud has become one of the next steps to a successful digital transformation. What is cloud computing? Simply put – it’s the ability to run applications or software from remote servers, hosted by external providers, also known as infrastructure-as-a-service (IaaS). Data collected from cloud computing is stored online and is accessed via the Internet. According to a study by CommVault, more than 93% of business leaders say that they are moving at least some of their processes to the cloud, and a majority are already cloud-only or plan to completely migrate. In a recent Forrester blog titled ‘Troubled Times Test Traditional Tech Titans,’ Glenn O’Donnell, Vice President, Research Director at Forrester highlights that “as we saw in prior economic crises, the developments that carried business through the crisis remained in place. As many companies shift their infrastructure to cloud services through this pandemic, those migrated systems will almost certainly remain in the cloud.” In short, cloud computing is the new wave – now more than ever during a crisis. But what are the benefits of moving to the cloud? Flexibility Cloud computing offers the flexibility that companies need to adjust to fluctuating business environments. During periods of unexpected growth or slow growth, companies can expand to add or remove storage space, applications, or features and scale as needed. Businesses will only have to pay for the resources that they need. In a pandemic, having this flexibility and easy access is the key to adjusting to volatile market conditions. Reduced operational costs Companies (big or small) that want to reduce costs from running a data center will find that moving to the cloud is extremely cost-effective. Cloud computing eliminates the high cost of hardware, IT resources and maintaining internal and on-premise data systems. Cloud-based solutions can also help organizations modernize their IT infrastructures and automate their processes. By migrating to the cloud, companies will be able to save substantial capital costs and see a higher return on investment – while maintaining efficiency. Faster deployment With the cloud, companies get the ability to deploy and launch programs and applications quickly and seamlessly. Programs can be deployed in days as opposed to weeks – so that businesses can operate faster and more efficiently than ever. During a pandemic, faster deployment speeds can help organizations accommodate, make updates to software and pivot quickly to changing market conditions. Flexible, scalable, and cost-effective solutions will be the keys to thriving during and after a pandemic. That’s why we’ve enhanced a variety of our solutions to be cloud-based – to help your organization adapt to today’s changing customer needs. Solutions like our Attribute Toolbox are now officially on the cloud, to help your organizations make better, faster, and more effective decisions. Learn More

This is the fourth in a series of blog posts highlighting optimization, artificial intelligence, predictive analytics, and decisioning for lending operations in times of extreme uncertainty. The first post dealt with optimization under uncertainty, the second with predicting consumer payment behavior, and the third with validating consumer credit scores. This post describes some specific Experian solutions that are especially timely for lenders strategizing their response to the COVID Recession. Will the US economy recover from the pandemic recession? Certainly yes. When will the economy recover? There is a lot more uncertainty around that question. Many people are encouraged by positive indicators, such as the initial rebound of the stock market, a return of many of the jobs lost at the beginning of the pandemic, and a significant increase in housing starts. August’s retail spending and homebuilder confidence are very encouraging economic indicators. Other experts doubt that the “V-shaped” recovery can survive flare-ups of the virus in various parts of the US and the world, and are calling for a “W-shaped” recovery. Employment indicators are alarming: many people remain out of work, some job losses are permanent, and there are more initial jobless claims each week now than at the height of the Great Recession. Serious hurdles to economic recovery may remain until a vaccine is widely available: childcare, urban transportation, and global trade, for example. I’m encouraged by the resilience of many of our country’s consumer lenders. They are generally responding well to these challenges. If past recessions are a guide, some lenders will not survive these turbulent times. This time, many lenders—whether or not they have already adopted the CECL accounting standards—have been increasing allowances for their anticipated credit losses. At least one rating agency believes major banks are prepared to absorb those losses from earnings. The lenders who are most prepared for the eventual recovery will be those that make good decisions during these volatile times and take action to put themselves in the best position in anticipation of the recovery that will certainly follow. The best lenders are making smart investments now to be prepared to capitalize on future opportunities. Experian’s analytics and consulting experts are continuously improving our suite of solutions that help consumer lenders and others assess consumer behavior and respond quickly to the rapidly fluctuating market conditions as well as changing regulations and credit reporting practices. Our newly announced Economic Response and Recovery Suite includes the ABCD’s that lenders need to be resilient and competitive now and to prepare to thrive during the eventual recovery: A – Analytics. As I’ve written about in prior blog posts, data is a prerequisite to making good business decisions, but data alone is not enough. To make wise, insightful decisions, lenders need to use the most appropriate analytical techniques, whether that means more meaningful attributes, more predictive and compliant credit scores, more accurate and defensible loss forecasting solutions, or optimization systems that help develop strategies in a world where budgets, regulations, and other constraints are changing. For example, Experian has released a set of Spotlight 2020 Attributes that help consumer lenders create a positive experience for customers who have received an accommodation during the pandemic. In many cases motivated by the new race to improve customer experience online, and in other cases as a reaction to new and creative fraud schemes, some clients are using this period as an opportunity to explore or deploy ethical and explainable Artificial Intelligence. B – Business Intelligence. Credit bureaus like Experian are uniquely situated to understand the impact of the COVID recession on America’s consumers. With impact reports, dashboards, and custom business intelligence solutions, lenders are working during the recession to gain an even better understanding of their current and prospective customers. We’re helping many of them to proactively help consumers when they need it most. For example, lenders have turned to us to understand their customer’s payment hierarchy—which bills they pay first when times are tough. Our free COVID-19 US Business Risk Index helps make lending options available to the businesses who need them most. And we’ve armed lenders with recommendations for which of our pre-existing attributes and scores are most helpful during trying times. Additional reporting tools such as the Auto Market Tracker, Ascend Market Insights Dashboard, and the weekly economic update video provide businesses with information on new market trends—information that helps them respond during the recession and promises to help them grow during the eventual recovery. C – Consulting. It’s good to turn data into information and information into insight, but how do these lenders incorporate these insights in their business strategies? Lenders and other businesses have been turning to Experian’s analytics and Advisory services consultants to unlock the information hidden in credit and other data sources—finding ways to make their business processes more efficient and more effective while developing quick response plans and more long-term recovery strategies. D – Delivery. Decision science is the practice of using advanced analytics, artificial intelligence, and other techniques to determine the best decision based on available data and resources. But putting those decisions into action can be a challenge. (Organizations like IBM and Gartner estimate that a great majority of data science projects are never put into production.) Experian technologies—from our analytics platform to our attribute integration and decision management solutions ensure that data-driven decisions can be quickly implemented to make a real difference. Treating each customer optimally has a number of benefits—whether you are trying to responsibly grow your portfolio, reduce credit losses and allowances, control servicing costs, or simply staying in compliance during dynamic times. In the age of COVID, IT departments have placed increased priority on agility, security, customer experience, and cost control, and appreciate cloud-first approach to deploying analytics. It’s too early to know how long this period of extreme uncertainty will last. But one thing is certain: it will come to an end, and the economy will recover someday. I predict that many of the companies that make the best use of data now will be the ones who do the best during the recovery. To hear more ways your organization can navigate this downturn and the recovery to follow, please watch our on-demand webinar and check out our Economic Response and Recovery Suite. Watch the Webinar
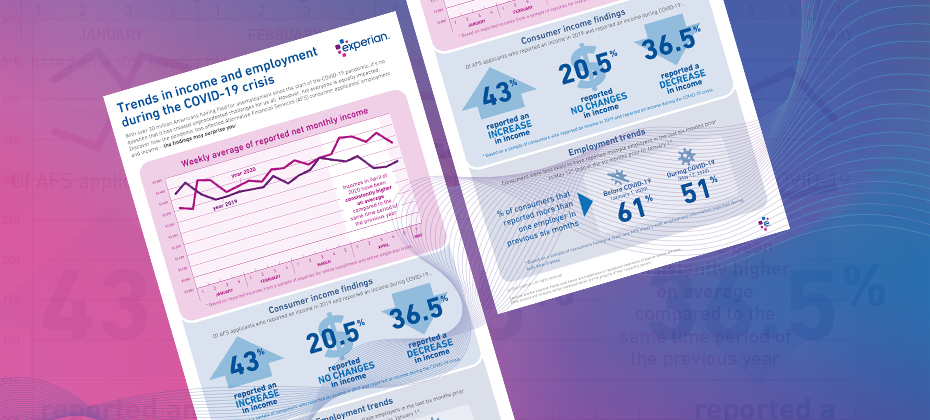
With many individuals finding themselves in increasingly vulnerable positions due to COVID-19, lenders must refine their policies based on their consumers’ current financial situations. Alternative Financial Services (AFS) data helps you gain a more comprehensive view of today's consumer. The COVID-19 pandemic has had far-reaching economic consequences, leading to drastic changes in consumers’ financial habits and behavior. When it comes to your consumers, are you seeing the full picture? See if you qualify for a complimentary hit rate analysis Download AFS Trends Report

This is the third in a series of blog posts highlighting optimization, artificial intelligence, predictive analytics, and decisioning for lending operations in times of extreme uncertainty. The first post dealt with optimization under uncertainty and the second with predicting consumer payment behavior. In this post I will discuss how well credit scores will work for consumer lenders during and after the COVID-19 crisis and offer some recommendations for what lenders can be doing to measure and manage that model risk in a time like this. Perhaps no analytics innovation has created opportunity for more individuals than the credit score has. The first commercially available credit score was developed by MDS (now part of Experian) in 1987. Soon afterwards FICO® popularized the use of scores that evaluate the risk that a consumer would default on a loan. Prior to that, lending decisions were made by loan officers largely on the basis on their personal familiarity with credit applicants. Using data and analytics to assess risk not only created economic opportunity for millions of borrowers, but it also greatly improved the financial soundness of lending institutions worldwide. Predictive models such as credit scores have become the most critical tools for consumer lending businesses. They determine, among other things, who gets a loan and at what price and how an account such as a credit line is managed through its life cycle. Predictive models are in many cases critical for calculating loan and loss reserves, for stress testing, and for complying with accounting standards. Nearly all lenders rely on generic scores such as the FICO® score and VantageScore® credit score. Most larger companies also have a portfolio of custom scorecards that better predict particular aspects of payment behavior for the customers of interest. So how well are these scorecards likely to perform during and after the current pandemic? The models need to predict consumer credit risk even as: Nearly all consumers change their behaviors in response to the health crisis, Millions of people—in America and internationally—find their income suddenly reduced, and Consumers receive large numbers of accommodations from creditors, who have in turn temporarily changed some of their credit reporting practices in response to guidelines in the federal CARES Act. In an earlier post, I pointed out that there is good reason to believe that credit scores will tend to continue to rank order consumers from most likely to least likely to repay their debts even as we move from the longest economic expansion in history to a period of unforeseen and unexpected challenges. But the interpretation of the score (for example, the log odds or the bad rate) may need to be adjusted. Furthermore, that assumes that the model was working well on a lender’s population before this crisis started. If it has been a long time since a scorecard was validated, that assumption needs to be questioned. Because experts are considering several different scenarios regarding both the immediate and long-term economic impacts of COVID-19, it’s important to have a plan for ongoing monitoring as long as necessary. Some lenders have strong Model Risk Management (MRM) teams complying with requirements from the Federal Reserve, Federal Deposit Insurance Corporation (FDIC), the Office of the Comptroller of the Currency (OCC). Those resources are now stretched thin. Other institutions, with fewer resources for MRM, are now discovering gaps in their model inventories as they implement operational changes. In either case, now’s the time to reassess how well scorecards are working. Good model validation practices are especially critical now if lenders are to continue to make the sound data-driven decisions that promote fairness for consumers and financial soundness for the institution. If you’re a credit risk manager responsible for the generic or custom models driving your lending, servicing, or capital allocation policies, there are several things you can do--starting now--to be sure that your organization can continue to make fair and sound lending decisions throughout this volatile period: Assess your model inventory. Do you have good documentation showing when each of the models in your organization was built? When was it last validated? Assign a level of criticality to each model in use. Starting with your most critical models, perform a baseline validation to determine how the model was performing prior to the global health crisis. It may be prudent to conduct not only your routine validation (verifying that the model was continuing to perform at the beginning of the period) but also a baseline validation with a shortened performance window (such as 6-12 months). That baseline validation will be useful if the downturn becomes a protracted one—in which case your scorecard models should be validated more frequently than usual. A shorter outcome window will allow a timelier assessment of the relationship between the score and the bad rate—which will help you update your lending and servicing policies to prevent losses. Determine if any of your scorecards had deteriorated even before the global pandemic. Consider recalibrating or rebuilding those scorecards. (Use metrics such as the Population Stability Index, the K-S statistic and the Gini Coefficient to help with that decision.) Many lenders chose not to prioritize rebuilding their behavioral scorecards for account management or collections during the longest period of economic growth in memory. Those models may soon be among the most critical models in your organization as you work to maintain the trust of your accountholders while also maintaining your institution’s financial soundness. Once the CARES accommodation period has expired, it will be important to revalidate your models more frequently than in the past—for as long as it takes until consumer behavior normalizes and the economy finds its footing. When you find it appropriate to rebuild a scorecard model, consider whether now is the time to implement ethical and explainable AI. Some of our clients are finding that Machine Learned models are more predictive than traditional scorecards. Early Experian research using data from the last recession indicates this will continue to be true for the foreseeable future. Furthermore, Experian has invested in Research and Development to help these clients deliver FCRA-compliant Adverse Action reasons to their consumers and to make the models explainable and transparent for model risk governance and compliance purposes. The sudden economic volatility that has resulted from this global health crisis has been a shock to all organizations. It is important for lenders to take the pulse of their predictive models now and throughout the downturn. They are especially critical tools for making sound data-driven business decisions until the economy is less volatile. Experian is committed to helping your organization during times of uncertainty. For more resources, visit our Look Ahead 2020 Hub. Learn more

As financial institutions and other organizations scramble to formulate crisis response plans, it’s important to consider the power of data and analytics. Jim Bander, PhD, Experian’s Analytics and Optimization Market Lead discusses the ways that data, analytics and models can help during a crisis. Check out what he had to say: What implications does the global pandemic have on financial institutions’ analytical needs? JB: COVID-19 is a humanitarian crisis, one that parallels Hurricanes Sandy and Katrina and other natural disasters but which far exceeds their magnitude. It is difficult to predict the impact as huge parts of the global economy have shut down. Another dimension of this disaster is the financial impact: in the US alone, more than 17 million people applied for unemployment in the first 6 weeks of the COVID-19 crisis. That compares to 15 million people in 18 months during the Great Recession. Data and analytics are more important than ever as financial institutions formulate their responses to this crisis. Those institutions need to focus on three key things: safety, soundness, and compliance. Safety: Financial institutions are taking immediate action to mitigate safety risks for their employees and their customers. Soundness: Organizations need to mitigate credit and fraud risk and to evaluate capital and liquidity. Some executives may need a better understanding of how their bank’s stress scenarios were calculated in the past to understand how they must be updated for the future. Important analytic functions include performing portfolio monitoring and benchmarking—quantifying the effects not only of consumer distress, but also of low interest rates. Compliance: Understanding and meeting complex regulatory and compliance requirements is crucial at this time. Companies have to adapt to new credit reporting guidelines. CECL requirements have been relaxed but lenders should assess the effects of COVID, and not only during their annual stress tests. As more consumers seek credit, from an analytics perspective, what considerations should financial institutions make during this time? JB: During this volatile time, analytics will help financial institutions: Identify financially stressed consumers with early warning indicators Predict future consumer behavior Respond quickly to changes Deliver the best treatments at the right time for individual customers given their specific situations and their specific behavior. Financial institutions should be reevaluating where their organizations have the most vulnerability and should be taking immediate action to mitigate these risks. Some important areas to keep an eye on include early warning indicators, changes in fraudulent behavior (with the increase in digital engagements), and changes in customer behavior. Banks are already offering payment flexibility, deferments, and credit reporting accommodations. If volatility continues or increases, they may need to offer debt forgiveness plans. These organizations should also be prepared to understand their own changing constraints—such as budget, staffing levels, and liquidity requirements— especially as consumers accelerate their move to digital channels. In the near future, lenders should be optimizing their operations, servicing treatments, and lending policies to meet a number of possibly conflicting objectives in the presence of changing constraints and somewhat unpredictable transaction volumes. What is the smartest next play for financial institutions? JB: I see our smartest clients doing four things: Adapting to the new normal Maintaining engagement with existing customers by refreshing data that companies have on-hand for these consumers, and obtain additional views of these customers for analytics and data-driven decisioning Reallocating operational resources and anticipating the need for increased capacity in various servicing departments in the future Improving their risk management practices What is Experian doing to help clients improve their risk management? JB: During this time, banks and other financial institutions are searching for ways to predict consumer behavior, especially during a crisis that combines aspects of a natural disaster with characteristics of a global recession. It is more important than ever to use analytics and optimization. But some of the details of the methodology is different now than during a time of economic expansion. For example, while credit scores (like FICO® and VantageScore® credit scores) will continue to rank consumers in terms of their probability to pay, those scores must be interpreted differently. Furthermore, those scores should be combined with other views of the consumer—such as trends in consumer behavior and with expanded FCRA-compliant data (data that isn’t reported to traditional credit bureaus). One way we’re helping clients improve their credit risk management is to provide them with a list of 140 consumer credit data attributes in 10 categories. With this list, companies will be able to better manage portfolio risk, to better understand consumer behavior, and to select the next best action for each consumer. Four other things we’re doing: We’re quickly updating our loss forecasting and liquidity management offerings to account for new stress scenarios. We’re helping clients review their statistical models’ performance and their customer segmentation practices, and helping to update the models that need refreshing. Our consulting team—Experian Advisory Services—has been meeting with clients virtually--helping them update, execute their crisis and downturn responses, and whiteboard new or updated tactical plans. Last but not least, we’re helping lenders and consumers defend themselves against a variety of fraud and identity theft schemes. Experian is committed to helping your organization during these uncertain times. For more resources, visit our Look Ahead 2020 Hub. Learn more Jim Bander, PhD, Analytics and Optimization Market Lead, Decision Analytics, Experian North America Jim Bander, PhD joined Experian in April 2018 and is responsible for solutions and value propositions applying analytics for financial institutions and other Experian business-to-business clients throughout North America. Jim has over 20 years of analytics, software, engineering and risk management experience across a variety of industries and disciplines. He has applied decision science to many industries including banking, transportation and the public sector. He is a consultant and frequent speaker on topics ranging from artificial intelligence and machine learning to debt management and recession readiness. Prior to joining Experian, he led the Decision Sciences team in the Risk Management department at Toyota Financial Services.

This is the first to a series of blog posts highlighting optimization, artificial intelligence, predictive analytics, and decisioning for lending operations in times of extreme uncertainty. Like all businesses, lenders are facing tremendous change and uncertainty in the face of the COVID-19 crisis. While focusing first on how to keep their employees and customers safe during the new normal, they are asking how to make data-driven decisions in this new environment. It’s only natural that business people are skeptical about whether analytics will work in a situation like today's – in which the data deviate from all historical precedents. Certainly, nobody predicted, for example, that the number of loans with forbearance requests would increase by over 1000% during each two-week period in March. Can anyone possibly make an optimized decision when things are changing so quickly and when so many things are unknown? Prescriptive analytics – also known as mathematical optimization – is the practice of developing a business strategy to achieve a business objective subject to capacity and other constraints, often using a demand forecast. For example, banks use optimization software to develop marketing and debt management strategies to run their lending operations. But what happens when the demand forecast might be wrong, when the constraints change quickly, and when decision-makers cannot agree on a single objective? The reality is that decisionmakers have to balance multiple competing objectives related to many different stakeholders. And, especially during the COVID-19 crisis and the period of change that will certainly follow, they have to do so in the face of uncertainty. Let's discuss some of the methods that analysts use to control risk while optimizing lending practices during times like these. These techniques, collectively known as robust optimization and robust statistics, help lenders and other business people deal with the uncomfortable reality that we do not know what the future holds. Consider a hypothetical bank or other lender servicing a portfolio of consumer loans and forecasting its loss performance in this environment. Management probably has several competing objectives: they want to improve service levels on their digital channel, they want to minimize credit and fraud losses, they're facing a reduced operating budget, and they're not certain how many employees they will have and which vendors will be able to provide adequate service levels. Furthermore, they anticipate new and unpredicted changes, and they need to be able to update their strategies quickly. The mathematics can be quite technical, but Experian’s Marketswitch Optimization is user-friendly software to help businesspeople--not engineers--design and deploy optimal strategies for practices such as Account Management and Loan Originations while facing such a dynamic and uncertain environment. The bank's business analysts (not computer specialists or mathematicians) will use techniques such as these: With Sensitivity Analysis, the analysts will explore the performance of their optimized Account Management, Collections, and Loan Originations strategies while considering possible changes in input variables. Optimization Scenarios with Uncertainty (technically known as Stochastic Optimization) allow the managers and analysts to design operational strategies that control risk, particularly the bank’s exposure to probabilistic and worst-case scenarios. Using Scenario Performance Analysis, the lender's team will validate and test their optimization scenarios against a variety of different data sets to understand how their strategies would perform in each case. Model Quality Evaluation techniques help the credit risk managers compare model predictions against actual performance during a quickly changing economy. Model impact analysis (related to Model Risk Management) helps senior leadership assess when it is time to invest in improving its statistical models. Robust Model Calibration Analysis removes unjustifiable variations in the lender's predictive models to make their predictions more valid as things change over time. These six advanced analytics techniques are especially helpful when developing business strategies for a time in which some values are unknown—including future unemployment levels, staffing budgets, data reporting practices, interest rates, and customer demands. Business decisions can—and arguably must—be optimized during times of uncertainty. But during times like these, it is especially important that the analysts understand how and why to account for the uncertainty in both the data and the models. Lenders, are you optimizing your servicing and debt management strategies? It has never been more important than now to do so--using the advanced techniques available to manage uncertainty mathematically. Learn more about how Marketswitch can help you solve complex business problems and meet organizational objectives. Learn more

For financial marketers, long gone are the days of branded coffee mugs, teddy bears and the occasional print ad. Financial marketers are charged with customizing messaging and offerings at a customer level, increasing conversion rates, and moving beyond digital while keeping an eye on traditional channels. Additionally, financial marketing teams are having to do it all with less; according to CMO Survey, marketing budgets have remained stagnant for the last 6 years. Accordingly, competing in today’s world requires transforming your organization to address rapidly increasing complexity while containing costs. Here are four tactics leading-edge firms are using to respond to changes in the market and better serve customers. More data, fewer problems Financial institutions ingest a mind-boggling variety of data, transaction details, transaction history, credit scores, customer preferences, etc. It can be difficult to know where to start or what to do with what is often terabytes of data. But the savviest teams are mining their unique data, along with bureau data, and other alternative and third-party data for rich decision making that drives differentiation. Getting analytical In financial institutions, advanced analytics has traditionally lived with lenders, underwriters, risk and fraud, departments, etc. But marketers too can find the value in the volume, velocity and variety of new data sources available to financial institutions. Using advanced analytics allows the most forward-thinking financial marketers to better target customers, personalize experiences, respond in near-real-time or even predict actions, and measure the impact of marketing investments. Customized quality time with customers Thanks to the likes of Google and Amazon, consumers have become accustomed to individualized interactions with firms they utilize. And this desire is just as present when it comes to their financial institution. But banks, credit unions and fintechs have been historically slow to respond. According to a recent Capgemini study, 70% of US consumers feel like their financial institution doesn’t understand their needs. The most dynamic financial marketing teams tailor quality experiences that increase consumer engagement and long-term relationships. All the channels, all the time The financial marketer’s job doesn’t stop at creating bespoke experiences for customers. Firms are also having to leverage an omnichannel approach to reach these clients, across an ever-growing number of channels and touchpoints. If that wasn’t enough, campaign cycles are shortening to match consumers changing demands and need for instant gratification—again, thanks Amazon. But the best teams determine which media or interaction resonates most effectively with clients, whether face-to-face, via an app, chatbot, or social media and have conversations across all of them seamlessly. It’s clear, financial firms must transform their approach to address increasing market complexity without increasing costs. Financial marketers are saddled with stagnant marketing budgets, proliferating media channels and shorter campaign cycles, with an expectation to continue delivering results. It’s a very tall order, especially if your financial institution is not leveraging data, analytics and insights as the differentiators they could be. CMOs and their marketing teams must invest in new technologies, strategies and data sources that best reflect the expectations of their customers. How is your bank or credit union responding to these financial marketing challenges? Watch our 2020 Credit Marketing Trends On-Demand Webinar

Do you have 20/20 vision when it comes to the readiness of your organization? How financially healthy are your customers today? They are likely facing some challenges and difficult choices. Based on a study by the Center for Financial Services Innovation (CFSI), almost half of the US adult population - that’s 112.5 million - say they do not have enough savings to cover at least three months of living expenses. With debt rising and a possible recession on the horizon, it’s crucial to have a solid strategy in place for your organization. Here are three easy steps to help you prepare: Anticipate the recession before it arrives Gathering a complete view of your customers can be difficult if you have multiple systems, which can result in subjective, costly and inefficient processes. If you don’t have a full picture of your customers, it’s hard to understand their risk, behavior and ability to pay and to determine the most effective treatment decisions. Having the right data is only the first step. Using analytics to make sense of the data helps you better understand your customers at an individual level, which will increase recovery rates and improve the customer experience. Analytics can provide early-warning indicators that identify customers most likely to miss payments, predict future behavior, and deliver the best treatment option based on a customer’s specific situation or behavior. With a deeper understanding of at-risk customers, you can apply more targeted interventions that are specific to each customer, so you can be confident your collections process is individualized, efficient and fair. The result? A cost-effective, compliant process focused on retaining valuable customers and reducing losses. What to look for: ✔ Know when customers are experiencing negative credit events ✔ View consumer credit trends that may not yet be visible on your own account base ✔ Watch for payment stress – understand the actual payment consumers are making. Is it changing? ✔ See individual trends and take action – are your customers sliding down to a lower score band? ✔ Understand how your client-base is performing within your own portfolio and with other organizations Take immediate and impactful actions around risk mitigation and staffing Every interaction with consumers needs optimizing, from target marketing through to collections and recovery. Organizations that proactively modernize their business to scale and increase effectiveness before the next economic downturn may avoid struggling to address rising delinquencies when the economy corrects itself. This may improve portfolio performance and collection capabilities — significantly increasing recoveries, containing costs and sustaining returns. Identify underperforming products and inefficient processes by staff. Consider reassessing the data used and the manual processes required for making decisions. Optimize product pricing and areas where organizations or staff could automate the decision processes. Areas to focus: ✔ Identity theft protection and account takeover awareness ✔ Improve underwriting strategy and automation ✔ Maximize profitability — drive spend, optimize approvals, line assignment and pricing ✔ Evaluate collection risk strategies and operational efficiencies Design and deploy a strategy to be organizationally and technologically ready for change Communication is key in debt recovery. Failing to contact customers via their preferred channel can cause frustration and reduce the likelihood of recovery. Your customers are looking for a convenient and discreet way to negotiate or repay debt, and if you aren’t providing one, you’re incurring higher collections costs and lower recovery rates. With developments in the digital world, consumer interactions have changed. Most people prefer to communicate via mobile or online, with little to no human interaction. Behavioral analytics help to automate and decide the next best action, so you contact the right customer at the right time through the right channel. In addition, offering a convenient, discreet way to negotiate or repay debt can result in customers who are more engaged and more likely to pay. Online and self-service portals along with AI-powered chatbots use the latest technology to provide a safe and customer-centric experience, creating less time-consuming interactions and higher customer satisfaction. Your digital collections process is more convenient and less stressful for consumers and more profitable and compliant for you. Visualize the future... ✔ Superior customer service is embraced at the end of the customer life cycle as it is in the beginning ✔ Leverage data, analytics, software, and industry expertise to drive an automated collections process with fewer manual interventions ✔ Meet the growing expectation for digital consumer self-service by providing the ability to proactively negotiate and manage debt through preferred contact channels ✔ When economy and market conditions change for the worst, have the right data, analytics, software in place and be prepared to implement relevant collections strategies to remain competitive in the market Don’t wait until the next recession hits. Our collaborative approach to problem solving ensures you have the right solution in place to solve your most complex problems and are ready for market changes. The combination of our data, analytics, fraud tools, decisioning software and consulting services will help you proactively manage your portfolio to minimize the flow of accounts into collections and modernize your collections and recovery processes. Learn More

In today’s ever-changing and hypercompetitive environment, the customer experience has taken center-stage – highlighting new expectations in the ways businesses interact with their customers. But studies show financial institutions are falling short. In fact, a recent study revealed that 94% of banking firms can’t deliver on the “personalization promise.” It’s not difficult to see why. Consumer preferences have changed, with many now preferring digital interactions. This has made it difficult for financial institutions to engage with consumers on a personal level. Nevertheless, customers expect seamless, consistent, and personalized experiences – that’s where the power of advanced analytics comes into play. It’s no secret that using advanced analytics can enable businesses to turn rich data into insights that lead to confident business decisions and strategy development. But these business tools can actually help financial institutions deliver on that promise of personalization. According to an Experian study, 90% of organizations say that embracing advanced analytics is critical to their ability to provide an excellent customer experience. By using data and analytics to anticipate and respond to customer behavior, companies can develop new and creative ways to cater to their audiences – revolutionizing the customer experience as a whole. It All Starts With Data Data is the foundation for a successful digital transformation – the lack of clean and cohesive datasets can hinder the ability to implement advanced analytic capabilities. However, 89% of organizations face challenges on how to effectively manage and consolidate their data, according to Experian’s Global Data Management Research Benchmark Report of 2019. Because consumers prefer digital interactions, companies have been able to gather a vast amount of customer data. Technology that uses advanced analytic capabilities (like machine learning and artificial intelligence) are capable of uncovering patterns in this data that may not otherwise be apparent, therefore opening doors to new avenues for companies to generate revenue. To start, companies need a strategy to access all customer data from all channels in a cohesive ecosystem – including data from their own data warehouses and a variety of different data sources. Depending on their needs, the data elements can come from a third party data provider such as: a credit bureau, alternative data, marketing data, data gathered during each customer contact, survey data and more. Once compiled, companies can achieve a more holistic and single view of their customer. With this single view, companies will be able to deliver more relevant and tailored experiences that are in-line with rising customer expectations. From Personalized Experiences to Predicting the Future The most progressive financial institutions have found that using analytics and machine learning to conquer the wide variety of customer data has made it easier to master the customer experience. With advanced analytics, these companies gain deeper insights into their customers and deliver highly relevant and beneficial offers based on the holistic views of their customers. When data is provided, technology with advanced analytic capabilities can transform this information into intelligent outputs, allowing companies to optimize and automate business processes with the customer in mind. Data, analytics and automation are the keys to delivering better customer experiences. Analytics is the process of converting data into actionable information so firms can understand their customers and take decisive action. By leveraging this business intelligence, companies can quickly adapt to consumer demand. Predictive models and forecasts, increasingly powered by machine learning, help lenders and other businesses understand risks and predict future trends and consumer responses. Prescriptive analytics help offer the right products to the right customer at the right time and price. By mastering all of these, businesses can be wherever their customers are. The Experian Advantage With insights into over 270 million customers and a wealth of traditional credit and alternative data, we’re able to drive prescriptive solutions to solve your most complex market and portfolio problems across the customer lifecycle – while reinventing and maintaining an excellent customer experience. If your company is ready for an advanced analytical transformation, Experian can help get you there. Learn More

AI, machine learning, and Big Data – these are no longer just buzzwords. The advanced analytics techniques and analytics-based tools that are available to financial institutions today are powerful but underutilized. And the 30% of banks, credit unions and fintechs successfully deploying them are driving better data-driven decisions, more positive customer experiences and stronger profitability. As the opportunities surrounding advanced analytics continue to grow, more lenders are eager to adopt these capabilities to make the most of their datasets. And it’s understandable that financial institution are excited at the possibilities and insights that advanced analytics can bring to their business. However, there are some key considerations to keep in mind as you begin this important digital transformation. Here are three things you should do as your financial institution begins its advanced analytics journey. Ensure consistent and clean data quality Companies have a plethora of data and information on their customers. The main hurdles that many organizations face is being able to turn this information into a clean and cohesive dataset and formulating an effective and long-term data management strategy. Trying to implement advanced analytic capabilities while lacking an effective data governance strategy is like building a house on a poor foundation – likely to fail. Data quality issues, such as inconsistent data, data gaps, and incomplete and duplicated data, also haunt many organizations, making it difficult to complete their analytics objectives. Ensuring that issues in data quality are managed is the key to gaining the correct insights for your business. Establish and maintain a single view of customers The power of advanced analytics can only be as strong as the data provided. Unfortunately, many companies don’t realize that advanced analytics is much more powerful when companies are able to establish a single view of their customers. Companies need to establish and maintain a single view of customers in order to begin implementing advanced analytic capabilities. According to Experian research, a single customer view is a consistent, accurate and holistic view of your organization’s customers, prospects, and their data. Having full visibility and a 360 view into your customers paves the way for companies to make personalized, relevant, timely and precise decisions. But as many companies have begun to realize, getting this single view of customers is easier said than done. Organizations need to make sure that data should always be up-to-date, unique and available in order to begin a complete digital transformation. Ensure the right resources and commitment for your advanced analytics initiative It’s important to have the top-down commitment within your organization for advanced analytics. From the C-suite down, everyone should be on the same page as to the value analytics will bring and the investment the project might require. Organizations that want to move forward with implementing advanced analytic capabilities need to make sure to set aside the right financial and human resources that will be needed for the journey. This may seem daunting, but it doesn’t have to be. A common myth is that the costs of new hardware, new hires and the costs required to maintain, configure, and set up new technology will make advanced analytics implementation far too expensive and difficult to maintain. However, many organizations don’t realize that it’s not necessary to allocate large capital expenses to implement advanced analytics. All it takes is finding the right-sized solution with configurations to fit the team size and skill level in your organization. Moreover, finding the right partner and team (whether internal or external) can be an efficient way to fill temporary skills gaps on your team. No digital transformation initiative is without its challenges. However, beginning your advanced analytics journey on the right footing can deliver unparalleled growth, profitability and opportunities. Still not sure where to begin? At Experian, we offer a wide range of solutions to help you harness the full power and potential of data and analytics. Our consultants and development teams have been a game-changer for financial institutions, helping them get more value, insight and profitability out of their data and modeling than ever before. Learn More

Retailers are already starting to display their Christmas decorations in stores and it’s only early November. Some might think they are putting the cart ahead of the horse, but as I see this happening, I’m reminded of the quote by the New York Yankee’s Yogi Berra who famously said, “It gets late early out there.” It may never be too early to get ready for the next big thing, especially when what’s coming might set the course for years to come. As 2019 comes to an end and we prepare for the excitement and challenges of a new decade, the same can be true for all of us working in the lending and credit space, especially when it comes to how we will approach the use of alternative data in the next decade. Over the last year, alternative data has been a hot topic of discussion. If you typed “alternative data and credit” into a Google search today, you would get more than 200 million results. That’s a lot of conversations, but while nearly everyone seems to be talking about alternative data, we may not have a clear view of how alternative data will be used in the credit economy. How we approach the use of alternative data in the coming decade is going to be one of the most important decisions the lending industry makes. Inaction is not an option, and the time for testing new approaches is starting to run out – as Yogi said, it’s getting late early. And here’s why: millennials. We already know that millennials tend to make up a significant percentage of consumers with so-called “thin-file” credit reports. They “grew up” during the Great Recession and that has had a profound impact on their financial behavior. Unlike their parents, they tend to have only one or two credit cards, they keep a majority of their savings in cash and, in general, they distrust financial institutions. However, they currently account for more than 21 percent of discretionary spend in the U.S. economy, and that percentage is going to expand exponentially in the coming decade. The recession fundamentally changed how lending happens, resulting in more regulation and a snowball effect of other economic challenges. As a result, millennials must work harder to catch up financially and are putting off major life milestones that past generations have historically done earlier in life, such as homeownership. They more often choose to rent and, while they pay their bills, rent and other factors such as utility and phone bill payments are traditionally not calculated in credit scores, ultimately leaving this generation thin-filed or worse, credit invisible. This is not a sustainable scenario as we enter the next decade. One of the biggest market dynamics we can expect to see over the next decade is consumer control. Consumers, especially millennials, want to be in the driver’s seat of their “credit journey” and play an active role in improving their financial situations. We are seeing a greater openness to providing data, which in turn enables lenders to make more informed decisions. This change is disrupting the status quo and bringing new, innovative solutions to the table. At Experian, we have been testing how advanced analytics and machine learning can help accelerate the use of alternative data in credit and lending decisions. And we continue to work to make the process of analyzing this data as simple as possible, making it available to all lenders in all verticals. To help credit invisible and thin-file consumers gain access to fair and affordable credit, we’ve recently announced Experian Lift, a new suite of credit score products that combines exclusive traditional credit, alternative credit and trended data assets to create a more holistic picture of consumer creditworthiness that will be available to lenders in early 2020. This new Experian credit score may improve access to credit for more than 40 million credit invisibles. There are more than 100 million consumers who are restricted by the traditional scoring methods used today. Experian Lift is another step in our commitment to helping improve financial health of consumers everywhere and empowers lenders to identify consumers who may otherwise be excluded from the traditional credit ecosystem. This isn’t just a trend in the United States. Brazil is using positive data to help drive financial inclusion, as are others around the world. As I said, it’s getting late early. Things are moving fast. Already we are seeing technology companies playing a bigger role in the push for alternative data – often powered by fintech startups. At the same time, there also has been a strong uptick in tech companies entering the banking space. Have you signed up for your Apple credit card yet? It will take all of 15 seconds to apply, and that’s expected to continue over the next decade. All of this is changing how the lending and credit industry must approach decision making, while also creating real-time frictionless experiences that empower the consumer. We saw this with the launch of Experian Boost earlier this year. The results speak for themselves: hundreds of thousands of previously thin-file consumers have seen their credit scores instantly increase. We have also empowered millions of consumers to get more control of their credit by using Experian Boost to contribute new, positive phone, cable and utility payment histories. Through Experian Boost, we’re empowering consumers to play an active role in building their credit histories. And, with Experian Lift, we’re empowering lenders to identify consumers who may otherwise be excluded from the traditional credit ecosystem. That’s game-changing. Disruptions like Experian Boost and newly announced Experian Lift are going to define the coming decade in credit and lending. Our industry needs to be ready because while it may seem early, it’s getting late.

It seems like artificial intelligence (AI) has been scaring the general public for years – think Terminator and SkyNet. It’s been a topic that’s all the more confounding and downright worrisome to financial institutions. But for the 30% of financial institutions that have successfully deployed AI into their operations, according to Deloitte, the results have been anything but intimidating. Not only are they seeing improved performance but also a more enhanced, positive customer experience and ultimately strong financial returns. For the 70% of financial institutions who haven’t started, are just beginning their journey or are in the middle of implementing AI into their operations, the task can be daunting. AI, machine learning, deep learning, neural networks—what do they all mean? How do they apply to you and how can they be useful to your business? It’s important to demystify the technology and explain how it can present opportunities to the financial industry as a whole. While AI seems to have only crept into mainstream culture and business vernacular in the last decade, it was first coined by John McCarthy in 1956. A researcher at Dartmouth, McCarthy thought that any aspect of learning or intelligence could be taught to a machine. Broadly, AI can be defined as a machine’s ability to perform cognitive functions we associate with humans, i.e. interacting with an environment, perceiving, learning and solving problems. Machine learning vs. AI Machine learning is not the same thing as AI. Machine learning is the application of systems or algorithms to AI to complete various tasks or solve problems. Machine learning algorithms can process data inputs and new experiences to detect patterns and learn how to make the best predictions and recommendations based on that learning, without explicit programming or directives. Moreover, the algorithms can take that learning and adapt and evolve responses and recommendations based on new inputs to improve performance over time. These algorithms provide organizations with a more efficient path to leveraging advanced analytics. Descriptive, predictive, and prescriptive analytics vary in complexity, sophistication, and their resulting capability. In simplistic terms, descriptive algorithms describe what happened, predictive algorithms anticipate what will happen, and prescriptive algorithms can provide recommendations on what to do based on set goals. The last two are the focus of machine learning initiatives used today. Machine learning components - supervised, unsupervised and reinforcement learning Machine learning can be broken down further into three main categories, in order of complexity: supervised, unsupervised and reinforcement learning. As the name might suggest, supervised learning involves human interaction, where data is loaded and defined and the relationship to inputs and outputs is defined. The algorithm is trained to find the relationship of the input data to the output variable. Once it delivers accurately, training is complete, and the algorithm is then applied to new data. In financial services, supervised learning algorithms have a litany of uses, from predicting likelihood of loan repayment to detecting customer churn. With unsupervised learning, there is no human engagement or defined output variable. The algorithm takes the input data and structures it by grouping it based on similar characteristics or behaviors, without a defined output variable. Unsupervised learning models (like K-means and hierarchical clustering) can be used to better segment or group customers by common characteristics, i.e. age, annual income or card loyalty program. Reinforcement learning allows the algorithm more autonomy in the environment. The algorithm learns to perform a task, i.e. optimizing a credit portfolio strategy, by trying to maximize available rewards. It makes decisions and receives a reward if those actions bring the machine closer to achieving the total available rewards, i.e. the highest acquisition rate in a customer category. Over time, the algorithm optimizes itself by correcting actions for the best outcomes. Even more sophisticated, deep learning is a category of machine learning that involves much more complex architecture where software-based calculators (called neurons) are layered together in a network, called a neural network. This framework allows for much broader, complex data ingestion where each layer of the neural network can learn progressively more complex elements of the data. Object classification is a classic example, where the machine ‘learns’ what a duck looks like and then is able to automatically identify and group images of ducks. As you might imagine, deep learning models have proved to be much more efficient and accurate at facial and voice recognition than traditional machine learning methods. Whether your financial institution is already seeing the returns for its AI transformation or is one of the 61% of companies investing in this data initiative in 2019, having a clear picture of what is available and how it can impact your business is imperative. How do you see AI and machine learning impacting your customer acquisition, underwriting and overall customer experience?