Tag: credit trends

To provide consumers with clear-cut protections against disturbance by debt collectors, the Consumer Financial Protection Bureau (CFPB) issued a Notice of Proposed Rulemaking (NPRM) to implement the Fair Debt Collection Practices Act (FDCPA) earlier this year. Among many other things, the proposal would set strict limits on the number of calls debt collectors may place to reach consumers weekly and clarify requirements for consumer-facing debt collection disclosures. A bigger discussion Deliberation of the debt collection proposal was originally scheduled to begin on August 18, 2019. However, to allow commenters to further consider the issues raised in the NPRM and gather data, the comment period was extended by 20 days to September 18, 2019. It is currently still being debated, as many argue that the proposed rule does not account for modern consumer preferences and hinders the free flow of information used to help consumers access credit and services. The Association of Credit and Collection Professionals (ACA International) and US House lawmakers continue to challenge the proposal, stating that it doesn’t ensure that debt collectors’ calls to consumers are warranted, nor does it do enough to protect consumers’ privacy. Many consumer advocates have expressed doubts about how effective the proposed measures will be in protecting debtors from debt collector harassment and see the seven-calls-a-week limit on phone contact as being too high. In fact, it’s difficult to find a group of people in full support of the proposal, despite the CFPB stating that it will help clarify the FDCPA, protect lenders from litigation and bring consumer protection regulation into the 21st century. What does this mean? Although we don’t know when, or if, the proposed rule will go into effect, it’s important to prepare. According to the Federal Register, there are key ways that the new regulation would affect debt collection through the use of newer technologies, required disclosures and limited consumer contact. Not only will the proposed rules apply to debt collectors, but its provisions will also impact creditors and servicers, making it imperative for everyone in the financial services space to keep watch on the regulation’s status and carefully analyze its proposed rules. At Experian, our debt collection solutions automate and moderate dialogues and negotiations between consumers and collectors, making it easier for collection agencies to connect with consumers while staying compliant. Our best-in-class data and analytics will play a key role in helping you reach the right consumer, in the right place, at the right time. Learn more
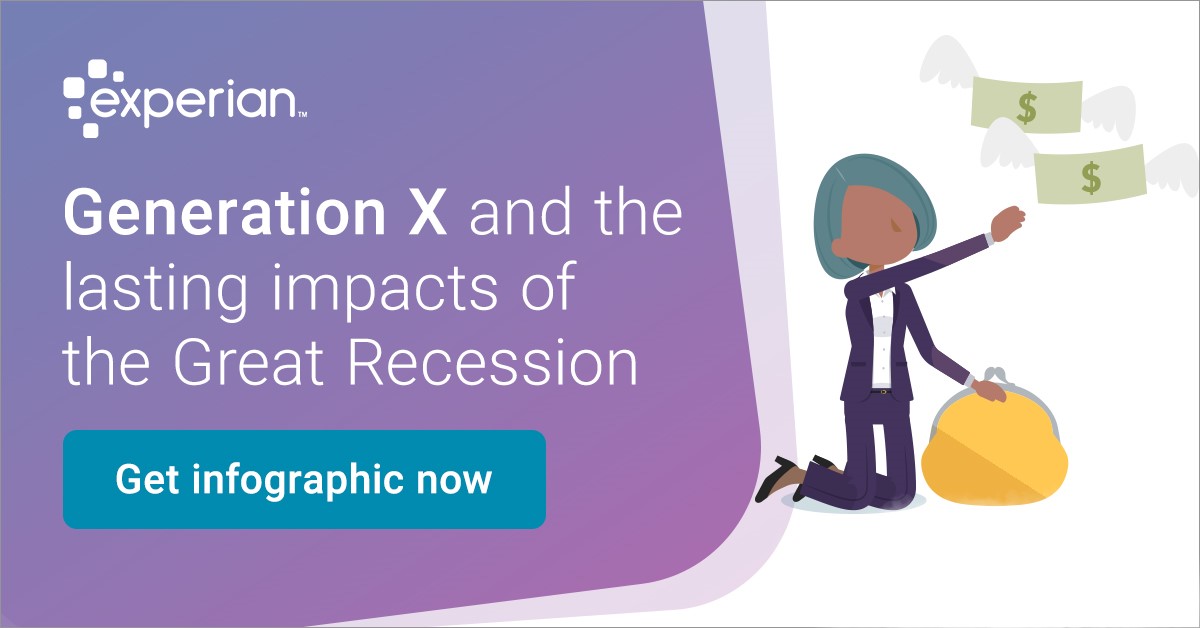
It's been over 10 years since the start of the Great Recession. However, its widespread effects are still felt today. While the country has rebounded in many ways, its economic damage continues to influence consumers. Discover the Great Recession’s impact across generations: Americans of all ages have felt the effects of the Great Recession, making it imperative to begin recession proofing and better prepare for the next economic downturn. There are several steps your organization can take to become recession resistant and help your customers overcome personal financial difficulties. Are you ready should the next recession hit? Get started today

What is CECL? CECL (Current Expected Credit Loss) is a new credit loss model, to be leveraged by financial institutions, that estimates the expected loss over the life of a loan by using historical information, current conditions and reasonable forecasts. According to AccountingToday, CECL is considered one of the most significant accounting changes in decades to affect entities that borrow and lend money. To comply with CECL by the assigned deadline, financial institutions will need to access much more data than they’re currently using to calculate their reserves under the incurred loss model, Allowance for Loan and Lease Losses (ALLL). How does it impact your business? CECL introduces uncertainty into accounting and growth calculations, as it represents a significant change in the way credit losses are currently estimated. The new standard allows financial institutions to calculate allowances in a variety of ways, including discounted cash flow, loss rates, roll-rates and probability of default analyses. “Large banks with historically good loss performance are projecting increased reserve requirements in the billions of dollars,” says Experian Advisory Services Senior Business Consultant, Gavin Harding. Here are a few changes that you should expect: Larger allowances will be required for most products As allowances will increase, pricing of the products will change to reflect higher capital cost Losses modeling will change, impacting both data collection and modeling methodology There will be a lower return on equity, especially in products with a longer life expectancy How can you prepare? “CECL compliance is a journey, rather than a destination,” says Gavin. “The key is to develop a thoughtful, data-driven approach that is tested and refined over time.” Financial institutions who start preparing for CECL now will ultimately set their organizations up for success. Here are a few ways to begin to assess your readiness: Create a roadmap and initiative prioritization plan Calculate the impact of CECL on your bottom line Run altered scenarios based on new lending policy and credit decision rules Understand the impact CECL will have on your profitability Evaluate current portfolios based on CECL methodology Run different loss methods and compare results Additionally, there is required data to capture, including quarterly or monthly loan-level account performance metrics, multiple year data based on loan product type and historical data for the life of the loan. How much time do you have? Like most accounting standards, CECL has different effective dates based on the type of reporting entity. Public business entities that file financial statements with the Security and Exchange Commission will have to comply by 2020, non-public entity banks must comply by 2022 and non-SEC registered companies have until 2023 to adopt the new standard. How can we help: Complying with CECL may require you to gather, store and calculate more data than before. Experian can help you comply with CECL guidelines including data needs, consulting and loan loss calculation. Experian industry experts will help update your current strategies and establish an appropriate timeline to meet compliance dates. Leveraging our best-in-class industry data, we will help you gain CECL compliance quickly and effectively, understand the impacts to your business and use these findings to improve overall profitability. Learn more
Consumer credit trends are continuously changing, making it imperative to keep up with the latest developments in originations, delinquencies on mortgages, credit cards and auto loans. By monitoring consumer behavior and market trends over time, you can predict and prepare for potential issues within each market. In this 30-minute webinar, our featured speakers, Gavin Harding, Experian Senior Business Consultant, and Alan Ikemura, Experian Data Analytics Senior Product Manager, reveal Q1 2019 market intelligence data and explore recent advances in consumer credit trends. Watch our on-demand webinar

Millions of consumers lack credit history and/or have difficulty obtaining credit from mainstream financial institutions. To ease access to credit for “invisible” and below prime consumers, financial institutions have sought ways to both extend and improve the methods by which they evaluate borrowers’ risk. This initiative to effectively score more consumers has involved the use of alternative credit data.1 Alternative credit data is FCRA-compliant data that is typically not included in a traditional credit report and is used to deliver a more complete view into a consumer’s creditworthiness. “Alternative credit data helps us paint a fuller picture of a consumer so they can get better access to the financial services they need and deserve,” said Alpa Lally, Vice President of Data Business at Experian. Experian recently sponsored the FinovateSpring conference in San Francisco, where Alpa had a chance to sit down with Jacob Gaffney, Editor-in-Chief of the HousingWire News Podcast, to discuss ways consumers can improve their credit scores. As an immigrant, Alpa spoke personally about the impact of having a limited credit history and how alternative credit data can help drive greater access to credit for consumers and profitable growth for lenders through more informed lending decisions. Highlights include: How alternative and traditional credit data differ Types of alternative credit data being used by lenders How “credit-invisibles” can best leverage alternative credit data Alternative credit data product solutions, including Experian BoostTM Listen now 1When we refer to “Alternative Credit Data,” this refers to the use of alternative data and its appropriate use in consumer credit lending decisions, as regulated by the Fair Credit Reporting Act. Hence, the term “Expanded FCRA Data” may also apply in this instance and both can be used interchangeably.

2019 is here — with new technology, new regulations and new opportunities on the docket. What does that mean for the financial services space? Here are the five trends you should keep your eye on and how these affect your credit universe. 1. Credit access is at an all-time high With 121 million Americans categorized as credit-challenged (subprime scores and a thin or nonexistent credit file) and 45 million considered credit-invisible (no credit history), the credit access many consumers take for granted has appeared elusive to others. Until now. The recent launch of Experian BoostTM empowers consumers to improve their credit instantly using payment history from their utility and phone bills, giving them more control over their credit scores and making them more visible to lenders and financial institutions. This means more opportunities for more people. Coupled with alternative credit data, which includes alternative financial services data, rental payments, and full-file public records, lenders and financial institutions can see a whole new universe. In 2019, inclusion is key when it comes to universe expansion goals. Both alternative credit and consumer-permissioned data will continue to be an important part of the conversation. 2. Machine learning for the masses The financial services industry has long been notorious for being founded on arguably antiquated systems and steeped in compliance and regulations. But the industry’s recent speed of disruption, including drastic changes fueled by technology and innovation, may suggest a changing of the guard. Digital transformation is an industry hot topic, but defining what that is — and navigating legacy systems — can be challenging. Successfully integrating innovation is the convergence at the center of the Venn diagram of strategy, technology and operations. The key, according to Deloitte, is getting “a better handle on data to extract the greatest value from technology investments.” How do you get the most value? Risk managers need big data, machine learning and artificial intelligence strategies to deliver market insights and risk evaluation. Between the difficulty of leveraging data sets and significant investment in time and money, it’s impossible for many to justify. To combat this challenge, the availability and access to an analytical sandbox (which contains depersonalized consumer data and comparative industry intel) is crucial to better serve clients and act on opportunities in lenders’ credit universe and beyond. “Making information analysis easily accessible also creates distinct competitive advantages,” said Vijay Mehta, Chief Innovation Officer for Experian’s Consumer Information Services, in a recent article for BAI Banking Strategies. “Identifying shifts in markets, changes in regulations or unexpected demand allows for quick course corrections. Tightening the analytic life cycle permits organizations to reach new markets and quickly respond to competitor moves.” This year is about meaningful metrics for action, not just data visualization. 3. How to fit into the digital-first ecosystem With so many things available on demand, the need for instant gratification continues to skyrocket. It’s no secret that the financial services industry needs to compete for attention across consumers’ multiple screens and hours of screen time. What’s in the queue for 2019? Personalization, digitalization and monetization. Consumers’ top banking priorities include customized solutions, omnichannel experience improvement and enhancing the mobile channel (as in, can we “Amazonize” everything?). Financial services leaders’ priorities include some of the same things, such as enhancing the mobile channel and delivering options to customize consumer solutions (BAI Banking Strategies). From geolocation targeting to microinteractions in the user experience journey to leveraging new strategies and consumer data to send personalized credit offers, there’s no shortage of need for consumer hyper-relevance. 33 percent of consumers who abandon business relationships do so because personalization is lacking, according to Accenture data for The Financial Brand. This expectation spans all channels, emphasizing the need for a seamless experience across all devices. 4. Keeping fraudsters out Many IT professionals regard biometric authentication as the most secure authentication method currently available. We see this technology on our personal devices, and many companies have implemented it as well. Biometric hacking is among the predicted threats for 2019, according to Experian’s Data Breach Industry Forecast, released last month. “Sensors can be manipulated and spoofed or deteriorate with too much use. ... Expect hackers to take advantage of not only the flaws found in biometric authentication hardware and devices, but also the collection and storage of data,” according to the report. 5. Regulatory changes and continued trends Under the Trump Administration, the regulatory front has been relatively quiet. But according to the Wall Street Journal, as Democrats gain control of the House of Representatives, lawmakers may be setting their sights on the financial services industry — specifically on legislation in response to the credit data breach in 2017. The Democratic Party leadership has indicated that the House Financial Services Committee will be focused on protecting consumers and investors, preserving sector stability, and encouraging responsible innovation in financial technology, according to Deloitte. In other news, the focus on improving accuracy in data reporting, transparency for consumers in credit scoring and other automated decisions can be expected to continue. Consumer compliance, and specifically the fair and responsible treatment of consumers, will remain a top priority. For all your needs in 2019 and beyond, Experian has you covered. Learn more

The concept of the credit card was originally envisioned by utopian novelist Edmond Bellamy in 1887 in his utopian novel “Looking Backward.” And ever since the first credit card was introduced almost 70 years ago, people have been absolutely crazy for them. The average American has roughly three of them in her wallet, each with an average balance of $6354 ($1841 for retail cards). Total US credit card debt tipped over $1 trillion in 2017 and continues to climb at around 5% a year. With all of that consumer enthusiasm, you’d be right to assume that it’s a fantastic business to be in. But the credit card industry of today is nothing if not competitive and, with literally thousands of credit card products out there, it’s exceptionally hard to stand out. Our wallets are overflowing with cards and our mailboxes are awash with card offers, yet few people could explain the differences between them. In addition, the industry has lost ground to an ever-proliferating list of alternative payment methods, including mobile peer-to-peer payment services and prepaid debit cards. Furthermore, the advent of big data and alternative underwriting models could allow some tech upstarts to refinance balances at lower interest rates – especially if they’re willing to accept slightly lower returns than credit card companies have become accustomed to. So while the industry as a whole appears to be quite healthy, it’s clear that in order to differentiate credit card companies need to be more innovative than they are today. And the first step towards coming up with new, innovative ideas is acknowledging your vulnerabilities. Six vulnerabilities in the credit card industry Credit card companies face threats on many sides, making it hard to know where to start initiating change. Here are some of the top vulnerabilities that face the credit card industry today. 1. Retailers are starting to balk at high fees In 2016, Costco concluded its exclusive partnership with American Express in favor of Visa and Citibank. While that transition was painful at times, analysts from BMO Capital Markets estimated that switch would save the retailer between $110 million and $220 million in interchange fees. Later that year, Walmart Canada announced that it intended to stop accepting Visa credit cards in its 400 stores, citing high transaction fees. The two companies resolved the dispute after six months, and neither company disclosed the new terms. But it wouldn’t be the last time it happened. Foods Co., a California-based Kroger family company, stopped accepting Visa credit cards in its 21 stores and five gas stations in August 2018 over a fee dispute. Its parent company stated that it’s considering following suit. When large retailers stop accepting certain payment networks or changing their preferred payment network over fee disputes, it’s not just the payment networks that suffer. Credit card issuers also miss out when their cardholders can no longer use certain cards at their favorite retailer. 2. Fintech companies competing for loyalty Fintech companies are providing many services that credit cardholders can’t always get with their card issuer. Some, for example, provide credit monitoring services that help consumers build or rebuild their credit. Other fintech companies are using alternative and trended credit data in their underwriting process. Earnest, for example, not only checks applicants’ credit scores but also looks at savings patterns, investment balances, and employment growth potential. Fannie Mae, the largest source of funding for mortgage lenders, began using trended credit data, which provides a deeper look at a borrower’s credit history, for single-family mortgage applications in 2016. By using alternative and trended credit data to evaluate prospective borrowers, these and other companies can find new customer markets and achieve more predictive decisions than the traditional way of measuring risk. 3. Mobile payment services bypassing credit card companies Apple Pay, Samsung Pay and Google Pay make it easier and safer for cardholders to use their credit cards when shopping online and at retail stores. That said, these services could start using their own payment infrastructure in the future, bypassing credit cards entirely. Peer-to-peer mobile payment services including PayPal, Venmo and Square, already do this. In fact, they charge a fee for credit card payments, which effectively forces most users to use a debit card or checking account instead. 4. Increased use of debit cards undercuts credit cards Consumers made 73.8 billion payments with a debit card in 2016, according to the Federal Reserve, with a value of $2.7 trillion. That’s roughly three times the volume and value of debit card payments a decade earlier. During that same time, the volume and value of credit card payments increased by closer to 1.5 times. While that’s still an upward trend, debit cards use is gaining more steam. Younger consumers are likely driving this trend toward debit instead of credit. A study conducted by Harris Poll recently found that Millennials carry fewer credit cards than older generations and appear far more debt warry. Also, according to a TD Bank survey, Millennials spend more than twice as much using cash, debit cards and checks than the average American. Some banks including Discover and American Express, have begun offering cash-back rewards to their debit and prepaid debit cardholders. These rewards programs may start to catch on with other banks, making debit cards a reasonable alternative to credit card holders who prefer debit but don’t want to miss out on cash back. 5. Challenger brands are targeting underserved customers Many major credit card issuers focus more on the prime and near-prime market, opening up the way for challenger brands to capture market share among consumers who are new to credit or looking to rebuild. Deserve, for instance, has raised more than $78 million to provide a credit card to international students with no Social Security number requirement. It also offers an unsecured credit card designed for consumers with no credit history. Another example is Petal, which has raised close to $17 million from investors to provide a no-fee, unsecured credit card to help consumers build credit — all with no credit score requirement. 6. A persistent lack of security in credit card transactions Credit card fraud was the most common form of identity theft reported to the Federal Trade Commission in 2017, according to a report by Experian. And while credit card companies have made strides to prevent fraudsters from accessing credit card information, perpetrators are getting smarter and more sophisticated, making it hard for card issuers to keep up. With consumer credit card debt rapidly growing and APR’s on the rise, the current credit card boon simply can’t last forever. The market will eventually shrink and a game of “Survivor” will ensue. So it would be wise for credit card companies to take stock of their vulnerabilities now and start getting ahead of the pack. Visit our website for more information on identity protection products you can offer your customers.

With credit card openings and usage increasing, now is the time to make sure your financial institution is optimizing its credit card portfolio. Here are some insights on credit card trends: 51% of consumers obtained a credit card application via a digital channel. 42% of credit card applications were completed on a mobile device. The top incentives when selecting a rewards card are cash back (81%), gas rewards (74%) and retail gift cards (71%). Understanding and having a full view of your customers’ activity, behaviors and preferences can help maximize your wallet share. More credit card insight>

Millennials have been accused of “killing” a lot of things. From napkins and fabric softener to cable and golf, the generation which makes up the largest population of the United States (aka Gen Y) is cutting a lot of cords. Despite homeowning being listed as one of the notorious generational group’s casualties, it’s one area that millennials want to keep alive, according to recent statistics. In fact, a new Experian study revealed 86% of millennials believe that buying a house is a good financial investment. However, only 15% have a mortgage today. One explanation for this gap may be that they appear too risky. Younger millennials (age 22-28) have an average near prime score of 652 and older millennials (age 29-35) have a prime score of 665. Both subsets fall below the average VantageScore® credit score* of U.S. consumers – 677. Yes, with the majority of millennials having near prime or worse credit scores, we can agree that they will need need to improve their financial hygiene to improve their overall credit rankings. But their dreams of homeownership have not yet been dashed. Seemingly high aspirations (of homeownership), disrupted by a reality of limited assets, low scores, and thin credit files, create a disconnect that suggests a lack of resources to get into their first homes – rather than a lack of interest. Or, maybe not. Maybe, after surviving a few first-time credit benders that followed soon after opening the floodgates to credit, millennials feel like the combination of low scores and the inability to get any credit is only salt in their wounds from their lending growing pains. Or maybe it’s all the student loans. Or maybe it’s the fact that so many of them are underemployed. But maybe there’s still more to the story. This emerging generation is known for having high expectations for change and better frictionless experiences in all areas of their life. It turns out, their borrowing behavior is no different. Recent research by Experian reveals consumers who use alternative financial services (AFS) are 11 years younger on average than those that do not. What’s the attraction? Financial technology companies have contributed to the explosive growth of AFS lenders and millennials are attracted to those online interactions. The problem is many of these trades are alternative finance products and are not reported to traditional credit bureaus. This means they do nothing to build credit experience in the eyes of traditional lenders and millennials with good credit history find it difficult to get access to credit well into their 20s. Alternative credit data provides a deeper dive into consumers, revealing their transactions and ability to pay as evidenced by alternative finance data, rental, utility and telecom payments. Alt data may make some millennials more favorable to lenders by revealing that their three-digit credit score (or lack there of) may not be indicative of their financial stability. By incorporating alternative financial services data (think convenient, tech-forward lenders that check all the boxes for bank removed millennials, not just payday loan recipients), credit-challenged millennials have a chance at earning recognition for their experience with alternative financial services that may help them get their first mortgage. Society may have preconceived notions about millennials, but lenders may want to consider giving them a second look when it comes to determining creditworthiness. In a national Experian survey, 53% of consumers said they believe some of these alternative sources would have a positive effect on their credit score. We all grow up sometime and as our needs change, there may come a day when millennials need more traditional financial services. Lenders who take a traditional view of risk may miss out on opportunities that alternative credit data brings to light. As lending continues to evolve, combining both traditional credit scores and alternative credit data appears to offer a potentially sweet (or rather, home sweet home) solution for you and your customers. *Calculated on the VantageScore® credit score model. Your VantageScore® credit score from Experian indicates your credit risk level and is not used by all lenders, so don't be surprised if your lender uses a score that's different from your VantageScore® credit score.

The average number of retail trades per consumer has been trending down since 2007. But the average consumer retail debt is trending up, roughly $73 year-over-year. When analyzing single-store credit card debt by state in 2017, we found: States with the highest retail debt: Texas ($2,198) Alaska ($2,170) Arkansas ($2,067) States with the lowest amount of retail debt: Wisconsin ($1,374) Minnesota ($1,440) Hawaii ($1,442) Whether you’re a retailer, credit union or financial institution, stay ahead of the competition by using advanced analytics to target the right customers and increase profitability. More credit trends

Credit card balances grew to $786.6 billion at the end of 2017, a 6.7% increase to the previous year and the largest outstanding balance in over a decade. And while the delinquency rate increased slightly to 2.26%, it is significantly lower than the 4.73% delinquency rate in 2008 when outstanding balances were $737 billion. The increase in credit card balances combined with the slight growth in delinquencies points to a positive credit environment. Stay up to date on the latest credit trends to maximize your lending strategies and capitalize on areas of opportunity. Get more credit trends and insights at our webinar on March 8. Register here

Are you ready to launch a new product to capture the revenue growth opportunities in today’s market? The competition is heating up for new growth, as banks increased personal loan balances by 10 percent year-over-year in 2015 and another 6 percent in 2016.* Many lenders are now looking for robust data to understand the market opportunity based on their risk appetite. This challenge usually takes a significant investment in consumer credit data to gain the necessary insights. In helping lenders launch new products, I’ve found there are common areas of focus and specific steps you must take to move from the initial business case to more tactical planning. The following details come to mind: refining risk thresholds, pricing, loss forecasting and use of models within the initial go-to-market strategy. These project tasks can’t be successfully completed without having the right breadth and depth of data available. Knowing the past can help you create a better future for your business. When I start working with a client on a new product launch, I want to ensure they have sufficient data that can provide a comprehensive historical consumer view. In my experience, the best data to use will show an exhaustive view of consumer behaviors through the economic cycle. Having this large volume of data enables me to evaluate the business strategy and risks through the financial crisis while also giving my clients the foundation for compliance with loss forecasting regulations. Obtaining this breadth of data often can be a significant, but necessary, investment. Data is a great starting point, but it isn’t enough. Understanding the data sufficiently to design an effective go-to-market strategy is critical for success. I’ve found that identifying specific attributes helps give my clients a deep dive into the structure of a consumer’s credit history at the trade level. This level of information provides insight into the structure of the consumer’s wallet and preferences. Additionally, this depth of data allows my clients to develop powerful custom models for use in their business strategy. Being prepared is half the victory. Having comprehensive data that will help you understand consumer spending behavior and the risk they carry through the economic cycle will assist in creating a successful go-to-market strategy. Our Market Entry ServicesTM data sets are analytics-ready, including attributes and performance flags, to give you a holistic view of your target market. Having this breadth and depth of data, along with strong tactical planning and execution, will ensure your success in launching new products and entering new markets. *Experian–Oliver Wyman Market Intelligence Report

Our 8th annual State of Credit report shows that consumer credit scores and signs of economic recovery continue on an upward trend, coming close to a prerecession environment. The average U.S. credit score is up 2 points to 675 from last year and is just 4 points away from the 2007 average. Originations are increasing across nearly all loan types, with personal loans and automotive loans showing 11% and 6% increases year-over-year, respectively. Consumer confidence is up 25% year-over-year and has increased more than 16% from this period in 2007. With employment and consumer confidence rising, the economy is expected to expand at a healthy pace this year and continue to rebound from the recession. Now is the time to capitalize on this promising credit trend. State of Credit 2017

Auto originations continue to increase — particularly within prime categories. According to Experian’s latest State of the Automotive Finance Market report: Prime consumers grabbed the lion’s share of the total finance market, at 40.9%. Super-prime buyers showed the largest increase, reaching 20.2%. Consumers outside the prime category (credit score of 600 or lower) decreased to the lowest share on record since 2012. Credit unions and captive lenders increased market share of total vehicle financing, growing to 21% and 29.8% — an increase of 6.9% and 35.1%, respectively. As auto loan originations continue their upward trend, lenders can stay ahead of the competition by using advanced analytics to target the right customers and increase profitability.

There’s no shortage of headlines alluding to a student loan crisis. But is there a crisis brewing or is this just a headline grab? Let’s look at the data over the past 4 years to find out. Outstanding student loan (should be loan) debt grew 21%, reaching a high of $1.49 trillion in Q4 2016. Over the past 4 years, student loan trades grew 4%, with a slight decline from 2015 to 2016. Average balance per trade grew 17% to reach $8,210. Number of overall student loan trades per consumer is down 5% to just 3.85. The average person with a student loan balance had just over $32,000 outstanding at the end of 2016 — a rise of 15%. While we’re seeing some increases, the data tells us this is a media headline grab. If students are educated about the debt they’re acquiring and are confident they can repay it, student loan debt shouldn’t be a crippling burden. More student loan insights