Tag: IntelliView

The first six months of 2016 has shown that the total credit card limits among the subprime and deep subprime credit range totaled $6.4 billion, the highest amount reported for those groups in the last five years. Our Q2 2016 Experian-Oliver Wyman Market Intelligence Report webinar will analyze the trends impacting consumer credit decisions in the current economy. The data is from the latest Experian Market Intelligence Brief report.

According to the latest Experian–Oliver Wyman Market Intelligence Report, HELOC originations came in at $43 billion for Q4 2015 — a 22% increase over Q4 2014. HELOC originations for all of 2015 totaled $160 billion — a 21% increase year over year. As HELOC originations continue their growth trend, lenders can stay ahead of the competition by using advanced analytics to target the right customers and increase profitability. >> Revamp your mortgage and HELOC acquisitions strategies

Using bankcard utilization to forecast holiday spend It’s officially November, and like me, you’ve probably noticed all the holiday promotions in your mailbox and inbox. With only a brief window of holiday shopping available, it’s a retailer’s race to get consumer discretionary dollars. As we near the end of 2015, the U.S. economy continues to improve steadily, and consumers are cautiously optimistic about their financial well-being. National unemployment[i] is down to 5.1 percent, and while the Consumer Confidence Index®[ii] slipped to 97.6 in October, it is still higher than it was at the end of 2014. So will the U.S. consumer spend more this holiday season? One way to measure this behavior is through bankcard utilization rates — i.e., how much of their available credit consumers use. Overall, average bankcard utilization didn’t show much movement in Q3 2015, averaging 20.6 percent, compared with 20.3 percent the year before (a 1.5 percent increase).[iii] However, when we look at utilization rates by VantageScore® credit score tier, we see not only varying year-over-year (YOY) changes among consumer risk segments, but, more importantly, significant disparity in the overall usage of available credit. Q3 2014 Q3 2015 YOY increase Super Prime (781-850) 5.5% 5.6% 1.8% Prime (661-780) 27.4% 27.8% 1.4% Near Prime (601-660 63.8% 64.5% 1.2% Subprime (501-600) 76.1% 78.4% 3.1% Deep Subprime (300-500) 94.7% 97.6% 3.1% Super-prime consumers use less than 6 percent of their available credit limits, while consumers in the deep-subprime tier use nearly every dollar allotted. So while we can’t yet determine how “black” this holiday season will be, we can predict that the lower a consumer’s credit tier, the more that consumer will rely on bankcards to fund his or her holiday shopping. For more credit and market insights, join Robert Stone and I for a Webinar, Unique insights on consumer credit trends and outlook for the remainder of 2015. [i]Bureau of Labor Statistics [ii]The Conference Board [iii]Experian IntelliView℠ VantageScore® is a registered trademark of VantageScore Solutions, LLC.

According to the latest State of the Automotive Finance Market report, consumers are continuing to extend loan terms as a way to keep payments low.

While auto delinquencies declined slightly year over year (3.01% for accounts 30 days past due or greater in Q2 2015 versus 3.03% a year earlier), it is interesting to note the variance in delinquency by lender channel.
Mortgage originations kicked off Q1 2015 with a 25% year over year increase to $315 billion.
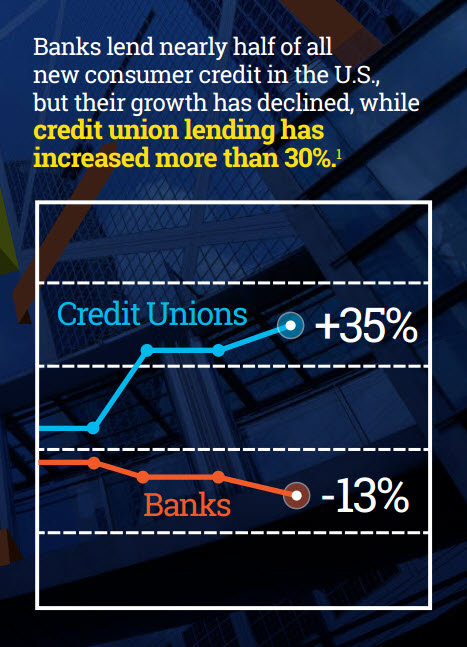
Auto loan originations reached $153 billion in Q2 2014, which was a 16 percent increase over the same quarter last year. While the largest contribution came from captive auto lenders at $47 billion (a 14 percent increase), credit unions experienced the largest year-over-year increase of 35 percent, with originations reaching $37 billion in the latest quarter. As auto loan originations continue to grow, lenders can stay ahead of the competition by using advanced analytics to target the right customers and increase profitability. Learn how your automotive portfolio compares through the peer-benchmarking capabilities of IntelliViewSM, and view sample reports by industry. Source: Access the latest credit trends with Experian's IntelliView.
Consumer debt for every major consumer lending category has decreased over the past few years, except for student loans.
HELOC originations grew 27 percent year over year in Q2 2014.
While bankcard originations increased 26 percent year over year to $85.3 billion in Q2 2014, delinquencies continued their downward trend, reaching 0.47 percent of balances — an 8 percent decline year over year.
According to the latest Experian-Oliver Wyman Market Intelligence Report, home equity line of credit (HELOC) originations warmed up significantly heading into summer.
Are you sure you are making the best consumer credit decisions? Given the constantly evolving market conditions, it is a challenge to keep informed. In order to confidently grow and manage the bottom line, organizations need to avoid these four basic risks of making credit decisions with limited trend visibility. Competitive Risk - With limited visibility to industry trends, organizations cannot understand their position relative to peers. Product Risk - Organizations without access to the latest consumer behaviors cannot identify and capitalize on emerging trends. Market Risk - Decisions suffer when made without considering market trends in the context of the economy. Resource Risk - Extracting useful insights from vast market data requires abundant resources and comprehensive expertise. Get more information on the business risks of navigating credit decisions with limited trend visibility.
According to Experian Marketing Services’ Q1 2014 Email Benchmark Report, personalized abandoned cart emails that dynamically show the actual customer cart had 25 percent higher transaction rates than reminder emails that just linked back to the brand’s Website.
According to the latest Experian-Oliver Wyman Market Intelligence Report, mortgage originations for Q1 2014 decreased by 53 percent over Q1 2013 - $235 billion versus $515 billion, respectively.
Bankcard originations had a 32 percent year-over-year increase in Q4 2013 ($61 billion to $81 billion).