Loading...

10 political personas to use in political digital marketing campaigns

Published: April 23, 2024 by Experian Marketing Services

Political audiences to include in your political campaign strategy

In the American political landscape, understanding the intricacies of voters’ attitudes and behaviors has never been more crucial. With the 2024 election season on the horizon, the challenge lies in moving beyond broad categorizations like “Democrat,” “Republican,” or “Independent.” Voters seek candidates who resonate with their beliefs and values.

To meet this challenge, Experian has created political personas that offer a nuanced understanding of American voters. In this blog post, we’ll explore how these Experian audiences can help you tailor your engagement strategies for the upcoming election cycle.

Before we dive into our political personas, let’s break down what political campaign marketing is and six benefits of using digital marketing in political campaigns.

What is political campaign marketing?

Political campaign marketing is the strategic engine that drives candidates toward electoral success. It involves crafting and sending out tailored messages to effectively reach constituents to inform them about candidates’ stances on key issues. Think of it as the art of narrative construction, using various communication channels—from traditional media to digital platforms—to engage and mobilize supporters. In an era marked by information saturation, effective campaign marketing serves to cut through the noise to deliver compelling messages that inform, inspire, and spur action.

Benefits of digital marketing in political campaigns

As the 2024 election approaches, using digital marketing in political campaigns becomes paramount to effectively reach and influence voters where they spend a significant portion of their time—online.

Kamala Harris’s entry into the race has shifted spending priorities, particularly in critical states such as Ohio, where the Senate race has already attracted $300 million in ad spending. Political ad spend on connected TV (CTV) is expected to rise significantly, from 2.7% in 2020 to 12.8% this year. The Harris campaign is spearheading this trend, dedicating $200 million to digital ads, with a substantial portion directed toward streaming platforms.

Embracing digital marketing can help campaigns effectively shape opinions and mobilize support. Here are five key benefits of integrating digital marketing strategies into political campaigns:

  1. Unparalleled reach with targeted advertising: A well-connected digital platform partner can help you reach your target audiences across the ecosystem – from social to the open web.
  2. Optimization flexibility: Digital marketing allows for quick adjustments in response to real-time data and evolving circumstances.
  3. Interactive engagement: The interactive nature of digital channels creates meaningful engagement and dialogue between candidates and voters, building connections and community.
  4. Insights: Robust analytics provide valuable insights into audience behavior and preferences, facilitating continuous optimization and refinement of outreach efforts.
  5. Amplified messaging: Through digital marketing, political campaigns can amplify their message, mobilize support, and forge deeper connections with voters.

Data serves as the foundation for these benefits. Interactivity hinges on data to deliver the right message and creative for engagement. Insights are gained through pre-campaign research, analyzing audience attributes to grasp their interests and behaviors. Flexibility relies on real-time campaign data, a unique advantage in digital marketing.

In an era where audiences are available readily on most major activation platforms, advertisers need to understand how audiences are built to be privacy conscious and consistent in a cookieless environment.

Experian’s political personas

Digital marketing in political campaigns is crucial to reach and influence voters online. Integrating Experian’s political personas into your political campaign strategy can help you grasp the complexities of today’s American voter landscape and craft tailored engagement strategies. These personas offer invaluable insights into voter viewpoints on key political issues, enriching digital marketing efforts and empowering campaigns to connect with constituents more effectively.

Experian has created 10 political personas to help you better understand today’s American voter so you can reach consumers based on their viewpoints into key political issues.

Our political personas group voters along the political spectrum from most “committed” on the ends of the spectrum.

The spectrum of Experian's 10 political personas

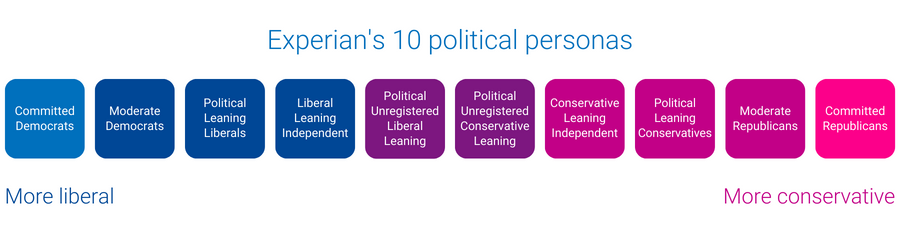
Let’s walk through how we define each persona starting from the most “committed” personas on the ends of the spectrum.

Committed Democrats

This audience contains consumers who are likely to have a “very liberal” outlook on political issues. They have strong liberal opinions on various topics including key issues and the economy and are very involved in their communities.

Committed Republicans

This audience contains consumers who are likely to have a “very conservative” outlook on political issues. They are well-informed, community-minded individuals with strong opinions that reflect their conservatism. They have very conservative attitudes regarding key social issues.

Moderate Democrats

This audience contains consumers who are likely to have a “somewhat liberal” outlook on political issues.

Moderate Republicans

This audience contains consumers who are likely to have a “somewhat conservative” outlook on political issues.

Political Leaning Liberals

This audience contains consumers who are likely to have strong opinions on key issues that may not align with the traditional Democrat point of view.

Political Leaning Conservatives

This audience contains consumers who are likely on-the-fence on traditional Republican points of view on key issues.

Liberal Leaning Independents

This audience contains consumers who are registered independents and who are likely to have a “middle of the road” outlook on political issues while tending to lean more liberal.

Conservative Leaning Independents

This audience contains consumers who are likely registered independents and likely have a “middle-of-the-road” outlook on political issues while tending to lean more conservative.

Political Unregistered Liberal Leaning

This audience contains consumers who are not likely to have aligned with a specific party, but have a more liberal attitude. They are well-informed and are aware of important political issues. They frequently align with but are not necessarily completely aligned with liberal points of view.

Political Unregistered Conservative Leaning

This audience contains consumers who are not likely to have aligned with a specific party, but have a more conservative attitude. They are well-informed and are aware of important political issues. They frequently align with but are not necessarily completely aligned with conservative points of view.

These 10 personas can help you better understand who the American voter is, but when combined with our 200 politically relevant audiences, such as watches political TV, donations to charitable causes, engagement channel preferences, hobbies, and more, the ability to study and improve engagement for each persona is considerably magnified.

How to combine our political personas with other audiences

If you’re a political candidate looking to reach an important population, Experian audiences are available on-the-shelf of major platforms. For example, if you want to reach unregistered voters and independent voters to influence green initiatives within your community, you can focus on unregistered and moderate personas in the area and combine that with audiences interested in green initiatives, like our GreenAware segments – which predict a consumer’s attitude and point of view on environmental issues.

You can use our “Political Unregistered Liberal Leaning”, “Liberal Leaning Independents,” and GreenAware “Think Greens” audience segments to reach constituents who are likely to be most interested in your message.

To reach voters based on their regional voting patterns, you can use our new battleground counties and district audiences:

  • Affiliation Switcher Counties
  • Battleground Counties
  • House Battleground Districts
  • Democrat Counties
  • Republican Counties
  • Independent Counties

Add Experian’s audiences to your 2024 election strategy

Political advertising spend is projected to surpass $12 billlion in the 2024 election cycle, generating the largest amount of voter outreach in the history of American elections. Experian’s audiences are available on major activation platforms allowing you to strategically reach constituents who would be most impacted and interested in your initiatives.

As we approach a cookieless future, Experian’s political personas are cookie resilient. Our data is rooted in both offline and online data that doesn’t rely on third-party cookies. The personas do not rely on an individual’s browsing behavior. Experian can help our partners understand and engage with these political audiences.

Over 200 politically relevant Experian audiences are available for activation on-the-shelf of the leading TV, demand, and supply platforms. Here are the platforms where you can find our political audiences:

  • ArcSpan
  • Audigent
  • Cadent
  • Eyeota
  • Magnite
  • Microsoft
  • Nexxen
  • Pandora
  • Permutive
  • Samsung Ads
  • The Trade Desk
  • Verizon Media
  • Viant
  • Videoamp
  • Yieldmo

Can’t find the audience you’re looking for or need a custom audience? Connect with our audience team for more information.


Latest posts

Loading…
Print Coupon Use Strong Despite Increase In Digital Coupons

In the digital age, print coupons are dinosaurs, right? Not one bit. In fact, according to Experian Simmons, users of printed coupons — those obtained from newspapers, magazines, mail, etc.—outnumber users of digital coupons by a margin of almost 3-to-1. As of February 14, 2011 (the latest date for which data was available at the time of this post), 68% of all U.S. adults said their household uses print coupons, a number that has remained relatively unchanged during the past five years. 68% of all U.S. adults said their household uses print coupons, a number that has remained relatively unchanged during the past five years. By comparison, Experian Simmons also reports that 22% of all U.S. adults say their household uses digital coupons obtained from email or the Internet. That figure may be lower than the usage reported for any measured type of print coupon, including those handed out in or near stores, but adoption of digital coupons is growing: in 2005, just 12% of American adults used digital coupons. Smartphones adoption will continue to propel digital coupon use to historic highs in the months and years to come. According to an analysis featured in the 2010 U.S. Household Consumer Trend and Benchmark Report, 34% of U.S. iPhone owners use digital coupons compared with just 21% of non-iPhone owners. Interestingly, use of print coupons among iPhone owners doesn’t suffer a bit. In fact, as of February 14, 2011, 68% of iPhone owners reported that their household used print coupons versus 64% of non-iPhone owners, making it obvious that merchants should give their customers an option of using both print and digital coupons. For further consumer insights, download the 2010 U.S. Household Consumer Trend and Benchmark Report, which includes trends on economic outlook by household income, charitable contributions and planned automobile purchases.

Mar 31,2011 by

Cinderella Teams Have Contrasting Styles Both on the Court and in the Marketplace

Spiders, Rams, Seminoles, Golden Eagles, and Bulldogs. This is one way to describe the diverse collection of Cinderella teams that have advanced to the Sweet 16 in this year's NCAA men's basketball tournament. Four of these teams, the University of Richmond, Virginia Commonwealth University (VCU), Florida State, and Marquette, take their double-digit seeds to the next round in hopes of reaching the Elite 8. Butler, last year's Cinderella story, is seeking a visit to the Final Four for the second straight year.  Interestingly, Richmond, VA is the home market for two of the Sweet 16 teams. These are the University of Richmond and VCU. Even more interesting is the fact that these two teams are on a collision course. With wins in the next round they would meet in the Elite 8 for a prized spot in the Final Four. With their surprise victories in the tournament so far, what these teams have in common is being labeled “bracket busters.” A more extensive market analysis uncovers other similarities, plus some notable differences. Here are highlights from profiles of the home market areas for this year's Cinderella teams using data from Experian's Mosaic consumer lifestyle segmentation system and Experian Simmons market research. The following statistics are based on the home markets of the five Cinderella teams. All four Cinderella teams hail from markets with above average interest in college basketball.  Milwaukee, home of 11th seeded Marquette, has the highest concentration of adults who are interested in college basketball (28.1%). This is 11 percent relatively higher than percentage for the total U.S. Milwaukee also has the highest percentage of adults who said they watched last year's men's NCAA Division I tournament (17.3%). This is a relative six percent higher than the total U.S.  The 10th seeded Florida State Seminoles hail from Tallahassee, which has the second highest percentage of adults with an interest in college basketball (26.9%). Richmond, where both 11th seeded VCU and 12th seeded Richmond are based, is just behind Tallahassee when it comes to the percentage of adults who are interested in college basketball (26.7%). Indianapolis has the lowest percent of residents who are interested in college basketball (26.3%), but that's still a relative four percent higher than the U.S. as a whole. Although interest should be very high this year, Richmond and Indianapolis (15.8% each) have the lowest percentage of adults who watched last year's tournament. Cinderella Team Market Snapshots Richmond, VA Home market of: Richmond Spiders, VCU Rams Sweet 16 opponents: Kansas, Florida State The top two segments in Richmond representing 30% of the market's households are: Metro Minority Communities (18.1%) comprised of married couples and single-parent minorities earning above average incomes from a mix of service industry and white-collar jobs in transportation, health care, education, and public administration. Urban Commuter Families (11.5%) comprised of upscale, college educated Baby Boomer families and couples living in single detached homes in city neighborhoods on the metropolitan fringe. Other interesting facts: Most over-represented segment is Metro Minority Communities (3.8 times the national average) Percent of adults with interest in college basketball is 26.7% Percent of adults who watched last year's men's college basketball tournament is 15.8% Tallahassee, FL Home market of: Florida State Seminoles Sweet 16 opponent: VCU Rams Similar to Richmond, the top two segments in Tallahassee are Metro Minority Communities (14.8%) and Urban Commuter Families (6.9%). The two segments that account for the next highest share of households are: Struggling City Centers (6.7%) comprised of young, single and single-parent minority renters living in low-income city neighborhoods. Rural Southern Living (6.5%) comprised of lower-income blue-collar couples and families living in sparsely settled mobile home communities. Other interesting facts: Most over-represented market segment is College Town Communities (6.2 times the national average) Percent of adults with interest in college basketball is 26.9% Percent of adults who watched last year's men's college basketball tournament is 16.8% Milwaukee, WI Home market of: Marquette Golden Eagles Sweet 16 opponent: North Carolina Tarheels The top segment in Milwaukee representing 11.2% of households is Urban Commuter Families (as described above). The two segments that account for the next highest share of households are: Small-town Success (10.5%) comprised of white collar, college educated, middle-aged working couples living in newly developed subdivisions outside the nation's beltways. Steadfast Conservative (9.3%) comprised of high-school educated mature singles and couples living in middle-class urban blue-collar neighborhoods. Other interesting facts: Most over-represented market segment is Successful Suburbia (3.6 times the national average) Percent of adults with interest in college basketball is 28.1% Percent of adults who watched last year's men's college basketball tournament is 17.3% Indianapolis, IN Home market of: Butler Bulldogs Sweet 16 opponent: Wisconsin Badgers There are four equal size segments that account for just over 30% of Indianapolis households. These include Steadfast Conservative (8.9%), Urban Commuter Families (7.8%), and Small-town Success (7.1%). All three of these segments are also among the top five in Richmond, Tallahassee, and Milwaukee. What makes Indianapolis unique from the other three markets is a higher percentage of New Suburbia Families (7.2%). These are young, affluent working couples with pre-school children concentrated in fast-growing, metro fringe communities. Other interesting facts: Most over-represented market segment is Successful Suburbia (2.8 times the national average) Percent of adults with interest in college basketball is 26.3% Percent of adults who watched last year's men's college basketball tournament is 15.8%

Mar 23,2011 by

Catching Office Online NCAA Tournament Streamers in the Act

Tournament play begins this week in the 2011 NCAA Men's Division I Basketball Tournament, which means office productivity is likely to take a hit as fans jump online to watch live streams of games being played during working hours. With online viewing options expanded to mobile and other digital platforms this year, fans have more avenues than ever to get their March Madness fix. In fact, according to a recent estimate by Challenger, Gray & Christmas, total online tournament viewership during work hours is likely to reach 8.4 million hours during this year's tournament. In this latest installment of Experian Marketing Services' continuing March Madness consumer coverage, we'll profile the work life of online game streamers. Is there one down the hall or in the next cube? The answer is almost certainly “yes,” but the “who” may surprise you.  According to Experian Simmons, just over 5% of all U.S. adults and nearly a quarter of adult NCAA men's tournament viewers (24%) qualify as likely online game streamers. For the purpose of this analysis, likely online game streamers is defined as those U.S. adults who watched the last NCAA men's basketball tournament who also sought out sports information online or watched online video in the last 30 days. These likely online game streamers must have also visited either cbssports.com or espn.com in the last 30 days. Fully 79% of likely online game streamers are employed either full-or or part-time, with 59% working 40 or more hours a week. Department managers and IT staff-have reason to be concerned about a loss in productivity during March Madness: fully 79% of likely online game streamers are employed either full-or or part-time, with 59% working 40 or more hours a week. Don't be so quick to suspect that colleague who always shows up late and goes home early as a game streamer. A safer bet would be the guy who's always at his desk when you get in and still there when you head out. In fact, one-in-ten adults who work more than 40 hours a week (11%) are likely online game streamers, meaning they're more than twice as likely as the average adult to be checking out the game online. Remote employees who work at home often get a bad rap with office “suits” sometimes assuming their pajama-clad colleagues fall prey to distractions. Actually though, Americans who work from home are no more or less likely to be likely online streamers than those who don't work from home. Likewise, the self-employed are no more or less likely to be online game streamers than laborers who work for “the man.” Interestingly, Experian Simmons found a direct correlation between company size and a worker's chance of being a likely online game streamer. Specifically: Those who work in companies with fewer than 100 employees are 17% less likely than the average American worker to be likely online game streamers. Those who work in companies with between 100 and 499 employees are just two percent less likely than average to be likely streamers while those employed by companies with between 500 and 999 employees are eight percent more likely to be online game streamers. Employees of companies with 1,000 or more employees are the most likely culprits with the group on average being 17% more likely to be likely online game streamers. As such, it's no surprise that Fortune 500 companies are the most at risk of having offices full of online streamers during March Madness. Employees of Fortune 500 companies are fully 66% more likely to be online game streamers than those who Americans employed by a non-Fortune 500 company. Finally, the best insight into whether your office mates are streaming basketball games online instead of working is by looking at their paycheck (not that we encourage that of course). Specifically, as income rises, so does one's chance of being an online game streamer: Employed Americans who personally earn less than $25,000 annually are the least likely to be online game streamers, scoring 50% below average on this metric. Those who earn between $25,000 and $49,999 are only 15% less likely to be game streamers. If you know or suspect that your colleague earns upwards of $50,000 a year, it's a good idea to keep an eye on them for the rest of the month; workers with incomes between $50,000 and $74,999 are 33% more likely than average to be likely game streamers and those who earn between $75,000 and $99,999 are 75% more likely to be likely game streamers. Your colleagues earning $100,000 or more annually are the most likely to be streaming online, with those personally taking home between $100,000 and $149,000 being a whopping 164% more likely than the average employee to be streaming games online. And those earning $150,000 or more annually being fully 176% more likely to be online game streamers. Moreover, one-in-five adults who earn $150,000 a year or more fall into our likely online game streamers segment compared with just 5% of all U.S. adults. The first match-up to be played during the traditional workday tips off at 12:15 EDT on Thursday March 17th when West Virginia takes on the winner of the second round-one play-in game. Armed with this information, you should be able to catch-or join-your office's online game streamers in the act.

Mar 17,2011 by

Subscribe to our newsletter

Enter your name and email for the latest updates

This site is protected by reCAPTCHA and the Google Privacy Policy and Terms of Service apply.

About Experian Marketing Services

At Experian Marketing Services, we use data and insights to help brands have more meaningful interactions with people. As leaders in the evolution of the advertising landscape, Experian Marketing Services can help you identify your customers and the right potential customers, uncover the most appropriate communication channels, develop messages that resonate, and measure the effectiveness of marketing activities and campaigns.

Visit our website

Subscribe to our newsletter

Stay up to date on the latest industry news and receive expert tips from our marketing experts.
Subscribe now!