
In this blog post…
In the American political landscape, understanding the intricacies of voters’ attitudes and behaviors has never been more crucial. With the 2024 election season on the horizon, the challenge lies in moving beyond broad categorizations like “Democrat,” “Republican,” or “Independent.” Voters seek candidates who resonate with their beliefs and values.
To meet this challenge, Experian has created political personas that offer a nuanced understanding of American voters. In this blog post, we’ll explore how these Experian audiences can help you tailor your engagement strategies for the upcoming election cycle.
Before we dive into our political personas, let’s break down what political campaign marketing is and six benefits of using digital marketing in political campaigns.
What is political campaign marketing?
Political campaign marketing is the strategic engine that drives candidates toward electoral success. It involves crafting and sending out tailored messages to effectively reach constituents to inform them about candidates’ stances on key issues. Think of it as the art of narrative construction, using various communication channels—from traditional media to digital platforms—to engage and mobilize supporters. In an era marked by information saturation, effective campaign marketing serves to cut through the noise to deliver compelling messages that inform, inspire, and spur action.
Benefits of digital marketing in political campaigns
As the 2024 election approaches, using digital marketing in political campaigns becomes paramount to effectively reach and influence voters where they spend a significant portion of their time—online.
Kamala Harris’s entry into the race has shifted spending priorities, particularly in critical states such as Ohio, where the Senate race has already attracted $300 million in ad spending. Political ad spend on connected TV (CTV) is expected to rise significantly, from 2.7% in 2020 to 12.8% this year. The Harris campaign is spearheading this trend, dedicating $200 million to digital ads, with a substantial portion directed toward streaming platforms.
Embracing digital marketing can help campaigns effectively shape opinions and mobilize support. Here are five key benefits of integrating digital marketing strategies into political campaigns:
- Unparalleled reach with targeted advertising: A well-connected digital platform partner can help you reach your target audiences across the ecosystem – from social to the open web.
- Optimization flexibility: Digital marketing allows for quick adjustments in response to real-time data and evolving circumstances.
- Interactive engagement: The interactive nature of digital channels creates meaningful engagement and dialogue between candidates and voters, building connections and community.
- Insights: Robust analytics provide valuable insights into audience behavior and preferences, facilitating continuous optimization and refinement of outreach efforts.
- Amplified messaging: Through digital marketing, political campaigns can amplify their message, mobilize support, and forge deeper connections with voters.
Data serves as the foundation for these benefits. Interactivity hinges on data to deliver the right message and creative for engagement. Insights are gained through pre-campaign research, analyzing audience attributes to grasp their interests and behaviors. Flexibility relies on real-time campaign data, a unique advantage in digital marketing.
In an era where audiences are available readily on most major activation platforms, advertisers need to understand how audiences are built to be privacy conscious and consistent in a cookieless environment.
Experian’s political personas
Digital marketing in political campaigns is crucial to reach and influence voters online. Integrating Experian’s political personas into your political campaign strategy can help you grasp the complexities of today’s American voter landscape and craft tailored engagement strategies. These personas offer invaluable insights into voter viewpoints on key political issues, enriching digital marketing efforts and empowering campaigns to connect with constituents more effectively.
Experian has created 10 political personas to help you better understand today’s American voter so you can reach consumers based on their viewpoints into key political issues.
Our political personas group voters along the political spectrum from most “committed” on the ends of the spectrum.

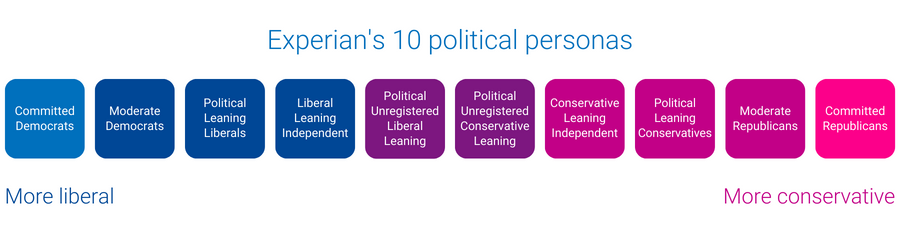
Let’s walk through how we define each persona starting from the most “committed” personas on the ends of the spectrum.
Committed Democrats
This audience contains consumers who are likely to have a “very liberal” outlook on political issues. They have strong liberal opinions on various topics including key issues and the economy and are very involved in their communities.
Committed Republicans
This audience contains consumers who are likely to have a “very conservative” outlook on political issues. They are well-informed, community-minded individuals with strong opinions that reflect their conservatism. They have very conservative attitudes regarding key social issues.
Moderate Democrats
This audience contains consumers who are likely to have a “somewhat liberal” outlook on political issues.
Moderate Republicans
This audience contains consumers who are likely to have a “somewhat conservative” outlook on political issues.
Political Leaning Liberals
This audience contains consumers who are likely to have strong opinions on key issues that may not align with the traditional Democrat point of view.
Political Leaning Conservatives
This audience contains consumers who are likely on-the-fence on traditional Republican points of view on key issues.
Liberal Leaning Independents
This audience contains consumers who are registered independents and who are likely to have a “middle of the road” outlook on political issues while tending to lean more liberal.
Conservative Leaning Independents
This audience contains consumers who are likely registered independents and likely have a “middle-of-the-road” outlook on political issues while tending to lean more conservative.
Political Unregistered Liberal Leaning
This audience contains consumers who are not likely to have aligned with a specific party, but have a more liberal attitude. They are well-informed and are aware of important political issues. They frequently align with but are not necessarily completely aligned with liberal points of view.
Political Unregistered Conservative Leaning
This audience contains consumers who are not likely to have aligned with a specific party, but have a more conservative attitude. They are well-informed and are aware of important political issues. They frequently align with but are not necessarily completely aligned with conservative points of view.
These 10 personas can help you better understand who the American voter is, but when combined with our 200 politically relevant audiences, such as watches political TV, donations to charitable causes, engagement channel preferences, hobbies, and more, the ability to study and improve engagement for each persona is considerably magnified.
How to combine our political personas with other audiences
If you’re a political candidate looking to reach an important population, Experian audiences are available on-the-shelf of major platforms. For example, if you want to reach unregistered voters and independent voters to influence green initiatives within your community, you can focus on unregistered and moderate personas in the area and combine that with audiences interested in green initiatives, like our GreenAware segments – which predict a consumer’s attitude and point of view on environmental issues.
You can use our “Political Unregistered Liberal Leaning”, “Liberal Leaning Independents,” and GreenAware “Think Greens” audience segments to reach constituents who are likely to be most interested in your message.
To reach voters based on their regional voting patterns, you can use our new battleground counties and district audiences:
- Affiliation Switcher Counties
- Battleground Counties
- House Battleground Districts
- Democrat Counties
- Republican Counties
- Independent Counties
Add Experian’s audiences to your 2024 election strategy
Political advertising spend is projected to surpass $12 billlion in the 2024 election cycle, generating the largest amount of voter outreach in the history of American elections. Experian’s audiences are available on major activation platforms allowing you to strategically reach constituents who would be most impacted and interested in your initiatives.
As we approach a cookieless future, Experian’s political personas are cookie resilient. Our data is rooted in both offline and online data that doesn’t rely on third-party cookies. The personas do not rely on an individual’s browsing behavior. Experian can help our partners understand and engage with these political audiences.
Over 200 politically relevant Experian audiences are available for activation on-the-shelf of the leading TV, demand, and supply platforms. Here are the platforms where you can find our political audiences:
- ArcSpan
- Audigent
- Cadent
- Eyeota
- Magnite
- Microsoft
- Nexxen
- Pandora
- Permutive
- Samsung Ads
- The Trade Desk
- Verizon Media
- Viant
- Videoamp
- Yieldmo
Can’t find the audience you’re looking for or need a custom audience? Connect with our audience team for more information.
Latest posts

2013 has been a milestone year for those lobbying on behalf of expanded rights of Lesbian, Gay, Bisexual and Transgendered (LGBT) Americans. With 12 states and the District of Columbia now formally recognizing same sex marriages and two highly anticipated rulings from the U.S. Supreme Court expected shortly, the momentum is currently on the side of those seeking greater recognition and support of LGBT-related issues. The speed with which public attitudes have shifted towards greater acceptance of LGBT individuals and their causes has left many marketers scrambling to devise plans that are not only inclusive of LGBT consumers, but in many instances, designed to overtly and publically court this influential and growing consumer segment. The 2013 LGBT consumer report out from Experian Marketing Services delivers insights marketers need to better understand the market that is on everyone’s radar. In this first of a series of blog posts, we’ll highlight key data from the report. Readers can download the full report at any time here. Living out Loud In 2006, when Experian Marketing Services first began measuring sexual orientation among respondents to our Simmons® National Consumer Study, we found that 3.4% of all non-Hispanic adults self-identified as either lesbian, gay, bisexual or transgendered (LGBT), a figure consistent with what leading LGBT researchers predicted at the time. However today, 4.3% of the non-Hispanic adult population self-identifies as LGBT, a figure that has risen slowly but steadily year-after-year. Younger adults have consistently been more likely to identify as LGBT, and in fact today, 5.8 percent of 18 to 34 year olds say they are lesbian, gay, bisexual or transgendered. As a result, the adult LGBT population predictably skews towards the younger age cohorts. Specifically, 36% of LGBT adults today are aged 18 to 34 versus 26% of the heterosexual population in that age range. Likewise, while 20% of heterosexual adults are age 65 and older, just 16% of LGBT adults are in this age range, though our data shows that the share of adults age 65 and older identifying as LGBT has also risen. Home and Family As a growing number of U.S. states pass laws recognizing same-sex marriages and civil unions, we see an increasing percentage of gay and lesbian Americans reporting that they are married. In 2007, for example, when only Massachusetts allowed same-sex marriage, 8% of gay men and 14% of lesbian women said they were married. Today, 17% of gay men and 16% of lesbian women are married. Marriage rates among lesbian and gay adults still lag well behind those of heterosexuals, but the gap is closing from both sides. In fact, while marriage rates are rising among lesbians and gays, they’re falling among heterosexuals. Today, 58% of heterosexual men and 53% of heterosexual women are married, compared to 60% of heterosexual men and 55% of heterosexual women who were married in 2007. The Pink Dollar Income levels are important to consider when targeting consumers, but more important is determining the amount of money left over for non-essentials after the other bills are paid. Despite earning nearly identical salaries, gay men have lower annual household discretionary expenditures than heterosexual men. Likewise, lesbian households have fewer dollars than those of heterosexual women to spend on non-essentials. This is mostly likely due to the fact that both lesbian and gay adults tend to reside in larger cities where the cost of living can be considerably higher than average. Interestingly, when household size is brought into the equation, we see that gay males actually have higher discretionary spending per capita than heterosexual men. In fact, gay men live in households that devote $6,794 per capita annually to non-essentials, which is $753 more than what heterosexual men spend. Forthcoming posts from this series will include insights into the automotive and food vertical markets; the mobile habits of LGBT consumers; and an examination of online visitors to LGBT content sites. Don’t want to wait? Download the full report now. Also, learn more about the Simmons LGBT Consumer Study, the only syndicated, national probability sample survey that measures the lifestyles, attitudes, media habits and brand preferences of the LGBT population giving marketers actionable insights into this powerful consumer segment that can be directly compared with those of heterosexuals.

The importance of affiliate marketing as a marketing channel is evident; it ranks as one of the most effective marketing channels for retailers, along with paid search and e-mail. While effective affiliate marketing relies on two groups, the publishers (affiliates) who display advertisements online and the advertisers (merchants) who aim to increase sales for their online shop, incorporating insights from Experian Marketing Services’ Hitwise can strengthen affiliate programs. I recently worked with Rakuten LinkShare on a webinar which highlights how their affiliate marketing services partnered with Hitwise create a proven package for success by providing valuable and actionable insights to affiliate marketers in understanding and targeting key consumer segments. Identify sites sending traffic to your category For our case study, we examined a custom category of Rakuten LinkShare department store clients and compared them with a category of department store non-clients. Using Hitwise, we examined which publisher sites sent traffic to each of the categories in order to identify the best affiliates to partner with. Among the top 20 publisher websites, a number of fashion and style content websites were sources of traffic to LinkShare Department store clients. Fashion and trend focused affiliate sites, namely ShopStyle and Polyvore, pointed to clear fashion editorial interest amongst those who visited LinkShare department store clients. Consider search terms used to capture consumer interest and intent Next, we looked at generic terms that sent traffic to affiliate site ShopStyle. Terms included searches for products sold in department stores such as variations of “heels” and “dresses”. The data indicates that ShopStyle is a good candidate to partner with because it attracted visits from those who are interested in fashion, looking for a deal, and who are likely in-market for specific products. Monitor effectiveness of affiliate programs and make timely decisions Hitwise can also be used by marketers to evaluate the effectiveness of their affiliate partnerships. For this example, we were able to show that Rakuten LinkShare affiliates sent a larger share of traffic to department store clients versus non-clients, pointing to a clear benefit from affiliate partnerships. As affiliate marketing is an increasingly critical channel for marketers, the importance of selecting the best and most relevant publishers is clear. When used in conjunction with affiliate marketing programs, Hitwise enables marketers to understand competitors’ online distribution and sources of traffic, select the best affiliates to partner with, and quantify the return on investment from partnerships.

New data from Experian Marketing Services’ Simmons® ConnectSM mobile and digital panel sheds light on the way smartphone users spend time using their phone, with the average adult clocking 58 minutes daily on their device. On average, smartphone owners devote 26% of the time they spend on their phone talking and another 20% texting. Social networking eats up 16% of smartphone time while browsing the mobile web accounts for 14% of time spent. Emailing and playing games account for roughly 9% and 8% of daily smartphone time, respectively, while use of the phone’s camera and GPS each take up another 2% of our smartphone day. *Activities include use of a smartphone’s native features dedicated to each activity as well as downloaded apps whose primary function falls under the given activity. For instance, “watch video” includes the act of watching video on the smartphone’s native video player as well as use of video apps such as YouTube, Netflix, etc. iPhone versus Android users Smartphone users may constantly debate which operating system is supreme, but we see clear differences between the ways consumers use their phone depending on the operating system that runs it. For starters, iPhone users spend an hour and fifteen minutes using their phones per day, a full 26 minutes more than the typical Android phone owner. Additionally, iPhone and Android smartphone owners use their phones in markedly different ways. For instance, 28% of the time that Android users spend using their phones is dedicated to talking, whereas iPhone users spend only 22% of their smartphone time talking on the device. Android owners also devote a greater share of time visiting websites on their phone than iPhone owners. On the other hand, iPhone owners spend a disproportionately greater share of smartphone time than Android owners texting, emailing, using the camera and social networking. Note on time spent It may surprise some to read that an activity like watching video accounts for such a small share (less than 1%) of the typical adult’s daily smartphone use. However, for the charts above to sum to a single daily total it was necessary to calculate individual activity contribution using a base of all smartphone owners, including those who don’t spend any time engaging in a given activity during a typical day. The chart below provides additional insights into the time spent engaging in the major smartphone activities examining only those individuals who engaged in each activity during a 24-hour period. I’ve also added into the chart a reach and frequency metric to indicate the popularity of each activity and the number of times per day that individuals engage in them. In the chart, the activities with the largest bubbles are those in which the greatest share of smartphone owners engage during a typical day and include the usual suspects: talking (79%), texting (76%), visiting websites (62%), emailing (61%) and social networking (52%). Activities with the fewest daily participants are: watching video, which 2.3% of smartphone owners do during a typical day, and reading, which just 0.5% of smartphone owners do daily. Given that nearly 98% of smartphone users don’t watch videos on their phone during a typical day, it’s easier to understand why video comprises such a low share of the average adult’s daily smartphone use. However, the chart above reveals that those who do watch video on their phone spend, on average, 5 minutes a day watching videos spread out over 4.2 different viewing sessions. For more information on consumers’ usage of smartphones, digital tablets, computers and other traditional and digital media platforms, check out Simmons Connect.