
The holiday season is almost here, and knowing how each generation plans to shop can give your holiday advertising campaigns the edge you need. Our recent survey of 1,000 U.S. consumers reveals 2024 holiday shopping trends for each generation and key insights into their anticipated spending levels, preferred shopping categories, and how they look for gift ideas.
In this blog post, we’ll explore three 2024 holiday shopping trends across generations:
- Projected consumer spending
- Top categories on shoppers’ lists
- Preferred channels for researching gifts
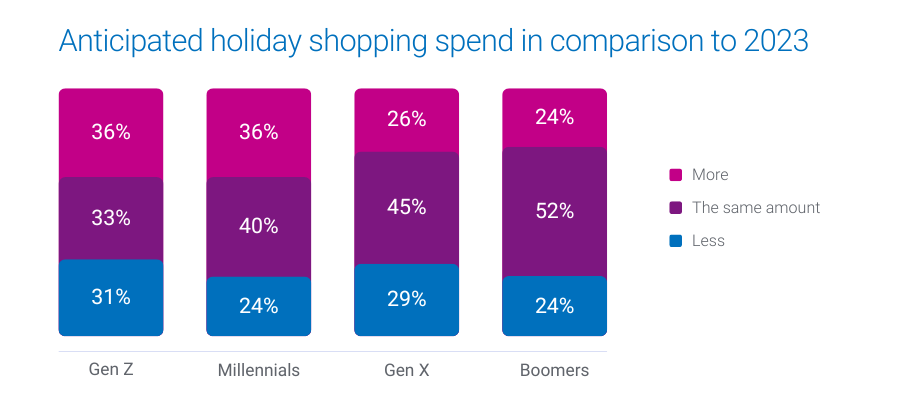
1. Projected consumer spending
Over 1 in 3 Gen Z and Millennials are gearing up to increase their holiday budgets this year, while Gen X and Boomers are likelier to stick to last year’s budget.
- 36% of Millennials and Gen Z plan to spend more this holiday season
- 45% of Gen X and 52% of Boomers expect their spending to remain consistent with last year

What this means for marketers
These insights highlight the importance of tailoring your messaging. For Gen Z and Millennials, emphasize value and unique offerings that justify increased spending. For Gen X and Boomers, focus on trust and reliability, reinforcing their confidence in your brand.
How Experian can help you target these audiences
Experian’s custom and syndicated audience segments, including Holiday Shopper High Spenders and Holiday Shopper Moderate Spenders, enable you to connect with these diverse consumer groups. Our audiences are available on-the-shelf of leading ad platforms to help you reach people across social, TV, and mobile.
The election effect
U.S. holiday retail sales saw 4.1% YoY growth in 2016 and 8.3% YoY growth in 2020 following presidential elections. There’s a chance that holiday spending increases after the 2024 election, regardless of the outcome. Experian has 240+ politically relevant audiences that you can activate across major ad platforms ahead of the upcoming election.
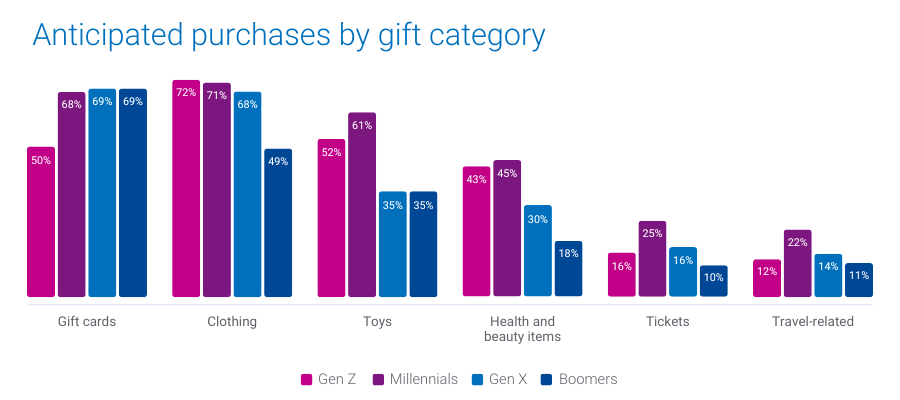
2. Top categories on shoppers’ lists
Different generations have distinct preferences when it comes to what they plan to buy. Gift cards top the list for Gen X and Boomers, while Gen Z leans toward clothing. Millennials are looking to splurge on toys, electronics, and experiences.
- 69% of Boomers and Gen X plan to purchase gift cards
- 72% of Gen Z will buy clothing
- 45% of Millennials will buy health and beauty items
- 25% of Millennials will buy tickets and 22% of Millennials will buy experiences

What this means for marketers
Align your product offerings and promotions with each generation’s preferences to capture their attention. For example, highlighting versatile gift cards may resonate more with older generations, while showcasing trendy apparel and tech gadgets will appeal to younger consumers.
How Experian can help you target these shoppers
We offer audience segments like Holiday Shoppers: Apparel, Cosmetics & Beauty Spenders, and Toys Shoppers that you can activate to connect with consumers primed to purchase in these categories.
We recently released 19 new holiday shopping audiences we recommend targeting to drive engagement and conversions. Download our audience recommendations here.
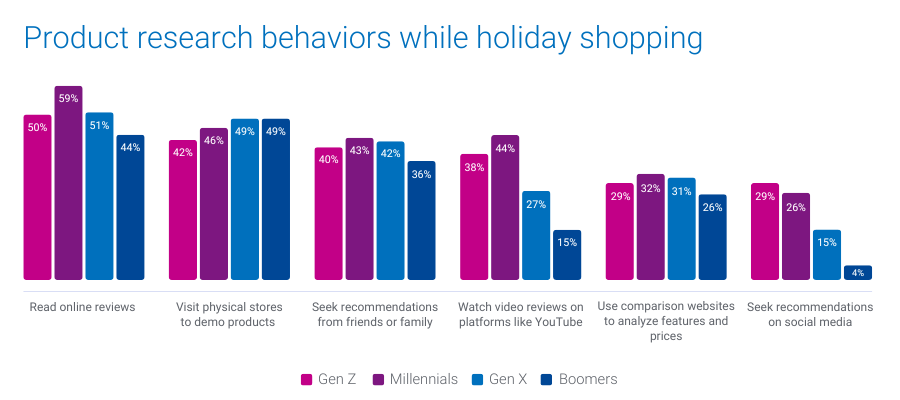
3. Preferred channels for researching gift ideas
When it comes to finding the perfect gifts, Gen Z turns to social media, while Millennials prefer online reviews and video content. Boomers and Gen X are more inclined to visit physical stores for hands-on product evaluations.
- 29% of Gen Z and 26% of Millennials will look for gift ideas on social media
- 44% of Millennials will rely on video reviews and product demos on platforms like YouTube
- 49% of Gen X and Boomers plan to visit physical stores to evaluate products in person

What this means for marketers
Understanding where each generation looks for inspiration can guide your content and ad placement strategy. To engage Gen Z, focus on social media campaigns and influencer partnerships. For Millennials, consider investing in video content and reviews. For older generations, ensure your in-store experience is optimized to convert browsing into purchases.
How Experian can help you engage these shoppers
Our TrueTouchTM audiences can help you pair the perfect messaging styles with the right channels and calls to action. Our Social media channel and content engagement audiences can help you reach Gen Z who are likely to be active users on major social platforms and are Black Friday shoppers. For a full list of Experian’s syndicated audiences and activation destinations, download our syndicated audiences guide.
Download our report for five 2024 holiday shopping trends by generation
Understanding 2024 holiday shopping trends by generation can help you tailor your targeting, messaging, media planning, and creative based on the generation you’re targeting.
In addition to the insights covered here, download our 2024 Holiday spending trends and insights report to learn:
- When consumers plan to shop (hint: they’re already shopping)
- Where they plan to shop (online vs. in-store)
Download our full report to access all five of our predictions by generation, so you can address the diverse needs of this year’s holiday shoppers.
When you work with Experian for your holiday shopping campaigns, you’re getting:
- Accurate consumer insights: Better understand your customers’ behavioral and demographic attributes with our #1 ranked data covering the full U.S. population.
- Signal-agnostic identity solutions: Our deep understanding of people in the offline and digital worlds provides you with a persistent linkage of personally identifiable information (PII) data and digital IDs, ensuring you accurate cross-device targeting, addressability and measurement.
- Secure connectivity: Bring data and identity to life in a way that meets your needs by securely sharing data between partners, utilizing the integrations we have across the ecosystem, and using our marketing data in flexible ways.
Make the most of this holiday shopping season with Experian. Contact us today to get started.
Source
Online survey conducted in June, 2024 among n=1,000 U.S. adults 18+. Sample balanced to look like the general population on key demographics (age, gender, household income, ethnicity, and region).
Latest posts

In the digital age, print coupons are dinosaurs, right? Not one bit. In fact, according to Experian Simmons, users of printed coupons — those obtained from newspapers, magazines, mail, etc.—outnumber users of digital coupons by a margin of almost 3-to-1. As of February 14, 2011 (the latest date for which data was available at the time of this post), 68% of all U.S. adults said their household uses print coupons, a number that has remained relatively unchanged during the past five years. 68% of all U.S. adults said their household uses print coupons, a number that has remained relatively unchanged during the past five years. By comparison, Experian Simmons also reports that 22% of all U.S. adults say their household uses digital coupons obtained from email or the Internet. That figure may be lower than the usage reported for any measured type of print coupon, including those handed out in or near stores, but adoption of digital coupons is growing: in 2005, just 12% of American adults used digital coupons. Smartphones adoption will continue to propel digital coupon use to historic highs in the months and years to come. According to an analysis featured in the 2010 U.S. Household Consumer Trend and Benchmark Report, 34% of U.S. iPhone owners use digital coupons compared with just 21% of non-iPhone owners. Interestingly, use of print coupons among iPhone owners doesn’t suffer a bit. In fact, as of February 14, 2011, 68% of iPhone owners reported that their household used print coupons versus 64% of non-iPhone owners, making it obvious that merchants should give their customers an option of using both print and digital coupons. For further consumer insights, download the 2010 U.S. Household Consumer Trend and Benchmark Report, which includes trends on economic outlook by household income, charitable contributions and planned automobile purchases.

Spiders, Rams, Seminoles, Golden Eagles, and Bulldogs. This is one way to describe the diverse collection of Cinderella teams that have advanced to the Sweet 16 in this year's NCAA men's basketball tournament. Four of these teams, the University of Richmond, Virginia Commonwealth University (VCU), Florida State, and Marquette, take their double-digit seeds to the next round in hopes of reaching the Elite 8. Butler, last year's Cinderella story, is seeking a visit to the Final Four for the second straight year. Interestingly, Richmond, VA is the home market for two of the Sweet 16 teams. These are the University of Richmond and VCU. Even more interesting is the fact that these two teams are on a collision course. With wins in the next round they would meet in the Elite 8 for a prized spot in the Final Four. With their surprise victories in the tournament so far, what these teams have in common is being labeled “bracket busters.” A more extensive market analysis uncovers other similarities, plus some notable differences. Here are highlights from profiles of the home market areas for this year's Cinderella teams using data from Experian's Mosaic consumer lifestyle segmentation system and Experian Simmons market research. The following statistics are based on the home markets of the five Cinderella teams. All four Cinderella teams hail from markets with above average interest in college basketball. Milwaukee, home of 11th seeded Marquette, has the highest concentration of adults who are interested in college basketball (28.1%). This is 11 percent relatively higher than percentage for the total U.S. Milwaukee also has the highest percentage of adults who said they watched last year's men's NCAA Division I tournament (17.3%). This is a relative six percent higher than the total U.S. The 10th seeded Florida State Seminoles hail from Tallahassee, which has the second highest percentage of adults with an interest in college basketball (26.9%). Richmond, where both 11th seeded VCU and 12th seeded Richmond are based, is just behind Tallahassee when it comes to the percentage of adults who are interested in college basketball (26.7%). Indianapolis has the lowest percent of residents who are interested in college basketball (26.3%), but that's still a relative four percent higher than the U.S. as a whole. Although interest should be very high this year, Richmond and Indianapolis (15.8% each) have the lowest percentage of adults who watched last year's tournament. Cinderella Team Market Snapshots Richmond, VA Home market of: Richmond Spiders, VCU Rams Sweet 16 opponents: Kansas, Florida State The top two segments in Richmond representing 30% of the market's households are: Metro Minority Communities (18.1%) comprised of married couples and single-parent minorities earning above average incomes from a mix of service industry and white-collar jobs in transportation, health care, education, and public administration. Urban Commuter Families (11.5%) comprised of upscale, college educated Baby Boomer families and couples living in single detached homes in city neighborhoods on the metropolitan fringe. Other interesting facts: Most over-represented segment is Metro Minority Communities (3.8 times the national average) Percent of adults with interest in college basketball is 26.7% Percent of adults who watched last year's men's college basketball tournament is 15.8% Tallahassee, FL Home market of: Florida State Seminoles Sweet 16 opponent: VCU Rams Similar to Richmond, the top two segments in Tallahassee are Metro Minority Communities (14.8%) and Urban Commuter Families (6.9%). The two segments that account for the next highest share of households are: Struggling City Centers (6.7%) comprised of young, single and single-parent minority renters living in low-income city neighborhoods. Rural Southern Living (6.5%) comprised of lower-income blue-collar couples and families living in sparsely settled mobile home communities. Other interesting facts: Most over-represented market segment is College Town Communities (6.2 times the national average) Percent of adults with interest in college basketball is 26.9% Percent of adults who watched last year's men's college basketball tournament is 16.8% Milwaukee, WI Home market of: Marquette Golden Eagles Sweet 16 opponent: North Carolina Tarheels The top segment in Milwaukee representing 11.2% of households is Urban Commuter Families (as described above). The two segments that account for the next highest share of households are: Small-town Success (10.5%) comprised of white collar, college educated, middle-aged working couples living in newly developed subdivisions outside the nation's beltways. Steadfast Conservative (9.3%) comprised of high-school educated mature singles and couples living in middle-class urban blue-collar neighborhoods. Other interesting facts: Most over-represented market segment is Successful Suburbia (3.6 times the national average) Percent of adults with interest in college basketball is 28.1% Percent of adults who watched last year's men's college basketball tournament is 17.3% Indianapolis, IN Home market of: Butler Bulldogs Sweet 16 opponent: Wisconsin Badgers There are four equal size segments that account for just over 30% of Indianapolis households. These include Steadfast Conservative (8.9%), Urban Commuter Families (7.8%), and Small-town Success (7.1%). All three of these segments are also among the top five in Richmond, Tallahassee, and Milwaukee. What makes Indianapolis unique from the other three markets is a higher percentage of New Suburbia Families (7.2%). These are young, affluent working couples with pre-school children concentrated in fast-growing, metro fringe communities. Other interesting facts: Most over-represented market segment is Successful Suburbia (2.8 times the national average) Percent of adults with interest in college basketball is 26.3% Percent of adults who watched last year's men's college basketball tournament is 15.8%

Tournament play begins this week in the 2011 NCAA Men's Division I Basketball Tournament, which means office productivity is likely to take a hit as fans jump online to watch live streams of games being played during working hours. With online viewing options expanded to mobile and other digital platforms this year, fans have more avenues than ever to get their March Madness fix. In fact, according to a recent estimate by Challenger, Gray & Christmas, total online tournament viewership during work hours is likely to reach 8.4 million hours during this year's tournament. In this latest installment of Experian Marketing Services' continuing March Madness consumer coverage, we'll profile the work life of online game streamers. Is there one down the hall or in the next cube? The answer is almost certainly “yes,” but the “who” may surprise you. According to Experian Simmons, just over 5% of all U.S. adults and nearly a quarter of adult NCAA men's tournament viewers (24%) qualify as likely online game streamers. For the purpose of this analysis, likely online game streamers is defined as those U.S. adults who watched the last NCAA men's basketball tournament who also sought out sports information online or watched online video in the last 30 days. These likely online game streamers must have also visited either cbssports.com or espn.com in the last 30 days. Fully 79% of likely online game streamers are employed either full-or or part-time, with 59% working 40 or more hours a week. Department managers and IT staff-have reason to be concerned about a loss in productivity during March Madness: fully 79% of likely online game streamers are employed either full-or or part-time, with 59% working 40 or more hours a week. Don't be so quick to suspect that colleague who always shows up late and goes home early as a game streamer. A safer bet would be the guy who's always at his desk when you get in and still there when you head out. In fact, one-in-ten adults who work more than 40 hours a week (11%) are likely online game streamers, meaning they're more than twice as likely as the average adult to be checking out the game online. Remote employees who work at home often get a bad rap with office “suits” sometimes assuming their pajama-clad colleagues fall prey to distractions. Actually though, Americans who work from home are no more or less likely to be likely online streamers than those who don't work from home. Likewise, the self-employed are no more or less likely to be online game streamers than laborers who work for “the man.” Interestingly, Experian Simmons found a direct correlation between company size and a worker's chance of being a likely online game streamer. Specifically: Those who work in companies with fewer than 100 employees are 17% less likely than the average American worker to be likely online game streamers. Those who work in companies with between 100 and 499 employees are just two percent less likely than average to be likely streamers while those employed by companies with between 500 and 999 employees are eight percent more likely to be online game streamers. Employees of companies with 1,000 or more employees are the most likely culprits with the group on average being 17% more likely to be likely online game streamers. As such, it's no surprise that Fortune 500 companies are the most at risk of having offices full of online streamers during March Madness. Employees of Fortune 500 companies are fully 66% more likely to be online game streamers than those who Americans employed by a non-Fortune 500 company. Finally, the best insight into whether your office mates are streaming basketball games online instead of working is by looking at their paycheck (not that we encourage that of course). Specifically, as income rises, so does one's chance of being an online game streamer: Employed Americans who personally earn less than $25,000 annually are the least likely to be online game streamers, scoring 50% below average on this metric. Those who earn between $25,000 and $49,999 are only 15% less likely to be game streamers. If you know or suspect that your colleague earns upwards of $50,000 a year, it's a good idea to keep an eye on them for the rest of the month; workers with incomes between $50,000 and $74,999 are 33% more likely than average to be likely game streamers and those who earn between $75,000 and $99,999 are 75% more likely to be likely game streamers. Your colleagues earning $100,000 or more annually are the most likely to be streaming online, with those personally taking home between $100,000 and $149,000 being a whopping 164% more likely than the average employee to be streaming games online. And those earning $150,000 or more annually being fully 176% more likely to be online game streamers. Moreover, one-in-five adults who earn $150,000 a year or more fall into our likely online game streamers segment compared with just 5% of all U.S. adults. The first match-up to be played during the traditional workday tips off at 12:15 EDT on Thursday March 17th when West Virginia takes on the winner of the second round-one play-in game. Armed with this information, you should be able to catch-or join-your office's online game streamers in the act.