
The holiday season is almost here, and knowing how each generation plans to shop can give your holiday advertising campaigns the edge you need. Our recent survey of 1,000 U.S. consumers reveals 2024 holiday shopping trends for each generation and key insights into their anticipated spending levels, preferred shopping categories, and how they look for gift ideas.
In this blog post, we’ll explore three 2024 holiday shopping trends across generations:
- Projected consumer spending
- Top categories on shoppers’ lists
- Preferred channels for researching gifts
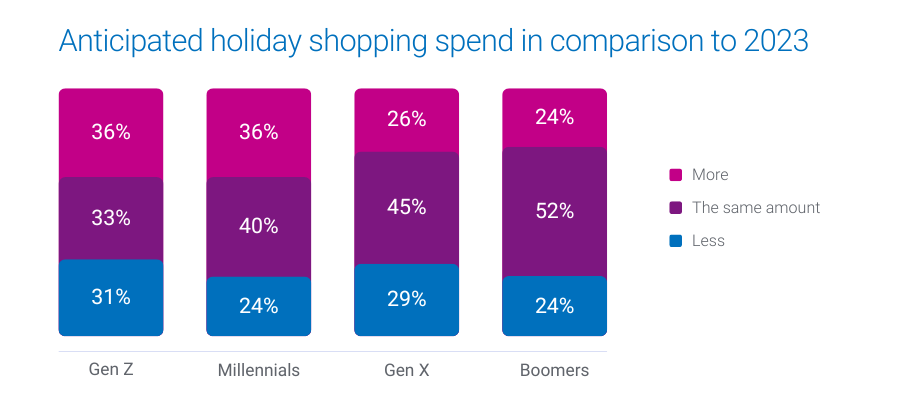
1. Projected consumer spending
Over 1 in 3 Gen Z and Millennials are gearing up to increase their holiday budgets this year, while Gen X and Boomers are likelier to stick to last year’s budget.
- 36% of Millennials and Gen Z plan to spend more this holiday season
- 45% of Gen X and 52% of Boomers expect their spending to remain consistent with last year
What this means for marketers
These insights highlight the importance of tailoring your messaging. For Gen Z and Millennials, emphasize value and unique offerings that justify increased spending. For Gen X and Boomers, focus on trust and reliability, reinforcing their confidence in your brand.
How Experian can help you target these audiences
Experian’s custom and syndicated audience segments, including Holiday Shopper High Spenders and Holiday Shopper Moderate Spenders, enable you to connect with these diverse consumer groups. Our audiences are available on-the-shelf of leading ad platforms to help you reach people across social, TV, and mobile.
The election effect
U.S. holiday retail sales saw 4.1% YoY growth in 2016 and 8.3% YoY growth in 2020 following presidential elections. There’s a chance that holiday spending increases after the 2024 election, regardless of the outcome. Experian has 240+ politically relevant audiences that you can activate across major ad platforms ahead of the upcoming election.
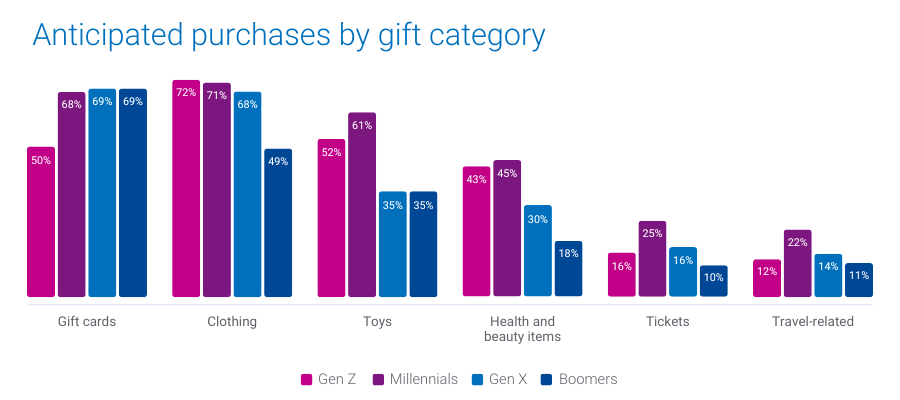
2. Top categories on shoppers’ lists
Different generations have distinct preferences when it comes to what they plan to buy. Gift cards top the list for Gen X and Boomers, while Gen Z leans toward clothing. Millennials are looking to splurge on toys, electronics, and experiences.
- 69% of Boomers and Gen X plan to purchase gift cards
- 72% of Gen Z will buy clothing
- 45% of Millennials will buy health and beauty items
- 25% of Millennials will buy tickets and 22% of Millennials will buy experiences
What this means for marketers
Align your product offerings and promotions with each generation’s preferences to capture their attention. For example, highlighting versatile gift cards may resonate more with older generations, while showcasing trendy apparel and tech gadgets will appeal to younger consumers.
How Experian can help you target these shoppers
We offer audience segments like Holiday Shoppers: Apparel, Cosmetics & Beauty Spenders, and Toys Shoppers that you can activate to connect with consumers primed to purchase in these categories.
We recently released 19 new holiday shopping audiences we recommend targeting to drive engagement and conversions. Download our audience recommendations here.
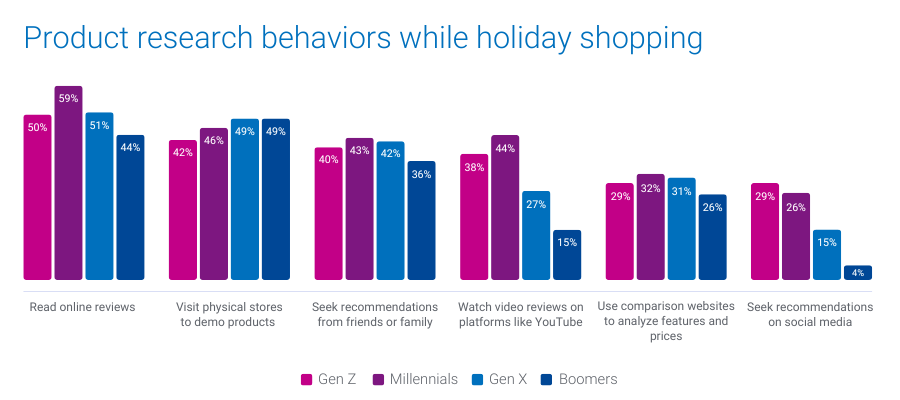
3. Preferred channels for researching gift ideas
When it comes to finding the perfect gifts, Gen Z turns to social media, while Millennials prefer online reviews and video content. Boomers and Gen X are more inclined to visit physical stores for hands-on product evaluations.
- 29% of Gen Z and 26% of Millennials will look for gift ideas on social media
- 44% of Millennials will rely on video reviews and product demos on platforms like YouTube
- 49% of Gen X and Boomers plan to visit physical stores to evaluate products in person
What this means for marketers
Understanding where each generation looks for inspiration can guide your content and ad placement strategy. To engage Gen Z, focus on social media campaigns and influencer partnerships. For Millennials, consider investing in video content and reviews. For older generations, ensure your in-store experience is optimized to convert browsing into purchases.
How Experian can help you engage these shoppers
Our TrueTouchTM audiences can help you pair the perfect messaging styles with the right channels and calls to action. Our Social media channel and content engagement audiences can help you reach Gen Z who are likely to be active users on major social platforms and are Black Friday shoppers. For a full list of Experian’s syndicated audiences and activation destinations, download our syndicated audiences guide.
Download our report for five 2024 holiday shopping trends by generation
Understanding 2024 holiday shopping trends by generation can help you tailor your targeting, messaging, media planning, and creative based on the generation you’re targeting.
In addition to the insights covered here, download our 2024 Holiday spending trends and insights report to learn:
- When consumers plan to shop (hint: they’re already shopping)
- Where they plan to shop (online vs. in-store)
Download our full report to access all five of our predictions by generation, so you can address the diverse needs of this year’s holiday shoppers.
When you work with Experian for your holiday shopping campaigns, you’re getting:
- Accurate consumer insights: Better understand your customers’ behavioral and demographic attributes with our #1 ranked data covering the full U.S. population.
- Signal-agnostic identity solutions: Our deep understanding of people in the offline and digital worlds provides you with a persistent linkage of personally identifiable information (PII) data and digital IDs, ensuring you accurate cross-device targeting, addressability and measurement.
- Secure connectivity: Bring data and identity to life in a way that meets your needs by securely sharing data between partners, utilizing the integrations we have across the ecosystem, and using our marketing data in flexible ways.
Make the most of this holiday shopping season with Experian. Contact us today to get started.
Source
Online survey conducted in June, 2024 among n=1,000 U.S. adults 18+. Sample balanced to look like the general population on key demographics (age, gender, household income, ethnicity, and region).
Latest posts

Is online group buying a fad or a significant change in the way we buy online? Here are three things that you should know about this phenomenon.
Two storied franchises will collide in this year’s Super Bowl, the Green Bay Packers and the Pittsburgh Steelers. Sports fans from both markets are huge supporters of their football teams, but a look into their behavior and attitudes reveals passions beyond a one-dimensional Cheesehead or Towel Twirler. Considering the vast preferences, marketers recognize the need to define characteristics that truly distinguish their target audience, thus, this article delves further into the hearts and houses of Green Bay and Pittsburgh area residents.
Americans are still spending more time on Twitter.com than ever before. According to Experian Simmons estimates, Americans spent an estimated 2 hours and 12 minutes tweeting and reading tweets on Twitter.com in November 2010.