
The holiday season is almost here, and knowing how each generation plans to shop can give your holiday advertising campaigns the edge you need. Our recent survey of 1,000 U.S. consumers reveals 2024 holiday shopping trends for each generation and key insights into their anticipated spending levels, preferred shopping categories, and how they look for gift ideas.
In this blog post, we’ll explore three 2024 holiday shopping trends across generations:
- Projected consumer spending
- Top categories on shoppers’ lists
- Preferred channels for researching gifts
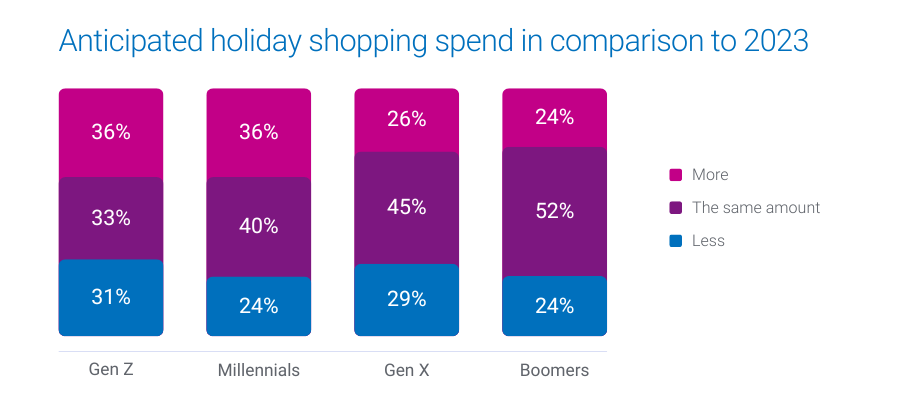
1. Projected consumer spending
Over 1 in 3 Gen Z and Millennials are gearing up to increase their holiday budgets this year, while Gen X and Boomers are likelier to stick to last year’s budget.
- 36% of Millennials and Gen Z plan to spend more this holiday season
- 45% of Gen X and 52% of Boomers expect their spending to remain consistent with last year
What this means for marketers
These insights highlight the importance of tailoring your messaging. For Gen Z and Millennials, emphasize value and unique offerings that justify increased spending. For Gen X and Boomers, focus on trust and reliability, reinforcing their confidence in your brand.
How Experian can help you target these audiences
Experian’s custom and syndicated audience segments, including Holiday Shopper High Spenders and Holiday Shopper Moderate Spenders, enable you to connect with these diverse consumer groups. Our audiences are available on-the-shelf of leading ad platforms to help you reach people across social, TV, and mobile.
The election effect
U.S. holiday retail sales saw 4.1% YoY growth in 2016 and 8.3% YoY growth in 2020 following presidential elections. There’s a chance that holiday spending increases after the 2024 election, regardless of the outcome. Experian has 240+ politically relevant audiences that you can activate across major ad platforms ahead of the upcoming election.
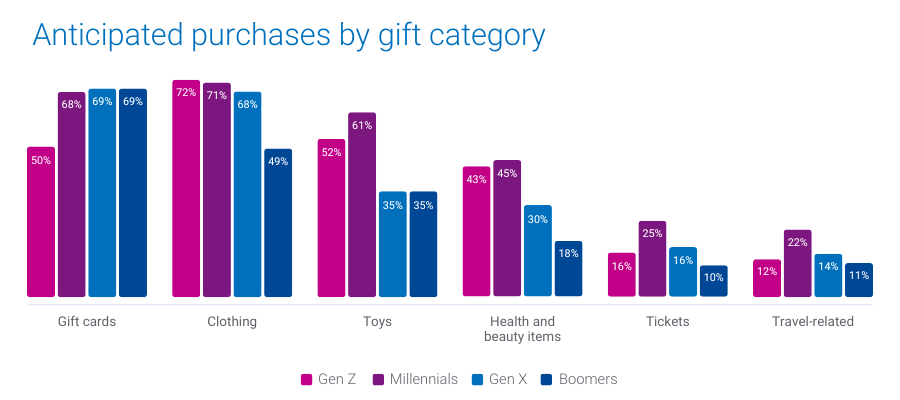
2. Top categories on shoppers’ lists
Different generations have distinct preferences when it comes to what they plan to buy. Gift cards top the list for Gen X and Boomers, while Gen Z leans toward clothing. Millennials are looking to splurge on toys, electronics, and experiences.
- 69% of Boomers and Gen X plan to purchase gift cards
- 72% of Gen Z will buy clothing
- 45% of Millennials will buy health and beauty items
- 25% of Millennials will buy tickets and 22% of Millennials will buy experiences
What this means for marketers
Align your product offerings and promotions with each generation’s preferences to capture their attention. For example, highlighting versatile gift cards may resonate more with older generations, while showcasing trendy apparel and tech gadgets will appeal to younger consumers.
How Experian can help you target these shoppers
We offer audience segments like Holiday Shoppers: Apparel, Cosmetics & Beauty Spenders, and Toys Shoppers that you can activate to connect with consumers primed to purchase in these categories.
We recently released 19 new holiday shopping audiences we recommend targeting to drive engagement and conversions. Download our audience recommendations here.
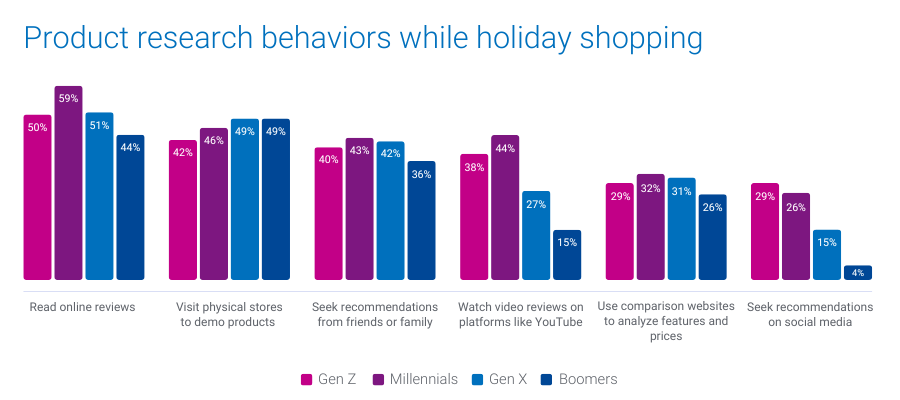
3. Preferred channels for researching gift ideas
When it comes to finding the perfect gifts, Gen Z turns to social media, while Millennials prefer online reviews and video content. Boomers and Gen X are more inclined to visit physical stores for hands-on product evaluations.
- 29% of Gen Z and 26% of Millennials will look for gift ideas on social media
- 44% of Millennials will rely on video reviews and product demos on platforms like YouTube
- 49% of Gen X and Boomers plan to visit physical stores to evaluate products in person
What this means for marketers
Understanding where each generation looks for inspiration can guide your content and ad placement strategy. To engage Gen Z, focus on social media campaigns and influencer partnerships. For Millennials, consider investing in video content and reviews. For older generations, ensure your in-store experience is optimized to convert browsing into purchases.
How Experian can help you engage these shoppers
Our TrueTouchTM audiences can help you pair the perfect messaging styles with the right channels and calls to action. Our Social media channel and content engagement audiences can help you reach Gen Z who are likely to be active users on major social platforms and are Black Friday shoppers. For a full list of Experian’s syndicated audiences and activation destinations, download our syndicated audiences guide.
Download our report for five 2024 holiday shopping trends by generation
Understanding 2024 holiday shopping trends by generation can help you tailor your targeting, messaging, media planning, and creative based on the generation you’re targeting.
In addition to the insights covered here, download our 2024 Holiday spending trends and insights report to learn:
- When consumers plan to shop (hint: they’re already shopping)
- Where they plan to shop (online vs. in-store)
Download our full report to access all five of our predictions by generation, so you can address the diverse needs of this year’s holiday shoppers.
When you work with Experian for your holiday shopping campaigns, you’re getting:
- Accurate consumer insights: Better understand your customers’ behavioral and demographic attributes with our #1 ranked data covering the full U.S. population.
- Signal-agnostic identity solutions: Our deep understanding of people in the offline and digital worlds provides you with a persistent linkage of personally identifiable information (PII) data and digital IDs, ensuring you accurate cross-device targeting, addressability and measurement.
- Secure connectivity: Bring data and identity to life in a way that meets your needs by securely sharing data between partners, utilizing the integrations we have across the ecosystem, and using our marketing data in flexible ways.
Make the most of this holiday shopping season with Experian. Contact us today to get started.
Source
Online survey conducted in June, 2024 among n=1,000 U.S. adults 18+. Sample balanced to look like the general population on key demographics (age, gender, household income, ethnicity, and region).
Latest posts

Same-sex marriage is a hot button topic no matter on which side of the issue you stand. But there can be no denying that same-sex couples are finding an expanding number of options in the U.S. and abroad should they decide to legally wed. The 2010 LGBT Consumer Report explores the household arrangements and behaviors of America's LGBT consumers—in particular, those associated with marriage—compared to America's heterosexual population. You will learn that despite being less than half as likely to be married, lesbian, gay and bisexual adults are 22% more likely than their "straight" counterparts to have recently wed or to be planning nuptials for the next year. Looking for that perfect gift for the newly wed couple? You will also get some shopping tips for identifying favored retailers of lesbian, gay and bisexual shoppers. We'll start by sizing the LGBT market. An estimated 3.7% of the non-Hispanic adult population (7.1 million adults) self-identifies as LGBT, which can be broken down as follows: The average heterosexual adult lives in a household with 1.9 other individuals, including adults and kids. By comparison, the average lesbian shares her home with only 1.6 other people. Gay men live in the smallest households, sharing their home with only one other person, on average. Over a third of gay or bisexual men (38%) share their home with at least one other adult male, compared with only 24% of heterosexual men who live under the same roof as another adult male. Thirty-five percent of gay or bisexual men say they live with one (and only one) other adult male, a living arrangement that has a higher chance of consisting of a same-sex, co-habiting couple. Over half of lesbians or bisexual women (53%) share their home with at least one other adult female, compared with only 23% of heterosexual women who live under the same roof as another adult female. Forty-three percent of lesbian or bisexual women say they live with one (and only one) other adult female, a living arrangement that has a higher chance of consisting of a same-sex, co-habiting couple. Lesbian, Gay and Bisexual adults (LGB) as a group are less than half as likely as heterosexuals to be married. Only 26% of LGB adults are wed, compared with 57% of “straight” adults. Of all LGB adults, bisexuals are the most likely group to be married, with over 4 in 10 reporting they are presently wed. Lesbians are more than four and a half times more likely than gay men to be married, with 23% of lesbians having tied the knot versus only 5% of gay men. Lesbian, gay and bisexual adults as a group are 22% more likely than heterosexual adults to have either tied the knot in the last 12 months or have plans to wed in the coming year. 5.7% of lesbian, gay or bisexual adults are newly weds or “soonly” weds vs. 4.6% of heterosexual adults. Lesbian, gay and bisexual adults are twice as likely to shop at Neiman Marcus, making the department store the number one retailer with a wedding registry program among LGB shoppers. With many retailers ending their registry programs in favor of gift cards, we looked at how stores without registry programs stack up among lesbian, gay and bisexual shoppers. LGB adults are almost twice as likely to shop at J. Crew, making the store the number one retailer without a wedding registry program among LGB shoppers.
With the 82nd Academy Awards® just around the corner and only days before final voting ballots are due back to accounting firm PricewaterhouseCoopers, Experian Simmons is taking a close look at the American movie-going population. In any given month, over 56 million adults (26% of the adult population) make a trip to the cinema to take in a film. Movie-going typically reaches its peak in mid-summer, and 2009 was no exception. Experian Simmons DataStreamSM reports that in July of last year, 32% of adults went to movies, the highest level observed at any point in the year. In October of the same year, the percentage of past-month adult cinema-goers had dropped to just 19%, the lowest point observed in all of 2009. In this month’s Consumer Insights report, Experian Simmons sizes the movie-going audience, examines their receptivity to cinema ads—including pre-show commercials and product placement within films—online movie searches as well as Americans’ penchant for tuning into the Academy Awards. All data comes from the Simmons Summer 2009 National Consumer Study. Two-thirds of the adult population have gone to the movies at least once in the last 6 months. Nearly half (46%) have been in the last 90 days and a quarter (26%) have been in the last month. Young adults are, as expected, more likely to go to the movies than older adults, but adults over 50 outnumber young adults when it comes to raw number of movie-goers as you will see in the following chart. Over 147 million individuals have gone to the movies at least once in the last 6 months. With 20.8 million adults ages 18 to 24 going to the movies in the last 6 months, this age group accounts for only 14% of the movie-going population. Adults ages 50 and over, on the other hand, account for 37% of the movie-going population with over 55 million adults in this age group going to the theater at least once in the last 6 months. Among all adults who had been to the movies at least once in the last 6 months, 68% have been at least once in the last 30 days. Many movie-goers (39%) have been only once in the last month and only 7% have been four or more times. Young adults ages 18 to 24 are much more likely than the average movie-goer to have been to the theater in the last month with 75% reporting having been at least once and 10% having been 4 times or more. Experian Simmons DataStreamSM reports similar trends in past 30 day movie-going for 2008 and 2009 with the peak for this behavior occurring in both years on almost the exact same date. During the week of July 22, 2009 32% of adults reported having been to the theater during the last 30 days and during the week of July 21, 2008, 29% reported going. Cinema Blockbusters that month in ’09 included Bruno and Harry Potter and the Half-Blood Prince. In July of ’08, Mama Mia and The Dark Knight were released. When it comes to product placement in movies, frequent cinema-goers are most likely to respond. In fact, 41% of adults who went to the movies 4 or more times in the last 90 days are classified by the Simmons Movie Product Placement segmentation system as “Emulators,” those consumers who notice, remember and are driven to buy products placed into the context of a film. By comparison, only 28% of consumers who went to a movie only once in the last 90 days are Emulators. Forty-eight percent of Horror film fans say they often pay attention to commercials that show along with movie previews in movie theaters making them the most receptive to cinema advertisements followed by Romantic Comedy fans and Family movie fans. Only 39% of Foreign Language or Independent film fans say they pay attention to such ads. Nearly a quarter of all movie-goers get movie information, reviews or show times online in any given month. Aside from the obvious movie sites, you are likely to find movie information seekers on these sites: Californians like foreign language and independent films, whereas New Englanders have more of a penchant for Comedies and Southerners are among the most likely to see Horror films. Below are the top 5 metro areas for finding adults who say they usually see the three selected movie genres when they go to the theater. One-in-seven American adults tuned into the last Academy Awards® ceremony on ABC, including many non-movie-goers. Nine percent of adults who had not been to the movies even once in the past six months tuned into the last awards show and ultimately comprised 19% of all 2009 Oscar® viewers. Still, the more frequently a consumer goes to the movies, the more likely he or she is to watch the annual Academy Awards® ceremony.