Loading...

From appetizer to main course: A taste of 2025’s marketing trends

Published: January 28, 2025 by Hayley Schneider

Three 2025 trends to spice up your marketing strategy

Agencies, platforms, and marketers stand at the crossroads of transformation, as privacy regulations tighten, technology accelerates, and consumer behaviors evolve. Yet these challenges also present extraordinary opportunities.

Our 2025 Digital trends and predictions report highlights five trends that will shape 2025 and digs into:

  • What’s changing in the market
  • How to keep learning about your customers
  • How to reach your customers in different places
  • How to measure what’s really working along the way

In this blog post, we’ll give you a sneak peek of three of these trends — from cracking the code of signal loss to tapping into the buzz around connected TV (CTV) and stepping up your omnichannel game. Think of it as a taste test before the main course. Ready for the full menu? Download our report to get the lowdown on all five trends.

1. Signal loss: A rich appetizer of alternate ingredients

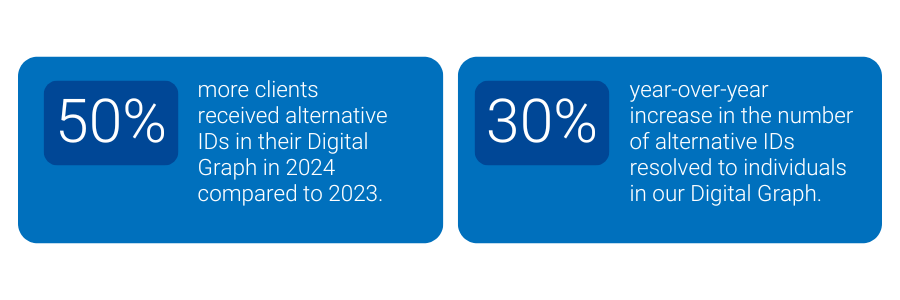
As traditional cookies crumble, marketers need fresh ingredients to keep the flavor coming. Already, about 40% of browser traffic doesn’t support third-party cookies, and marketers are spicing things up with first-party data, alternative identifiers like Unified I.D. 2.0 (UID2) and ID5, and contextual targeting strategies. In fact, 50% more of our clients received alternative IDs (UID2, ID5, Hadron ID) in their Digital Graph in 2024 compared to 2023. The number of alternative IDs resolved to individuals in our Digital Graph increased by 30% year-over-year – as everyone looks beyond the cookie jar.

50% more clients received alternative IDs in their Digital Graph in 2024 compared to 2023. 30% year-over-year increase in the number of alternative IDs resolved to individuals in our Digital Graph.

There is no secret sauce to replace cookies. Instead, expect a multi-ID recipe that brings together different identifiers, unified by an identity graph. This approach turns a fragmented pantry of data into a cohesive meal, giving you a complete view of your customer on every plate.

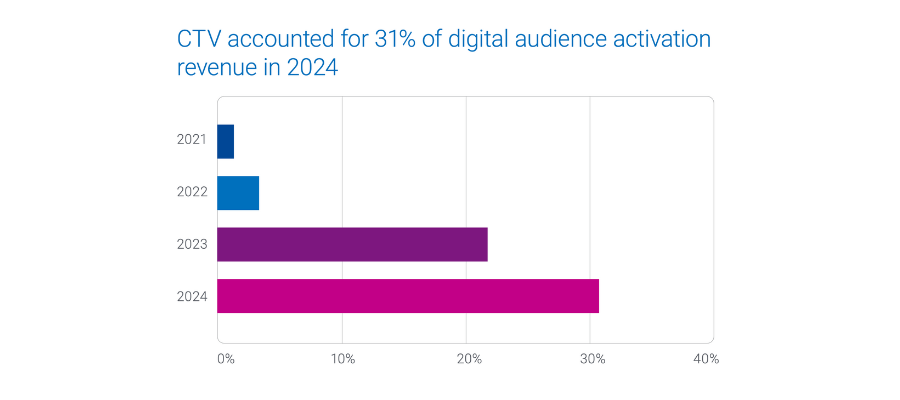
2. The rising power of CTV: A hearty entrée of opportunities

CTV is quickly becoming the main dish on the streaming menu, as viewers load up on their favorite shows. While CTV is slated to make up 20% of daily U.S. media consumption by 2026, advertisers are still holding back on pouring in the ad spend. To unlock its full flavor, marketers need to whip up solutions like frequency capping and unified audience activation.

Although CTV will account for 20% of daily U.S. media consumption by 2026, it’s projected to command only 8.1% of ad spend. Frequency capping and unified audience activation solutions will be key to unlocking CTV’s full potential.

A chart that shows connected TV (CTV) accounted for 31% of digital audience activation revenue in 2024

By 2025, nearly half of CTV “diners” will choose free ad-supported streaming TV (FAST). Marketers need strategies to prevent ad overexposure. With 50% of U.S. consumers avoiding products due to ad overload, and 30% of marketers willing to increase their CTV spend if frequency capping improves, unified identity solutions help ensure every impression is served just right.

3. Omnichannel: A flavorful fusion plate

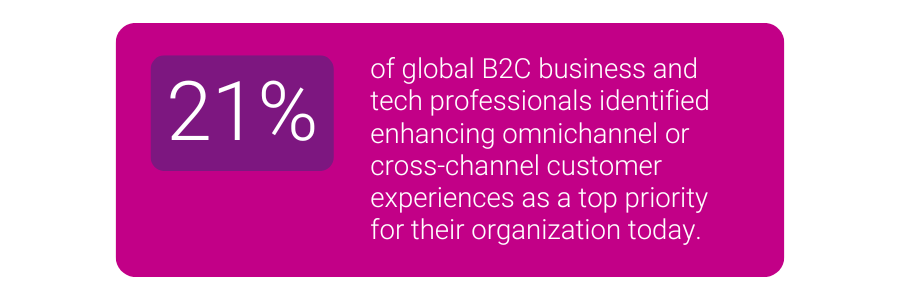
No one likes a one-flavor meal. Marketers are moving beyond single-channel “side dishes” to omnichannel “fusion feasts” that blend direct mail, digital, CTV, and retail media networks (RMNs) into a truly cohesive culinary experience. Even though only 21% of global B2C professionals currently put omnichannel at the top of their shopping list, the growing demand for seamless, audience-first campaigns is heating up.

21% of global B2C business and tech professionals identified embracing omnichannel or cross-channel customer experiences as a top priority for their organization today.

In 2025, having an audience-first approach will be like having a perfect pairing for every course. Unified identity solutions act as your master sommelier, ensuring that each channel complements the next, and every customer enjoys a well-rounded, memorable journey.

Vertical trends: A dessert sampler from four unique kitchens

Different markets have their own signature flavors.

  • In Auto, crossover utility vehicles (CUVs) claim 51% of new vehicle registrations, and consumers in the 35-54 age group and families are the primary buyers. Automotive marketers should prioritize CUV advertising with a strong focus on family-oriented and income-appropriate messaging
  • In Financial Services, marketers need to anticipate shifts in consumer behavior tied to economic conditions, such as increasing demand for deposit products when interest rates are high. For insurance, aligning campaigns with life events, like new home purchases or marriage, can maximize engagement.
  • In Healthcare, advertisers are prioritizing personalized, regulation-compliant campaigns that address social determinants of health (SDOH).
  • In Retail, advertisers are increasingly activating on both CTV and social platforms, with many managing their own in-house campaigns. While larger brands often rely on media agencies, a shift toward in-house media buying is emerging among some bigger players, offering more control over audience targeting and performance metrics.

Our report covers each vertical’s unique menu, helping you select the right “ingredients” for your customers. With the top Experian Audiences on hand, you can create feasts that delight, nourish, and convert.

Hungry for more? Download our full menu

The three “samples” you’ve just tasted are just the starters. Our 2025 Digital trends and predictions report serves up five insights, complete with strategies, data, and tools to help you adapt, scale, and thrive in 2025.

Ready for the full menu? Download our report now and discover all five trends that will shape your marketing “cookbook” in 2025. Bon appétit!


Latest posts

Loading…
The Marketing Bowl: Packers vs. Steelers

Two storied franchises will collide in this year’s Super Bowl, the Green Bay Packers and the Pittsburgh Steelers. Sports fans from both markets are huge supporters of their football teams, but a look into their behavior and attitudes reveals passions beyond a one-dimensional Cheesehead or Towel Twirler. Considering the vast preferences, marketers recognize the need to define characteristics that truly distinguish their target audience. To provide those insights, we conducted a detailed market analysis using a wide variety of data sources including research information from Experian Simmons, Hitwise, and the Mosaic Consumer Lifestyle segmentation solution, which defines the predominant household types for each area (as featured in yesterday’s post: Cheeseheads vs. Terrible Towels). Today, we delve further into the hearts and houses of Green Bay and Pittsburgh area residents. GREEN BAY FANS PACK THEM IN FOR TAILGATING Green Bay area residents are more passionate about tailgating compared to their rivals in Pittsburgh. Among those who identify themselves as NFL football fans, Green Bay fans are 1.45 times more likely than Pittsburgh fans to have participated in a tailgate party within the past 12 months. They are also better equipped to tailgate due to a higher ownership rate for midsize SUVs, and both light duty and full size pickups (Road & Track magazine top-rated picks for tailgating), compared to Pittsburgh fans. STELLA AND STEELERS GO TOGETHER With every tailgate comes a beverage of choice, and in today’s analysis we’ve found that Bud Light and Budweiser are the light/low calorie and regular domestic brands of beer favored the most by both Green Bay and Pittsburgh fans. However, Pittsburgh fans are 1.56 times more likely than Green Bay fans to down a few of premium brand, Stella Artois. Notably, along with its best selling brands, Anheuser-Busch plans to devote a portion of its multi-million dollar ad spend to this Belgian import. FANTASIZING ABOUT FOOTBALL While all that tailgating is going on, Green Bay fans might also be boasting about their latest fantasy sports selections. They are 1.34 times more likely to say that they participate in a fantasy sports league compared to Pittsburgh fans. That’s not to say that Pittsburgh fans don’t enjoy their fantasy sports, indexing above the national average for visiting fantasy sports and football websites. PLAYING IN THE GREAT OUTDOORS Packers and Steelers fans enjoy being out in the elements, so chances are you’ll probably never see a dome over either Lambeau or Heinz Field. The most popular Green Bay football fan activities, with a higher participation rate compared to Pittsburgh fans, are: golfing, camping, state fairs, hunting, power boating and motorcycling. In the Pittsburgh area, with its impressive network of recreational trails, residents are 1.23 times more likely to in-line/roller skate and are 1.36 times more likely to play hockey, compared to Green Bay. Off land analysis shows that despite Green Bay residents’ close proximity to Lake Michigan and a multitude of water sport opportunities, Pittsburgh fans are more likely to spend time on the water, namely: canoeing, kayaking, sailing, and fly fishing. THROWING DEEP VERSUS HANDING OFF Each year Super Bowl advertisers try to reach their audiences across broadly defined demographics with little ability to measure the direct impact of their super-sized investments. It’s the equivalent of throwing a “Hail Mary” and hoping the receiver will leap above the clutter of defenders and catch the ball. Direct marketers, however, are using the behavioral and attitudinal data we’ve shared here to deliver their messages to a precisely targeted sub-audience. For marketers who want to be relevant and target accurately, this capability is the playmaker that scores a game winning touchdown every time. Click here for the full article Blog post author: Bill Schneider, VP, Experian Marketing Services. We’d love to hear your stories and how you’ve used lifestyle data. Please leave your comments or feedback below.

Feb 03,2011 by

Americans Spend 2 Hours, 12 Minutes Per Month on Twitter.com

According to weekly trend data from Experian Simmons DataStreamSM, the number of U.S. adults paying a monthly visit to microblogging site Twitter.com has fallen during the past year by 14%. As of November 29, 2010, 8.25 million adults had made at least one visit to Twitter.com during the previous 30 days, down from 9.54 million adults who had visited the site in the 30 days prior to November 30, 2009. Does this mean the ultimate “fail whale” is lurking just over the horizon for Twitter? Not just yet. Among those who visit Twitter.com, Simmons DataStream shows that the average number of visits per month rose a relative 37% in the last year. Twitter.com visits in late November 2010, in fact, reached an average of 10.0 visits per month, up from just 7.3 visits per month the year prior. As visit frequency increased, however, the duration of the average Twitter.com session declined, suggesting visitors today are seeking more frequent quick hits, rather than spending longer periods of time reading through posts. According to Experian Hitwise, the average amount of time Twitter.com visitors spend on the site during a typical session fell to 13 minutes, 12 seconds on November 27, 2010, down from an average of 15 minutes, 12 seconds spent on the site each session on November 28, 2009. That said, Americans are still spending more time on Twitter.com than ever before. According to Experian Simmons estimates, Americans spent an estimated 2 hours and 12 minutes tweeting and reading tweets on Twitter.com in November 2010, up from 1 hour and 51 minutes spent on the site during November 2009. Swim on, fail whale, swim on. To tweet this blog post, click on the green “retweet” button at the top of this item. For more information on Simmons DataStream weekly reporting of nearly 40,000 consumer variables, visit our website.

Jan 25,2011 by

The Top Drinking Cities in the U.S.

As we ring in the New Year this week, Americans will be tossing back a few adult beverages in celebration. While alcohol consumption certainly increases around holidays and other times of celebration, many Americans imbibe year-round. So where across this great land of ours are you most likely to find adults willing and able to raise a glass (or two) and where are you most likely to be surrounded by teetotalers? Experian Simmons has the answer. Leveraging data from our SimmonsLOCAL study, we examined the drinking patterns of adults of legal drinking age in the 106 Designated Market Areas (DMAs) with populations of at least 500,000 adults age 21 and older.  We then ranked those markets by the number of alcoholic beverages consumed by the average adult during a typical month. The chart below lists the DMAs that consume the most alcoholic beverages per capita in a typical month. First place goes to Boston, where the average adult of legal drinking age regularly kicks back 14.4 drinks a month. (Celebrations in Beantown are probably already underway.) Rank DMA Average drinks per month 1 Boston 14.4 2 Austin 13.8 3 Providence-New Bedford 13.4 4 Madison 13.2 4 Hartford & New Haven 13.2 6 Philadelphia 13.1 7 Chicago 13 8 Denver 12.9 9 Tallahassee-Thomasville 12.8 9 Milwaukee 12.8 11 Minneapolis-St. Paul 12.6 11 West Palm Beach-Ft. Pierce 12.6 11 Seattle-Tacoma 12.6 11 Tucson (Sierra Vista) 12.6 15 Green Bay-Appleton 12.5 16 San Diego 12.4 16 Baltimore 12.4 16 Washington, DC 12.4 16 Albany-Schenectady-Troy 12.4 20 New Orleans 12.3 20 St. Louis 12.3 20 Colorado Springs-Pueblo 12.3 23 Burlington-Plattsburgh 12.2 23 Syracuse 12.2 23 Norfolk-Portsmouth-Newport News 12.2 23 Spokane 12.2 23 Portland-Auburn 12.2 Source: Experian Simmons Adult residents of the markets listed below surely know how to have a good time-it's just unlikely to include a cocktail. The chart below lists the DMAs that consume the fewest alcoholic beverages per capita in a typical month. Residents of Chattanooga consume only 6 alcoholic beverages per month, on average, making it the least imbibing market-and probably the one that feels the best the morning after a big gathering. Rank DMA Average drinks per month 106 Chattanooga 6 105 Salt Lake City 7.2 105 Florence-Myrtle Beach 7.2 105 Charleston-Huntington 7.2 105 Tri-Cities, TN-VA 7.2 101 Knoxville 7.4 100 Lexington 7.9 99 Birmingham 8 98 Huntsville-Decatur 8.5 97 Nashville 8.9 97 Evansville 8.9 95 Paducah-Cape Girardeau-Harrisburg-Mt Vernon 9.1 94 Springfield, MO 9.2 94 Tulsa 9.2 94 Greenville-New Bern-Washington 9.2 91 Memphis 9.3 90 Greenville-Spartanburg-Asheville-Anderson 9.4 90 Jackson, MS 9.4 90 Wichita-Hutchinson Plus 9.4 86 Little Rock-Pine Bluff 9.5 86 Louisville 9.5 86 Ft. Smith-Fayetteville-Springdale-Rogers 9.5 83 Fresno-Visalia 9.6 82 Greensboro-High Point-Winston Salem 9.7 82 Roanoke-Lynchburg 9.7 Source: Experian Simmons For more information on SimmonsLOCAL's vivid reporting of consumer behaviors, attitudes, lifestyles and media consumption in 209 Designated Market Areas down to the ZIP code level, visit our website.

Dec 29,2010 by

Subscribe to our newsletter

Enter your name and email for the latest updates

This site is protected by reCAPTCHA and the Google Privacy Policy and Terms of Service apply.

About Experian Marketing Services

At Experian Marketing Services, we use data and insights to help brands have more meaningful interactions with people. As leaders in the evolution of the advertising landscape, Experian Marketing Services can help you identify your customers and the right potential customers, uncover the most appropriate communication channels, develop messages that resonate, and measure the effectiveness of marketing activities and campaigns.

Visit our website

Subscribe to our newsletter

Stay up to date on the latest industry news and receive expert tips from our marketing experts.
Subscribe now!