
Agencies, platforms, and marketers stand at the crossroads of transformation, as privacy regulations tighten, technology accelerates, and consumer behaviors evolve. Yet these challenges also present extraordinary opportunities.
Our 2025 Digital trends and predictions report highlights five trends that will shape 2025 and digs into:
- What’s changing in the market
- How to keep learning about your customers
- How to reach your customers in different places
- How to measure what’s really working along the way
In this blog post, we’ll give you a sneak peek of three of these trends — from cracking the code of signal loss to tapping into the buzz around connected TV (CTV) and stepping up your omnichannel game. Think of it as a taste test before the main course. Ready for the full menu? Download our report to get the lowdown on all five trends.
1. Signal loss: A rich appetizer of alternate ingredients
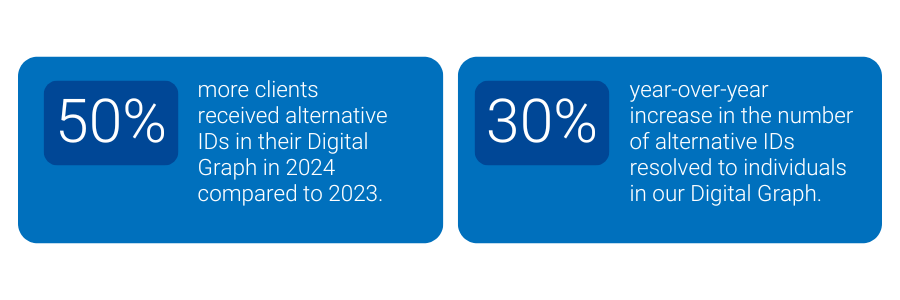
As traditional cookies crumble, marketers need fresh ingredients to keep the flavor coming. Already, about 40% of browser traffic doesn’t support third-party cookies, and marketers are spicing things up with first-party data, alternative identifiers like Unified I.D. 2.0 (UID2) and ID5, and contextual targeting strategies. In fact, 50% more of our clients received alternative IDs (UID2, ID5, Hadron ID) in their Digital Graph in 2024 compared to 2023. The number of alternative IDs resolved to individuals in our Digital Graph increased by 30% year-over-year – as everyone looks beyond the cookie jar.
There is no secret sauce to replace cookies. Instead, expect a multi-ID recipe that brings together different identifiers, unified by an identity graph. This approach turns a fragmented pantry of data into a cohesive meal, giving you a complete view of your customer on every plate.
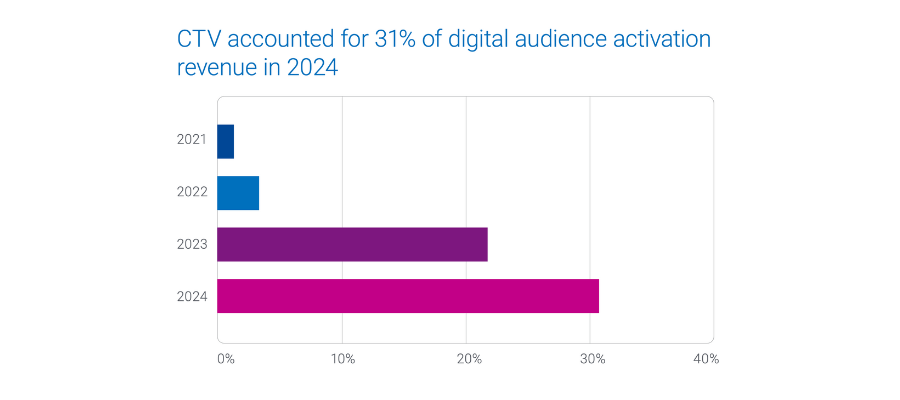
2. The rising power of CTV: A hearty entrée of opportunities
CTV is quickly becoming the main dish on the streaming menu, as viewers load up on their favorite shows. While CTV is slated to make up 20% of daily U.S. media consumption by 2026, advertisers are still holding back on pouring in the ad spend. To unlock its full flavor, marketers need to whip up solutions like frequency capping and unified audience activation.
Although CTV will account for 20% of daily U.S. media consumption by 2026, it’s projected to command only 8.1% of ad spend. Frequency capping and unified audience activation solutions will be key to unlocking CTV’s full potential.
By 2025, nearly half of CTV “diners” will choose free ad-supported streaming TV (FAST). Marketers need strategies to prevent ad overexposure. With 50% of U.S. consumers avoiding products due to ad overload, and 30% of marketers willing to increase their CTV spend if frequency capping improves, unified identity solutions help ensure every impression is served just right.
3. Omnichannel: A flavorful fusion plate
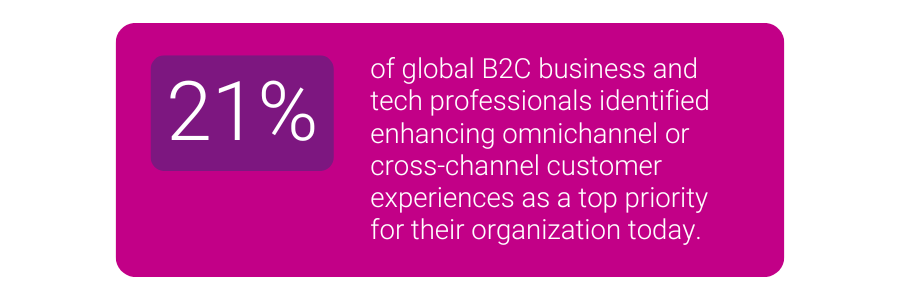
No one likes a one-flavor meal. Marketers are moving beyond single-channel “side dishes” to omnichannel “fusion feasts” that blend direct mail, digital, CTV, and retail media networks (RMNs) into a truly cohesive culinary experience. Even though only 21% of global B2C professionals currently put omnichannel at the top of their shopping list, the growing demand for seamless, audience-first campaigns is heating up.
In 2025, having an audience-first approach will be like having a perfect pairing for every course. Unified identity solutions act as your master sommelier, ensuring that each channel complements the next, and every customer enjoys a well-rounded, memorable journey.
Vertical trends: A dessert sampler from four unique kitchens
Different markets have their own signature flavors.
- In Auto, crossover utility vehicles (CUVs) claim 51% of new vehicle registrations, and consumers in the 35-54 age group and families are the primary buyers. Automotive marketers should prioritize CUV advertising with a strong focus on family-oriented and income-appropriate messaging
- In Financial Services, marketers need to anticipate shifts in consumer behavior tied to economic conditions, such as increasing demand for deposit products when interest rates are high. For insurance, aligning campaigns with life events, like new home purchases or marriage, can maximize engagement.
- In Healthcare, advertisers are prioritizing personalized, regulation-compliant campaigns that address social determinants of health (SDOH).
- In Retail, advertisers are increasingly activating on both CTV and social platforms, with many managing their own in-house campaigns. While larger brands often rely on media agencies, a shift toward in-house media buying is emerging among some bigger players, offering more control over audience targeting and performance metrics.
Our report covers each vertical’s unique menu, helping you select the right “ingredients” for your customers. With the top Experian Audiences on hand, you can create feasts that delight, nourish, and convert.
Hungry for more? Download our full menu
The three “samples” you’ve just tasted are just the starters. Our 2025 Digital trends and predictions report serves up five insights, complete with strategies, data, and tools to help you adapt, scale, and thrive in 2025.
Ready for the full menu? Download our report now and discover all five trends that will shape your marketing “cookbook” in 2025. Bon appétit!
Latest posts

Same-sex marriage is a hot button topic no matter on which side of the issue you stand. But there can be no denying that same-sex couples are finding an expanding number of options in the U.S. and abroad should they decide to legally wed. The 2010 LGBT Consumer Report explores the household arrangements and behaviors of America's LGBT consumers—in particular, those associated with marriage—compared to America's heterosexual population. You will learn that despite being less than half as likely to be married, lesbian, gay and bisexual adults are 22% more likely than their "straight" counterparts to have recently wed or to be planning nuptials for the next year. Looking for that perfect gift for the newly wed couple? You will also get some shopping tips for identifying favored retailers of lesbian, gay and bisexual shoppers. We'll start by sizing the LGBT market. An estimated 3.7% of the non-Hispanic adult population (7.1 million adults) self-identifies as LGBT, which can be broken down as follows: The average heterosexual adult lives in a household with 1.9 other individuals, including adults and kids. By comparison, the average lesbian shares her home with only 1.6 other people. Gay men live in the smallest households, sharing their home with only one other person, on average. Over a third of gay or bisexual men (38%) share their home with at least one other adult male, compared with only 24% of heterosexual men who live under the same roof as another adult male. Thirty-five percent of gay or bisexual men say they live with one (and only one) other adult male, a living arrangement that has a higher chance of consisting of a same-sex, co-habiting couple. Over half of lesbians or bisexual women (53%) share their home with at least one other adult female, compared with only 23% of heterosexual women who live under the same roof as another adult female. Forty-three percent of lesbian or bisexual women say they live with one (and only one) other adult female, a living arrangement that has a higher chance of consisting of a same-sex, co-habiting couple. Lesbian, Gay and Bisexual adults (LGB) as a group are less than half as likely as heterosexuals to be married. Only 26% of LGB adults are wed, compared with 57% of “straight” adults. Of all LGB adults, bisexuals are the most likely group to be married, with over 4 in 10 reporting they are presently wed. Lesbians are more than four and a half times more likely than gay men to be married, with 23% of lesbians having tied the knot versus only 5% of gay men. Lesbian, gay and bisexual adults as a group are 22% more likely than heterosexual adults to have either tied the knot in the last 12 months or have plans to wed in the coming year. 5.7% of lesbian, gay or bisexual adults are newly weds or “soonly” weds vs. 4.6% of heterosexual adults. Lesbian, gay and bisexual adults are twice as likely to shop at Neiman Marcus, making the department store the number one retailer with a wedding registry program among LGB shoppers. With many retailers ending their registry programs in favor of gift cards, we looked at how stores without registry programs stack up among lesbian, gay and bisexual shoppers. LGB adults are almost twice as likely to shop at J. Crew, making the store the number one retailer without a wedding registry program among LGB shoppers.
With the 82nd Academy Awards® just around the corner and only days before final voting ballots are due back to accounting firm PricewaterhouseCoopers, Experian Simmons is taking a close look at the American movie-going population. In any given month, over 56 million adults (26% of the adult population) make a trip to the cinema to take in a film. Movie-going typically reaches its peak in mid-summer, and 2009 was no exception. Experian Simmons DataStreamSM reports that in July of last year, 32% of adults went to movies, the highest level observed at any point in the year. In October of the same year, the percentage of past-month adult cinema-goers had dropped to just 19%, the lowest point observed in all of 2009. In this month’s Consumer Insights report, Experian Simmons sizes the movie-going audience, examines their receptivity to cinema ads—including pre-show commercials and product placement within films—online movie searches as well as Americans’ penchant for tuning into the Academy Awards. All data comes from the Simmons Summer 2009 National Consumer Study. Two-thirds of the adult population have gone to the movies at least once in the last 6 months. Nearly half (46%) have been in the last 90 days and a quarter (26%) have been in the last month. Young adults are, as expected, more likely to go to the movies than older adults, but adults over 50 outnumber young adults when it comes to raw number of movie-goers as you will see in the following chart. Over 147 million individuals have gone to the movies at least once in the last 6 months. With 20.8 million adults ages 18 to 24 going to the movies in the last 6 months, this age group accounts for only 14% of the movie-going population. Adults ages 50 and over, on the other hand, account for 37% of the movie-going population with over 55 million adults in this age group going to the theater at least once in the last 6 months. Among all adults who had been to the movies at least once in the last 6 months, 68% have been at least once in the last 30 days. Many movie-goers (39%) have been only once in the last month and only 7% have been four or more times. Young adults ages 18 to 24 are much more likely than the average movie-goer to have been to the theater in the last month with 75% reporting having been at least once and 10% having been 4 times or more. Experian Simmons DataStreamSM reports similar trends in past 30 day movie-going for 2008 and 2009 with the peak for this behavior occurring in both years on almost the exact same date. During the week of July 22, 2009 32% of adults reported having been to the theater during the last 30 days and during the week of July 21, 2008, 29% reported going. Cinema Blockbusters that month in ’09 included Bruno and Harry Potter and the Half-Blood Prince. In July of ’08, Mama Mia and The Dark Knight were released. When it comes to product placement in movies, frequent cinema-goers are most likely to respond. In fact, 41% of adults who went to the movies 4 or more times in the last 90 days are classified by the Simmons Movie Product Placement segmentation system as “Emulators,” those consumers who notice, remember and are driven to buy products placed into the context of a film. By comparison, only 28% of consumers who went to a movie only once in the last 90 days are Emulators. Forty-eight percent of Horror film fans say they often pay attention to commercials that show along with movie previews in movie theaters making them the most receptive to cinema advertisements followed by Romantic Comedy fans and Family movie fans. Only 39% of Foreign Language or Independent film fans say they pay attention to such ads. Nearly a quarter of all movie-goers get movie information, reviews or show times online in any given month. Aside from the obvious movie sites, you are likely to find movie information seekers on these sites: Californians like foreign language and independent films, whereas New Englanders have more of a penchant for Comedies and Southerners are among the most likely to see Horror films. Below are the top 5 metro areas for finding adults who say they usually see the three selected movie genres when they go to the theater. One-in-seven American adults tuned into the last Academy Awards® ceremony on ABC, including many non-movie-goers. Nine percent of adults who had not been to the movies even once in the past six months tuned into the last awards show and ultimately comprised 19% of all 2009 Oscar® viewers. Still, the more frequently a consumer goes to the movies, the more likely he or she is to watch the annual Academy Awards® ceremony.