Experian, the leader in powering data-driven advertising through connectivity, is thrilled to unveil our latest solution, Digital Graph and Marketing Attributes. This joint solution supplies marketers and platforms with the insights and connectivity needed to understand who their customers are and reach them across digital channels.
The uncertainty around third-party cookies in Chrome and the overall decline in signal complicates the industry’s ability to reach the right consumer. Omnichannel media consumption results in scattered data, making it harder for marketers and platforms to understand consumer behavior and reach them across channels. These challenges call for a comprehensive solution.
Our Digital Graph and Marketing Attributes solution addresses these challenges by providing identifiers for seamless cross-channel engagement. By adding Marketing Attributes, like demographic and behavioral data, marketers and platforms also gain a better understanding of their customers. This solution uses Experian’s Living Unit ID (LUID) to combine offline and digital data, giving customers deeper insights into consumer behavior, greater audience reach, and improved cross-channel visibility.
Benefits of Digital Graph and Marketing Attributes
Both our Digital Graph and Marketing Attributes provide value to clients as standalone products. When clients license our Digital Graph and Marketing Attributes joint solution, they have more data at their fingertips, unlocking:
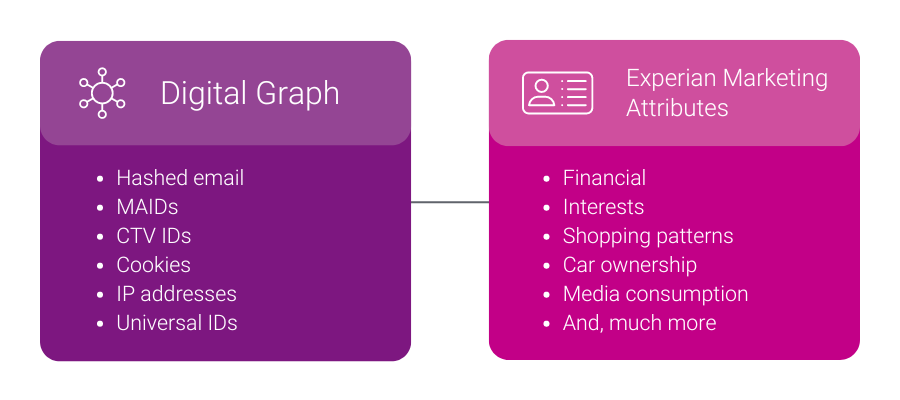
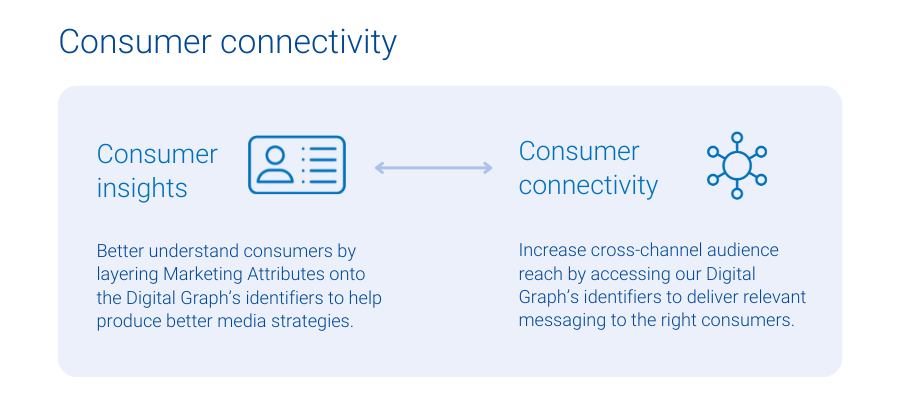
- Consumer connectivity: When clients license Experian’s Digital Graph, they get access to digital identifiers like mobile ad IDs (MAIDs), connected TV (CTV) IDs, hashed emails (HEMs), and universal IDs so they can target the right consumers with the relevant messages across all digital media channels.
- Consumer insights: Experian’s 5,000 Marketing Attributes provide our clients with detailed consumer information and insights, such as age, gender, purchase behaviors, and content consumption habits. Marketing Attributes help clients create more relevant messaging and informed audience segmentation.
Client examples
How OpenX offers richer targeting and more connectivity with Experian
OpenX is an independent omni-channel supply-side platform (SSP) and a global leader in audience, data, and identity-targeting. With industry-leading technology, exceptional client service, and extensive scalability across all formats, including CTV, app, mobile web, and desktop, OpenX has a legacy of innovating products that enhance buyer outcomes and publisher revenue while addressing complex challenges in programmatic.
In recent years, OpenX has licensed Experian’s Digital Graph with identifiers, contributing to the SSP’s largest independent supply-side identity graph, which offers advanced audiences to buyers and improved data resolution to content owners.
More recently, OpenX licensed Experian’s Marketing Attributes to enrich its supply-side identity graph, which includes IPs, MAIDs, and client IDs, with a variety of attributes. This strategic move has helped OpenX’s clients benefit from enhanced consumer insights and addressability, in turn delivering greater reach to the demand side and higher revenue for publishers, despite industry signal loss.
“We built on our long-term partnership with Experian to enrich our digital IDs with Experian’s Marketing Attributes, which help provide buyers better insights to audiences, thereby helping our publishers monetize their inventory. With partners like Experian, OpenX effectively facilitates the value exchange between demand and supply, ensuring our partners are able to drive results for their business in the era of signal loss”
Craig Golaszewski, Sr. Director of Strategic Partnerships, OpenX
How StackAdapt licenses our product bundle to address three different use cases
StackAdapt is the multi-channel programmatic advertising platform trusted by marketers to deliver exceptional campaigns. They drive superior results through a variety of solutions, like contextual and first-party targeting, brand lift measurement, and optimization through insights.
StackAdapt licensed a similar yet unique product combination, our Digital Graph and our Audiences. StackAdapt uses the Digital Graph to allow clients to onboard their first-party data in a seamless, self-serve manner that allows them to further segment their data using Experian Audiences.
“StackAdapt has been recognized as the most trusted programmatic platform by marketers, and with the integration of Experian’s Digital Graph and Audiences, we are strengthening our leadership in the space. This partnership improves our ability to deliver precise cross-channel segmentation, reach, and measurement, helping advertisers run more successful campaigns. Our collaboration with Experian allows us to offer a differentiated solution in the market and ensure our clients can deliver the most precise and impactful ads to their audiences.”
Denis Loboda, Senior Director of Data, StackAdapt
We recently announced a new partnership with StackAdapt. This collaboration brings the power of Experian’s identity graph, syndicated and custom audiences directly to the StackAdapt platform. Read the full details in our press release here.
Four ways to use Digital Graph and Marketing Attributes
When these two products come together, our clients have a 360-degree view of their consumers, which helps them power four critical use cases:
- Analytics and insights: Learn more about your consumers by connecting our Marketing Attributes with our Digital Graph’s identifiers. For example, a retailer can discover that their recent customers over-index as pickleball fans and players, leading the retailer to sponsor a professional pickleball event.
- Inventory monetization: When supply-side partners know their audience better, they can attract advertisers in search of that audience. For example, a publisher might find out that their audience is full of pickleball fans, leading them to reach out to brands that want to reach this audience.
- Activation: Companies with access to more digital identifiers from our Digital Graph can reach more people, while controlling frequency across channels. A company might know that they want to reach pickleball fans. Now, they have the digital identifiers needed to reach pickleball fans across all digital channels where they consume content, leading to increased reach.
- Measurement and attribution: Use the Digital Graph’s support for various digital identifiers to understand all consumer touchpoints, from media impressions to conversions. Then, lean on our Marketing Attributes to determine who your messaging resonated with. For example, a company uses our Digital Graph to know if it was the same individual who was exposed to an ad on CTV and converted via e-commerce. On top of that, the company can use our Marketing Attributes data to find out that the people who purchased were overwhelmingly pickleball fans.
Connect with us to learn more about how our Digital Graph and Marketing Attributes joint solution can provide the data and insights you need to create, activate, and measure cross-channel media campaigns.
Latest posts

New data from Experian Marketing Services’ Simmons® ConnectSM mobile and digital panel sheds light on the way smartphone users spend time using their phone, with the average adult clocking 58 minutes daily on their device. On average, smartphone owners devote 26% of the time they spend on their phone talking and another 20% texting. Social networking eats up 16% of smartphone time while browsing the mobile web accounts for 14% of time spent. Emailing and playing games account for roughly 9% and 8% of daily smartphone time, respectively, while use of the phone’s camera and GPS each take up another 2% of our smartphone day. *Activities include use of a smartphone’s native features dedicated to each activity as well as downloaded apps whose primary function falls under the given activity. For instance, “watch video” includes the act of watching video on the smartphone’s native video player as well as use of video apps such as YouTube, Netflix, etc. iPhone versus Android users Smartphone users may constantly debate which operating system is supreme, but we see clear differences between the ways consumers use their phone depending on the operating system that runs it. For starters, iPhone users spend an hour and fifteen minutes using their phones per day, a full 26 minutes more than the typical Android phone owner. Additionally, iPhone and Android smartphone owners use their phones in markedly different ways. For instance, 28% of the time that Android users spend using their phones is dedicated to talking, whereas iPhone users spend only 22% of their smartphone time talking on the device. Android owners also devote a greater share of time visiting websites on their phone than iPhone owners. On the other hand, iPhone owners spend a disproportionately greater share of smartphone time than Android owners texting, emailing, using the camera and social networking. Note on time spent It may surprise some to read that an activity like watching video accounts for such a small share (less than 1%) of the typical adult’s daily smartphone use. However, for the charts above to sum to a single daily total it was necessary to calculate individual activity contribution using a base of all smartphone owners, including those who don’t spend any time engaging in a given activity during a typical day. The chart below provides additional insights into the time spent engaging in the major smartphone activities examining only those individuals who engaged in each activity during a 24-hour period. I’ve also added into the chart a reach and frequency metric to indicate the popularity of each activity and the number of times per day that individuals engage in them. In the chart, the activities with the largest bubbles are those in which the greatest share of smartphone owners engage during a typical day and include the usual suspects: talking (79%), texting (76%), visiting websites (62%), emailing (61%) and social networking (52%). Activities with the fewest daily participants are: watching video, which 2.3% of smartphone owners do during a typical day, and reading, which just 0.5% of smartphone owners do daily. Given that nearly 98% of smartphone users don’t watch videos on their phone during a typical day, it’s easier to understand why video comprises such a low share of the average adult’s daily smartphone use. However, the chart above reveals that those who do watch video on their phone spend, on average, 5 minutes a day watching videos spread out over 4.2 different viewing sessions. For more information on consumers’ usage of smartphones, digital tablets, computers and other traditional and digital media platforms, check out Simmons Connect.
New health information exchanges are prompting data quality efforts, as state and local healthcare agencies look to electronically share patient data.
If the time spent on the Internet for personal computers was distilled into an hour then 27 percent of it would be spent on social networking and forums across the United States, United Kingdom and Australia. In the U.S., 16 minutes out of every hour online is spent on social networking and forums, nine minutes on entertainment sites and five minutes shopping. Global comparison In the UK, 13 minutes out of every hour online is spent on social networking and forums, nine minutes on entertainment sites and six minutes shopping. Australian Internet users spend 14 minutes on social sites, nine on entertainment and four minutes shopping online. Across all three markets, time spent shopping online grew year-over-year, but the UK market emerged as having the most prolific online shoppers, spending proportionally more time on retail Websites than online users in the U.S. or Australia. British Internet users spent 10 percent of all time online shopping in 2012, compared to nine percent in the U.S. and six percent in Australia. This was in part due to a bumper winter holiday season in the UK where 370 million hours were spent shopping online, 24 percent higher than the monthly average. Consumption of news content also increased across all three markets with Australian users emerging as the most voracious consumers of news online. Six percent of all time spent online in Australia in 2012 was on a news Website, compared to five percent in the UK and four percent in the U.S. Meanwhile, the time spent on social media proportionate to other online activities declined across all three regions. The U.S., which has been the most dominant market for social media consumption in the last three years dropped from 30 percent of all time spent online to 27 percent. In Australia time spent on social dropped from 27 percent to 24 percent while in the UK it dipped from 25 percent to 22 percent year-over-year. This highlights the rise in access via 3G and 4G networks as consumers spend increasingly more time online while on the move. "Understanding consumer behavior across channels is more important than ever as more visits are being made on the move, particularly among social networking and email,” says Bill Tancer, general manager of global research for Experian Marketing Services. "With smartphones and tablets becoming more powerful, our data clearly indicates the difference between mobile and traditional desktop usage further enabling the ‘always on’ consumer mentality. Marketers need to understand these differences, as well as regionally, to ensure campaigns can be tailored for better and more effective engagement.” Mobile browsing When looking at the U.S. browsing data for mobile devices, email accounted for the largest time spent on average, for the same categories for Q1 2013. Email made up 23 percent of time spent on mobile devices for Q1-13, while social networking accounted for 15 percent. Entertainment had the third highest time spent with 13 percent, followed by shopping with 11 percent and travel with 9 percent. The mobile data does not include app usage, but does include mobile browsing within an app. Read more of the latest consumer trends in The 2013 Digital Marketer Report Learn more about consumer online behavior by visiting our Online Trends page Learn more about the author, Matt Tatham