
Experian, the leader in powering data-driven advertising through connectivity, is thrilled to unveil our latest solution, Digital Graph and Marketing Attributes. This joint solution supplies marketers and platforms with the insights and connectivity needed to understand who their customers are and reach them across digital channels.
The uncertainty around third-party cookies in Chrome and the overall decline in signal complicates the industry’s ability to reach the right consumer. Omnichannel media consumption results in scattered data, making it harder for marketers and platforms to understand consumer behavior and reach them across channels. These challenges call for a comprehensive solution.
Our Digital Graph and Marketing Attributes solution addresses these challenges by providing identifiers for seamless cross-channel engagement. By adding Marketing Attributes, like demographic and behavioral data, marketers and platforms also gain a better understanding of their customers. This solution uses Experian’s Living Unit ID (LUID) to combine offline and digital data, giving customers deeper insights into consumer behavior, greater audience reach, and improved cross-channel visibility.
Benefits of Digital Graph and Marketing Attributes
Both our Digital Graph and Marketing Attributes provide value to clients as standalone products. When clients license our Digital Graph and Marketing Attributes joint solution, they have more data at their fingertips, unlocking:
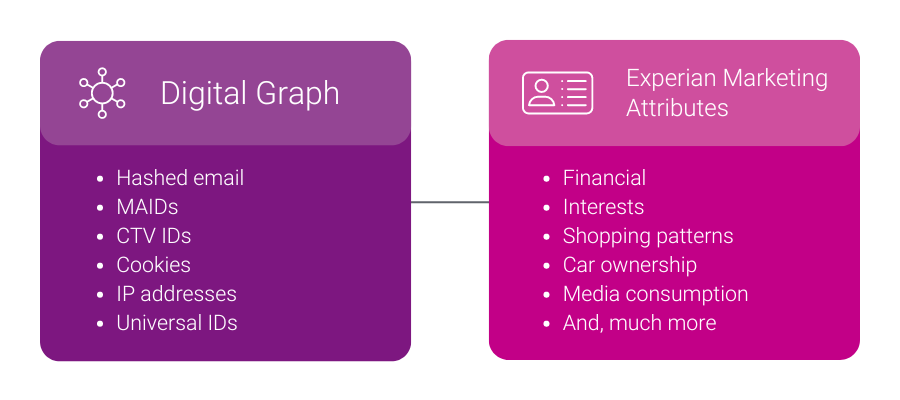
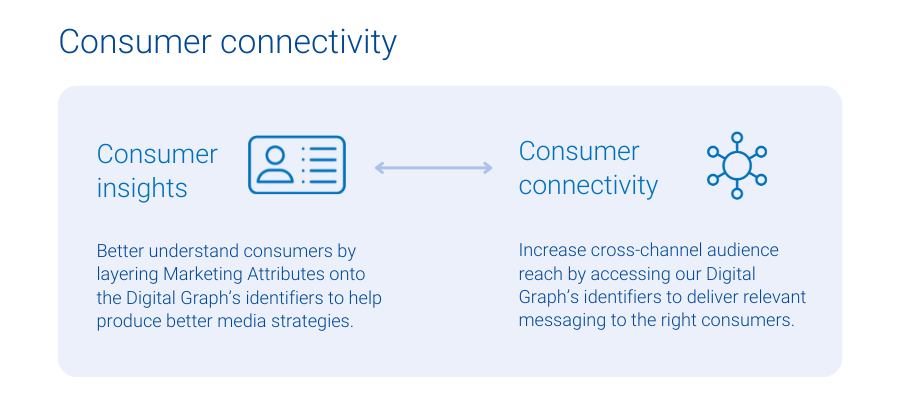
- Consumer connectivity: When clients license Experian’s Digital Graph, they get access to digital identifiers like mobile ad IDs (MAIDs), connected TV (CTV) IDs, hashed emails (HEMs), and universal IDs so they can target the right consumers with the relevant messages across all digital media channels.
- Consumer insights: Experian’s 5,000 Marketing Attributes provide our clients with detailed consumer information and insights, such as age, gender, purchase behaviors, and content consumption habits. Marketing Attributes help clients create more relevant messaging and informed audience segmentation.
Client examples
How OpenX offers richer targeting and more connectivity with Experian
OpenX is an independent omni-channel supply-side platform (SSP) and a global leader in audience, data, and identity-targeting. With industry-leading technology, exceptional client service, and extensive scalability across all formats, including CTV, app, mobile web, and desktop, OpenX has a legacy of innovating products that enhance buyer outcomes and publisher revenue while addressing complex challenges in programmatic.
In recent years, OpenX has licensed Experian’s Digital Graph with identifiers, contributing to the SSP’s largest independent supply-side identity graph, which offers advanced audiences to buyers and improved data resolution to content owners.
More recently, OpenX licensed Experian’s Marketing Attributes to enrich its supply-side identity graph, which includes IPs, MAIDs, and client IDs, with a variety of attributes. This strategic move has helped OpenX’s clients benefit from enhanced consumer insights and addressability, in turn delivering greater reach to the demand side and higher revenue for publishers, despite industry signal loss.
“We built on our long-term partnership with Experian to enrich our digital IDs with Experian’s Marketing Attributes, which help provide buyers better insights to audiences, thereby helping our publishers monetize their inventory. With partners like Experian, OpenX effectively facilitates the value exchange between demand and supply, ensuring our partners are able to drive results for their business in the era of signal loss”
Craig Golaszewski, Sr. Director of Strategic Partnerships, OpenX
How StackAdapt licenses our product bundle to address three different use cases
StackAdapt is the multi-channel programmatic advertising platform trusted by marketers to deliver exceptional campaigns. They drive superior results through a variety of solutions, like contextual and first-party targeting, brand lift measurement, and optimization through insights.
StackAdapt licensed a similar yet unique product combination, our Digital Graph and our Audiences. StackAdapt uses the Digital Graph to allow clients to onboard their first-party data in a seamless, self-serve manner that allows them to further segment their data using Experian Audiences.
“StackAdapt has been recognized as the most trusted programmatic platform by marketers, and with the integration of Experian’s Digital Graph and Audiences, we are strengthening our leadership in the space. This partnership improves our ability to deliver precise cross-channel segmentation, reach, and measurement, helping advertisers run more successful campaigns. Our collaboration with Experian allows us to offer a differentiated solution in the market and ensure our clients can deliver the most precise and impactful ads to their audiences.”
Denis Loboda, Senior Director of Data, StackAdapt
We recently announced a new partnership with StackAdapt. This collaboration brings the power of Experian’s identity graph, syndicated and custom audiences directly to the StackAdapt platform. Read the full details in our press release here.
Four ways to use Digital Graph and Marketing Attributes
When these two products come together, our clients have a 360-degree view of their consumers, which helps them power four critical use cases:
- Analytics and insights: Learn more about your consumers by connecting our Marketing Attributes with our Digital Graph’s identifiers. For example, a retailer can discover that their recent customers over-index as pickleball fans and players, leading the retailer to sponsor a professional pickleball event.
- Inventory monetization: When supply-side partners know their audience better, they can attract advertisers in search of that audience. For example, a publisher might find out that their audience is full of pickleball fans, leading them to reach out to brands that want to reach this audience.
- Activation: Companies with access to more digital identifiers from our Digital Graph can reach more people, while controlling frequency across channels. A company might know that they want to reach pickleball fans. Now, they have the digital identifiers needed to reach pickleball fans across all digital channels where they consume content, leading to increased reach.
- Measurement and attribution: Use the Digital Graph’s support for various digital identifiers to understand all consumer touchpoints, from media impressions to conversions. Then, lean on our Marketing Attributes to determine who your messaging resonated with. For example, a company uses our Digital Graph to know if it was the same individual who was exposed to an ad on CTV and converted via e-commerce. On top of that, the company can use our Marketing Attributes data to find out that the people who purchased were overwhelmingly pickleball fans.
Connect with us to learn more about how our Digital Graph and Marketing Attributes joint solution can provide the data and insights you need to create, activate, and measure cross-channel media campaigns.
Latest posts

Cell phone ownership among American adults is 91% and 98% among young adults. Verizon and AT&T will almost certainly continue to dominate the market, especially given the fact that cell phone subscribers are increasingly staying with their provider for an extended period of time.
The popularity of flash sale websites with limited time & inventory offerings have grown exponentially over the two years. Online shoppers’ love for the thrill of snagging designer clothing, home décor, travel and even wine have caused visits to the category to increase 368% in July 2011 as compared to the same month two years ago and 109% one year ago. So far in 2011, Nordstrom acquired HauteLook, Amazon entered the fray with MyHabit and recently Saks Fifth Avenue announced the launch of a dedicated flash sale website after offering sale events per week on Saks’ main website. In July 2011, Zulily.com, a website offering sales targeted for women and babies/kids, captured the highest market share of visits at 16%, followed by Ideeli and LivingSocial Escapes. Amazon’s MyHabit ranked 11th, out of the 87 websites in the custom category after only 2 months in operation. Several of the major players over the past six months, the total visits to Ideeli increased 42%, Gilt.com up 14% and Nordstrom’s Hautelook up 8% for July 2011 as compared to February 2011. Total visits for MyHabit jumped 128% for July 2011 as compared to May 2011 when the website launched. The audience for Flash Sales continues to be attractive, and willing to shop – over-indexing against the online population for household incomes over $100k and creditworthy VantageScores of A and B.
The most effective way to segment a back-to-school audience is to include basic data elements with a segmentation methodology that recognizes the lifestyle and behavioral differences among households containing school-aged children. Experian’s Mosaic lifestyle segmentation solution can provide key insights into this lucrative audience.