
Experian, the leader in powering data-driven advertising through connectivity, is thrilled to unveil our latest solution, Digital Graph and Marketing Attributes. This joint solution supplies marketers and platforms with the insights and connectivity needed to understand who their customers are and reach them across digital channels.
The uncertainty around third-party cookies in Chrome and the overall decline in signal complicates the industry’s ability to reach the right consumer. Omnichannel media consumption results in scattered data, making it harder for marketers and platforms to understand consumer behavior and reach them across channels. These challenges call for a comprehensive solution.
Our Digital Graph and Marketing Attributes solution addresses these challenges by providing identifiers for seamless cross-channel engagement. By adding Marketing Attributes, like demographic and behavioral data, marketers and platforms also gain a better understanding of their customers. This solution uses Experian’s Living Unit ID (LUID) to combine offline and digital data, giving customers deeper insights into consumer behavior, greater audience reach, and improved cross-channel visibility.
Benefits of Digital Graph and Marketing Attributes
Both our Digital Graph and Marketing Attributes provide value to clients as standalone products. When clients license our Digital Graph and Marketing Attributes joint solution, they have more data at their fingertips, unlocking:
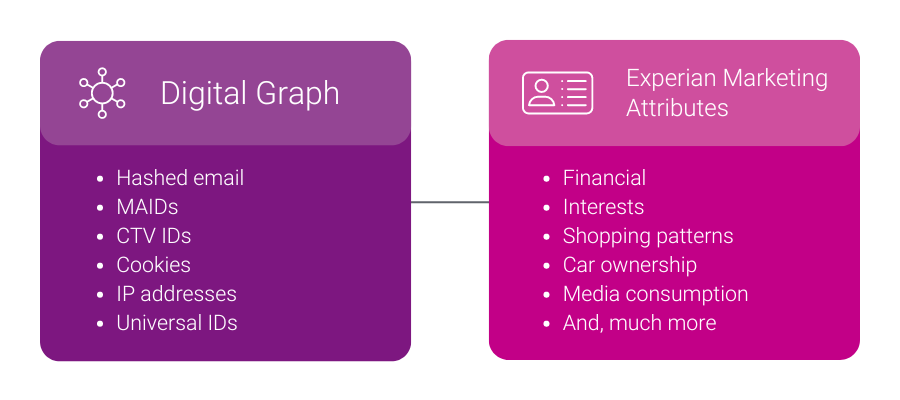
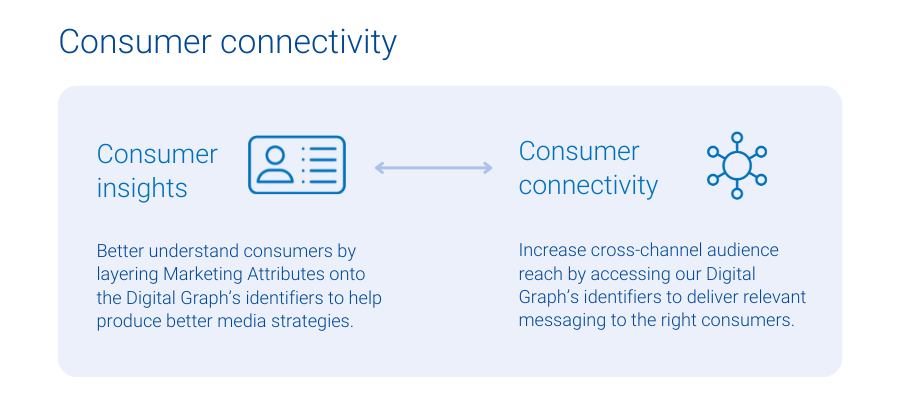
- Consumer connectivity: When clients license Experian’s Digital Graph, they get access to digital identifiers like mobile ad IDs (MAIDs), connected TV (CTV) IDs, hashed emails (HEMs), and universal IDs so they can target the right consumers with the relevant messages across all digital media channels.
- Consumer insights: Experian’s 5,000 Marketing Attributes provide our clients with detailed consumer information and insights, such as age, gender, purchase behaviors, and content consumption habits. Marketing Attributes help clients create more relevant messaging and informed audience segmentation.
Client examples
How OpenX offers richer targeting and more connectivity with Experian
OpenX is an independent omni-channel supply-side platform (SSP) and a global leader in audience, data, and identity-targeting. With industry-leading technology, exceptional client service, and extensive scalability across all formats, including CTV, app, mobile web, and desktop, OpenX has a legacy of innovating products that enhance buyer outcomes and publisher revenue while addressing complex challenges in programmatic.
In recent years, OpenX has licensed Experian’s Digital Graph with identifiers, contributing to the SSP’s largest independent supply-side identity graph, which offers advanced audiences to buyers and improved data resolution to content owners.
More recently, OpenX licensed Experian’s Marketing Attributes to enrich its supply-side identity graph, which includes IPs, MAIDs, and client IDs, with a variety of attributes. This strategic move has helped OpenX’s clients benefit from enhanced consumer insights and addressability, in turn delivering greater reach to the demand side and higher revenue for publishers, despite industry signal loss.
“We built on our long-term partnership with Experian to enrich our digital IDs with Experian’s Marketing Attributes, which help provide buyers better insights to audiences, thereby helping our publishers monetize their inventory. With partners like Experian, OpenX effectively facilitates the value exchange between demand and supply, ensuring our partners are able to drive results for their business in the era of signal loss”
Craig Golaszewski, Sr. Director of Strategic Partnerships, OpenX
How StackAdapt licenses our product bundle to address three different use cases
StackAdapt is the multi-channel programmatic advertising platform trusted by marketers to deliver exceptional campaigns. They drive superior results through a variety of solutions, like contextual and first-party targeting, brand lift measurement, and optimization through insights.
StackAdapt licensed a similar yet unique product combination, our Digital Graph and our Audiences. StackAdapt uses the Digital Graph to allow clients to onboard their first-party data in a seamless, self-serve manner that allows them to further segment their data using Experian Audiences.
“StackAdapt has been recognized as the most trusted programmatic platform by marketers, and with the integration of Experian’s Digital Graph and Audiences, we are strengthening our leadership in the space. This partnership improves our ability to deliver precise cross-channel segmentation, reach, and measurement, helping advertisers run more successful campaigns. Our collaboration with Experian allows us to offer a differentiated solution in the market and ensure our clients can deliver the most precise and impactful ads to their audiences.”
Denis Loboda, Senior Director of Data, StackAdapt
We recently announced a new partnership with StackAdapt. This collaboration brings the power of Experian’s identity graph, syndicated and custom audiences directly to the StackAdapt platform. Read the full details in our press release here.
Four ways to use Digital Graph and Marketing Attributes
When these two products come together, our clients have a 360-degree view of their consumers, which helps them power four critical use cases:
- Analytics and insights: Learn more about your consumers by connecting our Marketing Attributes with our Digital Graph’s identifiers. For example, a retailer can discover that their recent customers over-index as pickleball fans and players, leading the retailer to sponsor a professional pickleball event.
- Inventory monetization: When supply-side partners know their audience better, they can attract advertisers in search of that audience. For example, a publisher might find out that their audience is full of pickleball fans, leading them to reach out to brands that want to reach this audience.
- Activation: Companies with access to more digital identifiers from our Digital Graph can reach more people, while controlling frequency across channels. A company might know that they want to reach pickleball fans. Now, they have the digital identifiers needed to reach pickleball fans across all digital channels where they consume content, leading to increased reach.
- Measurement and attribution: Use the Digital Graph’s support for various digital identifiers to understand all consumer touchpoints, from media impressions to conversions. Then, lean on our Marketing Attributes to determine who your messaging resonated with. For example, a company uses our Digital Graph to know if it was the same individual who was exposed to an ad on CTV and converted via e-commerce. On top of that, the company can use our Marketing Attributes data to find out that the people who purchased were overwhelmingly pickleball fans.
Connect with us to learn more about how our Digital Graph and Marketing Attributes joint solution can provide the data and insights you need to create, activate, and measure cross-channel media campaigns.
Latest posts

As we ring in the New Year this week, Americans will be tossing back a few adult beverages in celebration. While alcohol consumption certainly increases around holidays and other times of celebration, many Americans imbibe year-round. So where across this great land of ours are you most likely to find adults willing and able to raise a glass (or two) and where are you most likely to be surrounded by teetotalers? Experian Simmons has the answer. Leveraging data from our SimmonsLOCAL study, we examined the drinking patterns of adults of legal drinking age in the 106 Designated Market Areas (DMAs) with populations of at least 500,000 adults age 21 and older. We then ranked those markets by the number of alcoholic beverages consumed by the average adult during a typical month. The chart below lists the DMAs that consume the most alcoholic beverages per capita in a typical month. First place goes to Boston, where the average adult of legal drinking age regularly kicks back 14.4 drinks a month. (Celebrations in Beantown are probably already underway.) Rank DMA Average drinks per month 1 Boston 14.4 2 Austin 13.8 3 Providence-New Bedford 13.4 4 Madison 13.2 4 Hartford & New Haven 13.2 6 Philadelphia 13.1 7 Chicago 13 8 Denver 12.9 9 Tallahassee-Thomasville 12.8 9 Milwaukee 12.8 11 Minneapolis-St. Paul 12.6 11 West Palm Beach-Ft. Pierce 12.6 11 Seattle-Tacoma 12.6 11 Tucson (Sierra Vista) 12.6 15 Green Bay-Appleton 12.5 16 San Diego 12.4 16 Baltimore 12.4 16 Washington, DC 12.4 16 Albany-Schenectady-Troy 12.4 20 New Orleans 12.3 20 St. Louis 12.3 20 Colorado Springs-Pueblo 12.3 23 Burlington-Plattsburgh 12.2 23 Syracuse 12.2 23 Norfolk-Portsmouth-Newport News 12.2 23 Spokane 12.2 23 Portland-Auburn 12.2 Source: Experian Simmons Adult residents of the markets listed below surely know how to have a good time-it's just unlikely to include a cocktail. The chart below lists the DMAs that consume the fewest alcoholic beverages per capita in a typical month. Residents of Chattanooga consume only 6 alcoholic beverages per month, on average, making it the least imbibing market-and probably the one that feels the best the morning after a big gathering. Rank DMA Average drinks per month 106 Chattanooga 6 105 Salt Lake City 7.2 105 Florence-Myrtle Beach 7.2 105 Charleston-Huntington 7.2 105 Tri-Cities, TN-VA 7.2 101 Knoxville 7.4 100 Lexington 7.9 99 Birmingham 8 98 Huntsville-Decatur 8.5 97 Nashville 8.9 97 Evansville 8.9 95 Paducah-Cape Girardeau-Harrisburg-Mt Vernon 9.1 94 Springfield, MO 9.2 94 Tulsa 9.2 94 Greenville-New Bern-Washington 9.2 91 Memphis 9.3 90 Greenville-Spartanburg-Asheville-Anderson 9.4 90 Jackson, MS 9.4 90 Wichita-Hutchinson Plus 9.4 86 Little Rock-Pine Bluff 9.5 86 Louisville 9.5 86 Ft. Smith-Fayetteville-Springdale-Rogers 9.5 83 Fresno-Visalia 9.6 82 Greensboro-High Point-Winston Salem 9.7 82 Roanoke-Lynchburg 9.7 Source: Experian Simmons For more information on SimmonsLOCAL's vivid reporting of consumer behaviors, attitudes, lifestyles and media consumption in 209 Designated Market Areas down to the ZIP code level, visit our website.
Registered Republicans and Democrats have different TV program preferences. But a majority of highly rated Nielsen programs seem to clearly skew Republican. Which TV programs does each group prefer, and what are the common threads among the two groups?
Discount stores appear to be weathering the recession better than some of their full-price counterparts, as they carry first-quality designer merchandise at competitive prices.