
Experian, the leader in powering data-driven advertising through connectivity, is thrilled to unveil our latest solution, Digital Graph and Marketing Attributes. This joint solution supplies marketers and platforms with the insights and connectivity needed to understand who their customers are and reach them across digital channels.
The uncertainty around third-party cookies in Chrome and the overall decline in signal complicates the industry’s ability to reach the right consumer. Omnichannel media consumption results in scattered data, making it harder for marketers and platforms to understand consumer behavior and reach them across channels. These challenges call for a comprehensive solution.
Our Digital Graph and Marketing Attributes solution addresses these challenges by providing identifiers for seamless cross-channel engagement. By adding Marketing Attributes, like demographic and behavioral data, marketers and platforms also gain a better understanding of their customers. This solution uses Experian’s Living Unit ID (LUID) to combine offline and digital data, giving customers deeper insights into consumer behavior, greater audience reach, and improved cross-channel visibility.

Benefits of Digital Graph and Marketing Attributes
Both our Digital Graph and Marketing Attributes provide value to clients as standalone products. When clients license our Digital Graph and Marketing Attributes joint solution, they have more data at their fingertips, unlocking:
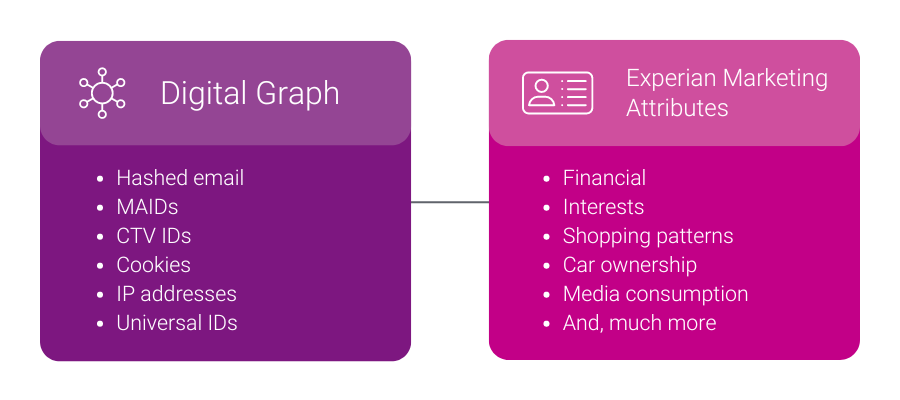
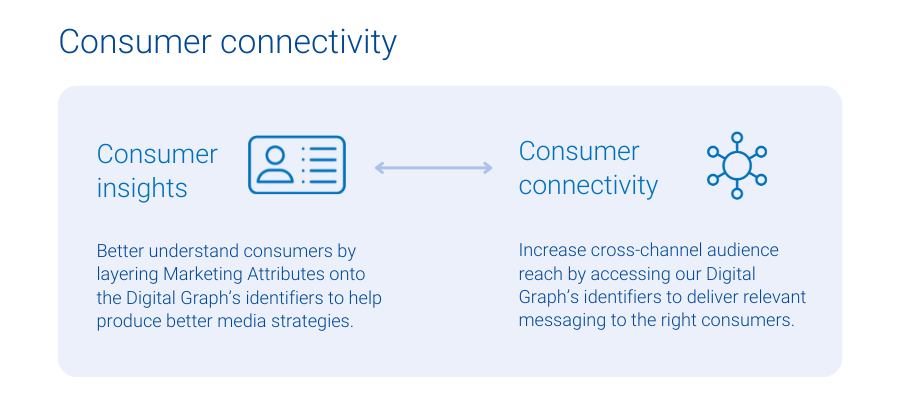
- Consumer connectivity: When clients license Experian’s Digital Graph, they get access to digital identifiers like mobile ad IDs (MAIDs), connected TV (CTV) IDs, hashed emails (HEMs), and universal IDs so they can target the right consumers with the relevant messages across all digital media channels.
- Consumer insights: Experian’s 5,000 Marketing Attributes provide our clients with detailed consumer information and insights, such as age, gender, purchase behaviors, and content consumption habits. Marketing Attributes help clients create more relevant messaging and informed audience segmentation.

Client examples
How OpenX offers richer targeting and more connectivity with Experian
OpenX is an independent omni-channel supply-side platform (SSP) and a global leader in audience, data, and identity-targeting. With industry-leading technology, exceptional client service, and extensive scalability across all formats, including CTV, app, mobile web, and desktop, OpenX has a legacy of innovating products that enhance buyer outcomes and publisher revenue while addressing complex challenges in programmatic.
In recent years, OpenX has licensed Experian’s Digital Graph with identifiers, contributing to the SSP’s largest independent supply-side identity graph, which offers advanced audiences to buyers and improved data resolution to content owners.
More recently, OpenX licensed Experian’s Marketing Attributes to enrich its supply-side identity graph, which includes IPs, MAIDs, and client IDs, with a variety of attributes. This strategic move has helped OpenX’s clients benefit from enhanced consumer insights and addressability, in turn delivering greater reach to the demand side and higher revenue for publishers, despite industry signal loss.
“We built on our long-term partnership with Experian to enrich our digital IDs with Experian’s Marketing Attributes, which help provide buyers better insights to audiences, thereby helping our publishers monetize their inventory. With partners like Experian, OpenX effectively facilitates the value exchange between demand and supply, ensuring our partners are able to drive results for their business in the era of signal loss”
Craig Golaszewski, Sr. Director of Strategic Partnerships, OpenX
How StackAdapt licenses our product bundle to address three different use cases
StackAdapt is the multi-channel programmatic advertising platform trusted by marketers to deliver exceptional campaigns. They drive superior results through a variety of solutions, like contextual and first-party targeting, brand lift measurement, and optimization through insights.
StackAdapt licensed a similar yet unique product combination, our Digital Graph and our Audiences. StackAdapt uses the Digital Graph to allow clients to onboard their first-party data in a seamless, self-serve manner that allows them to further segment their data using Experian Audiences.
“StackAdapt has been recognized as the most trusted programmatic platform by marketers, and with the integration of Experian’s Digital Graph and Audiences, we are strengthening our leadership in the space. This partnership improves our ability to deliver precise cross-channel segmentation, reach, and measurement, helping advertisers run more successful campaigns. Our collaboration with Experian allows us to offer a differentiated solution in the market and ensure our clients can deliver the most precise and impactful ads to their audiences.”
Denis Loboda, Senior Director of Data, StackAdapt
We recently announced a new partnership with StackAdapt. This collaboration brings the power of Experian’s identity graph, syndicated and custom audiences directly to the StackAdapt platform. Read the full details in our press release here.
Four ways to use Digital Graph and Marketing Attributes
When these two products come together, our clients have a 360-degree view of their consumers, which helps them power four critical use cases:
- Analytics and insights: Learn more about your consumers by connecting our Marketing Attributes with our Digital Graph’s identifiers. For example, a retailer can discover that their recent customers over-index as pickleball fans and players, leading the retailer to sponsor a professional pickleball event.
- Inventory monetization: When supply-side partners know their audience better, they can attract advertisers in search of that audience. For example, a publisher might find out that their audience is full of pickleball fans, leading them to reach out to brands that want to reach this audience.
- Activation: Companies with access to more digital identifiers from our Digital Graph can reach more people, while controlling frequency across channels. A company might know that they want to reach pickleball fans. Now, they have the digital identifiers needed to reach pickleball fans across all digital channels where they consume content, leading to increased reach.
- Measurement and attribution: Use the Digital Graph’s support for various digital identifiers to understand all consumer touchpoints, from media impressions to conversions. Then, lean on our Marketing Attributes to determine who your messaging resonated with. For example, a company uses our Digital Graph to know if it was the same individual who was exposed to an ad on CTV and converted via e-commerce. On top of that, the company can use our Marketing Attributes data to find out that the people who purchased were overwhelmingly pickleball fans.
Connect with us to learn more about how our Digital Graph and Marketing Attributes joint solution can provide the data and insights you need to create, activate, and measure cross-channel media campaigns.
Latest posts

Q&A with John Fetto, Senior Analyst, Marketing & Research Earlier this year, Experian Marketing Services released our Cross-Device Video Analysis. The analysis has generated such strong and sustained interest from marketers and the media, we wanted to explore the subject further. The following is an exchange with the report’s lead author John Fetto who answers some common questions that we’ve received since the analysis was published. Q: In the Cross-Device Video Analysis, you report that consumers are “cutting the cord” on pay cable and satellite television services. Can you elaborate on this trend? What’s driving it? According to our research at Experian Marketing Services, U.S. consumers are increasingly likely to have high speed Internet at home but no cable or satellite TV subscription. There are two primary consumer trends driving this: 1) Households that never subscribed to a pay TV service are now upgrading to broadband Internet; 2) Households that previously subscribed to both pay TV service and broadband Internet that have since cancelled the cable or satellite TV subscription. While the vast majority of U.S. households pay for either cable or satellite TV, an estimated 15.1 million (or 12.9 percent of households) do not. That’s up from 13.5 million households (11.9 percent) who didn’t pay for TV in 2009. At the same time, the share of broadband households is also rising. Today, 72.7 million homes (61.4 percent) have broadband Internet, up from 65.0 million homes (56.9 percent) in 2009. As Americans’ Internet connection at home is increasingly fast enough to deliver high quality video content through sites like YouTube, Netflix, Hulu and the like, as well as the ability to consume that online video content across an array of devices ranging from Internet-connected televisions to smartphones and tablets to computers, they are increasingly questioning whether they need to continue paying for TV. And more and more consumers are deciding to cut the cord. Q: With more consumers cutting the cord, how are they consuming video content? While the most commonly used device to consume online video is the smartphone — used by 24 percent of adults during a typical week to watch online video, according to our research — “cord cutters” are primarily using Internet-connected TV to consume online video. In fact, an adult who watches online video on their TV is 3.2 times more likely than the average adult to be a cord-cutter. This means that the Internet-connected TV market is critical in predicting the future of the cord-cutting consumer. As existing devices like Apple TV, Chromecast and Roku are upgraded and new devices like Amazon Fire TV are introduced to the market, consumers will have more and more options to consume online video without sacrificing quality or screen size. As a result, more consumers will be reconsidering whether they need to continue paying for TV. Q: What percent of consumers get their television programming from various sources including cable, satellite, online streaming and free over the air TV? Combined, 87.1 percent of U.S. households subscribe to either cable or satellite TV. While Experian Marketing Services doesn’t specifically measure the percent of Americans who watch TV through an over the air feed (OTA) we know that among those who do not subscribe to cable or satellite, the vast majority (77 percent) still watch TV. And while it’s possible that some are viewing TV from a cable or satellite feed away from home, the most likely source of their TV content would be from OTA sources. That means that at least 10 percent of American adults are watching some TV through an OTA feed. In addition, 48 percent of all adults watch online video each week through a variety of devices. Those who don’t pay for TV are 12 percent more likely than those who have cable or satellite TV to watch online video (54 percent vs 48 percent). Q: The cord-cutting trend has many implications for the cable and satellite companies, but what do consumer-facing marketers and advertisers need to know about this trend? The growth in online video viewing creates many opportunities for marketers. Online audiences can be more easily targeted and served up advertising that is more relevant, responsive and measureable. Marketers can also be more confident that their online ad was actually seen, given that viewers are typically unable to skip ads. And while CPMs for online video ads may generally be lower than those of TV, marketers can use that savings to negotiate costs based on clicks or transactions rather than impressions, giving them a better picture into audience interest and insights to inform their budget allocation. Millennials are the most device “agnostic,” with more than one-third saying they don’t mind watching video on a portable device even if it means a smaller screen. That’s more than double the rate of those ages 35 and older. This decentralized viewing can create headaches for marketers who need to start a relationship with Millennials during this stage of their lives when they’re most open to trying out new brands and have yet to settle down. On the plus side, marketers who do manage to reach this audience will find them much more open to advertising than average. In fact, Millennials are more than four times more likely to say that video ads that they view on their cell phone are useful. So while the challenge is big, so is the potential reward. Download the full analysis to learn more about: Cross-device video behaviors to optimize media mix approach The impact of the growing trend in cord-cutters The rising influence of Internet-connected TV How to get more impact from video content

School may be out for the summer, but this is the perfect time for marketers to begin back-to-school planning. Follow these five simple tips and be on your way to back-to-school success. Searchers are actively seeking out ideas around clothes, hairstyles and dorm room décor as they prepare for the school year to start. Leverage sites like Pinterest to promote back to school merchandise and content. Don’t forget to include DIY and customization options as these appeal to today’s students. Don’t underestimate the influence of moms and college students. These consumers are more likely to actively search for the best deals online so test using deal-seeking terms like “free” and “sales” in promotional campaigns. In 2013, Marketers experienced a 35 percent lift in unique clicks when they used the word ‘college’ in the subject line. This year, try targeting specific ages for back-to-school by including terms like “college” and kids” in the subject line. Timing of back-to-school campaigns matters. While August is the key month for back-to-school campaigns, there may be more opportunity to mail additional campaigns for school supplies in July, and clothing and accessories in early September. Don’t forget to personalize! Last year, we saw a 44 percent increase in unique open rates for emails that contained personalization in the subject line. These tactics should be included in a strong back-to-school mailing program. For more information on back-to-school planning, download the 5 Lessons for Back-to-school Marketers in 2014 report.

Experian Marketing Services conducted an analysis into the attitudes, language preferences, spending habits and media behaviors of Hispanic Consumers, some of which were featured in the 2014 Hispanic Market Overview presented by López Negrete Communications. This post highlights findings from that analysis, which focus on Hispanic consumers’ adoption and use of smartphones. Hispanic consumers, who today account for 15 percent of the total U.S. adult population and 22 percent of Millennials, represent an ideal audience for mobile engagement and mobile advertising. While cell phone ownership rates among Hispanic and non-Hispanic adults are equal, Hispanics are more likely to own a smartphone and use it as their primary device to connect to the Internet. According to the latest estimates from Experian Marketing Services, 63 percent of Hispanic adults own a smartphone versus 60 percent of non-Hispanics. That’s up from 52 percent and 51 percent, respectively, since 2012. Among smartphone owners, Hispanics are 17 percent more likely than non-Hispanics to say that they access the Internet more through their phone than through a computer. In fact, 45 percent of Hispanic smartphone owners are mobile-dominant when it comes to going online compared with 38 percent of non-Hispanics. Marketers courting the influential Hispanic consumer must consider this fact and take a mobile-first approach to ensure that online marketing efforts, including everything from email to websites to e-commerce, are designed to engage the customer as effectively on a mobile device as on a computer. Even traditional marketing tactics such as television ads should reflect the growing likelihood that Hispanics have a smartphone either nearby or physically in their hand and are ready to engage. In fact, 37 percent of all Hispanic adults say that they often use their cell phone while watching television compared with 29 percent of non-Hispanics. Among smartphone owners, the share of Hispanics who use their phone while watching television shoots up to 50 percent versus 42 percent of non-Hispanics. Millennial smartphone owners are among the most likely to be splitting their attention between the big and small screen with 61 percent of Hispanic Millennials and 58 percent of non-Hispanic Millennials doing so. Knowing what specific mobile activities Hispanics are engaging in is critical for marketers in identifying the best tactics for reaching them via mobile. The chart below shows that Hispanics engage in most smartphone activities at above average rates, but they are much more likely than non-Hispanics to IM/chat on their phone. As a result they are slightly less likely than non-Hispanics to email from their phone, though the vast majority of Hispanic smartphone owners still use mobile email. Other activities that marketers will find Hispanics engaging in at above average rates include watching videos, using mobile GPS and listening to music. Learn more about how Experian Marketing Services can help your organization more effectively target, reach and engage today’s Hispanic consumer.