As Earth Day approaches, it’s the perfect opportunity for marketers to explore innovative ways to engage with eco-conscious customers. With a strong and growing interest in sustainable business practices worldwide, green audiences are becoming increasingly influential. In addition to being good for the planet, engaging these customers is great for any brand or organization striving to become more eco-friendly and socially responsible. By taking advantage of this timely event and using appropriate tools, you can create personalized campaigns that will both promote your brand and increase customer loyalty.
Eco-conscious audiences
In this blog post, we’ll cover three eco-conscious audiences to target this Earth Day:
- Solar energy
- GreenAwareTM
- Electric vehicles
Solar energy
Our first eco-conscious audience is Solar energy. Consumers in this audience show an inclination toward harnessing the power of the sun as a clean, renewable energy source. Our audience data can provide valuable insights into the Solar energy consumer base, including their age, education level, occupation, household income, and communication preferences. Let’s explore these metrics to better understand how to reach this group effectively.
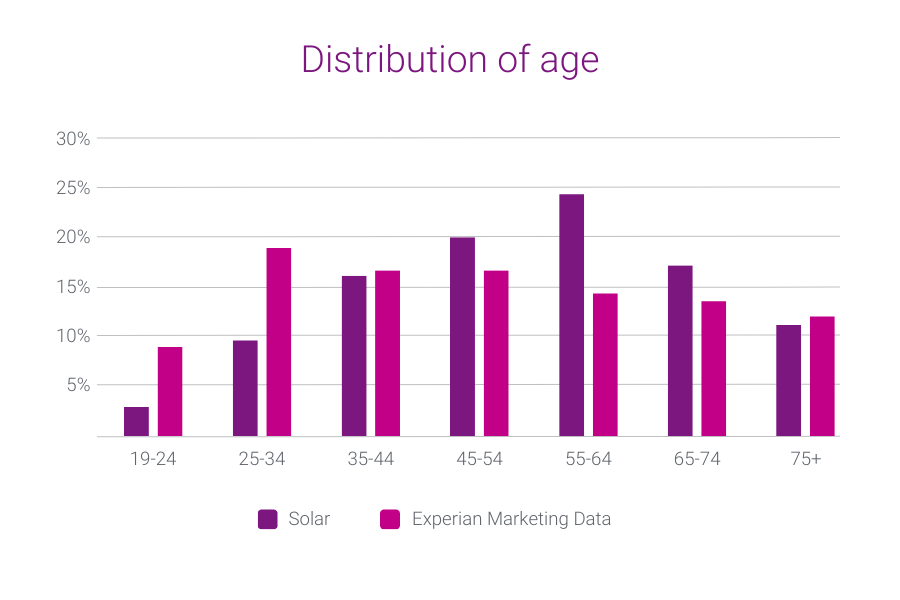
Age and living situation
Consumers in our Solar energy audience are more likely to live in a home with two or more adults and are between the ages of 45-74.
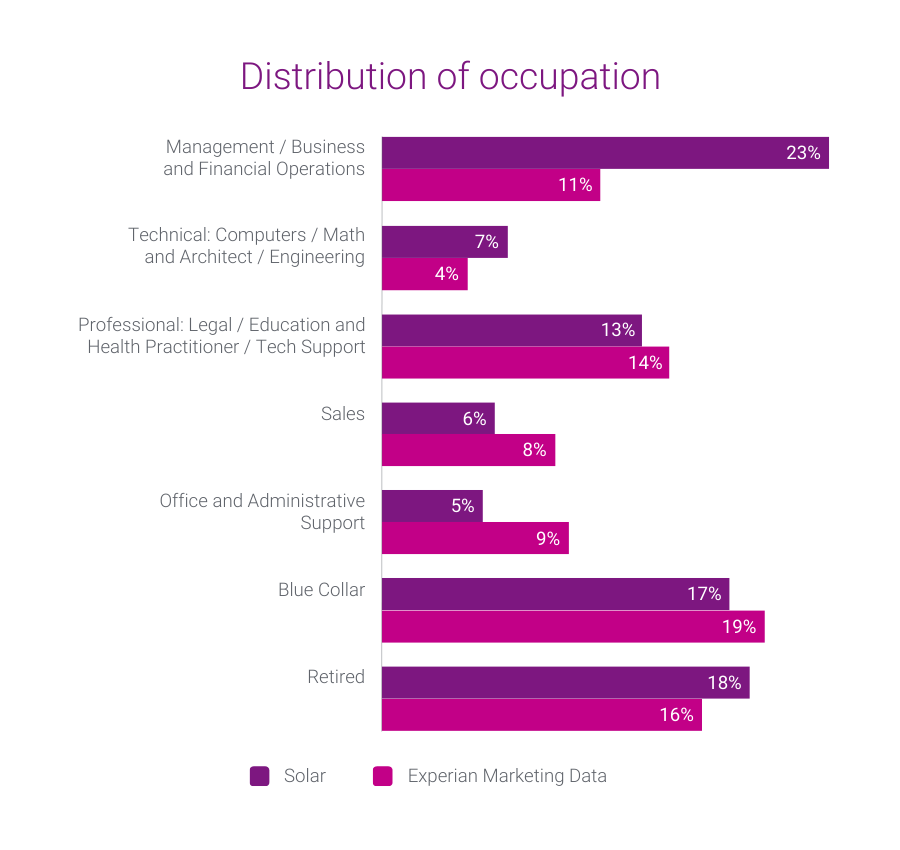
Education level and occupation
Consumers in our Solar energy audience are more likely to have graduated from college or graduate school and work in management-level occupations.
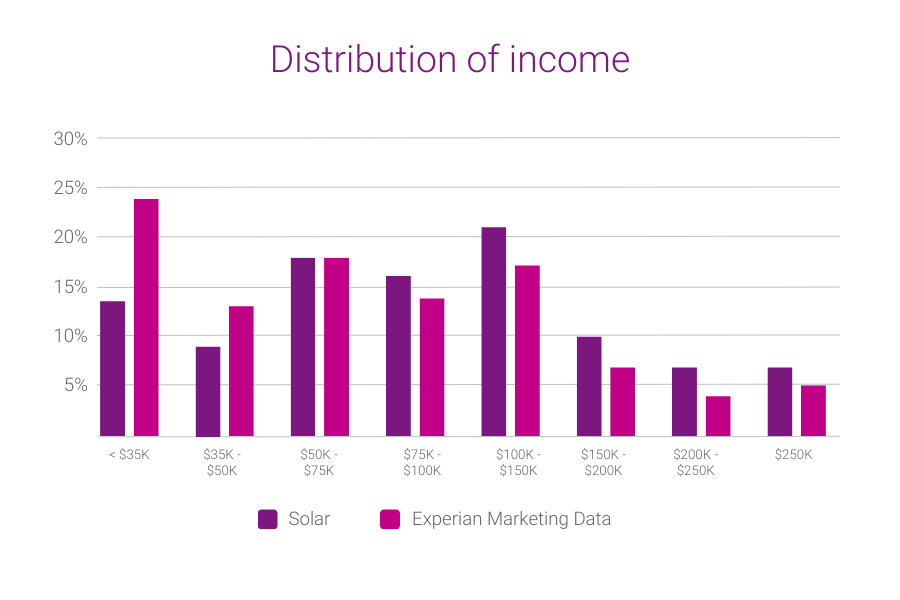
Household income
Consumers in our Solar energy audience have household incomes of more than $75,000 and their homes are valued at over $550,000.
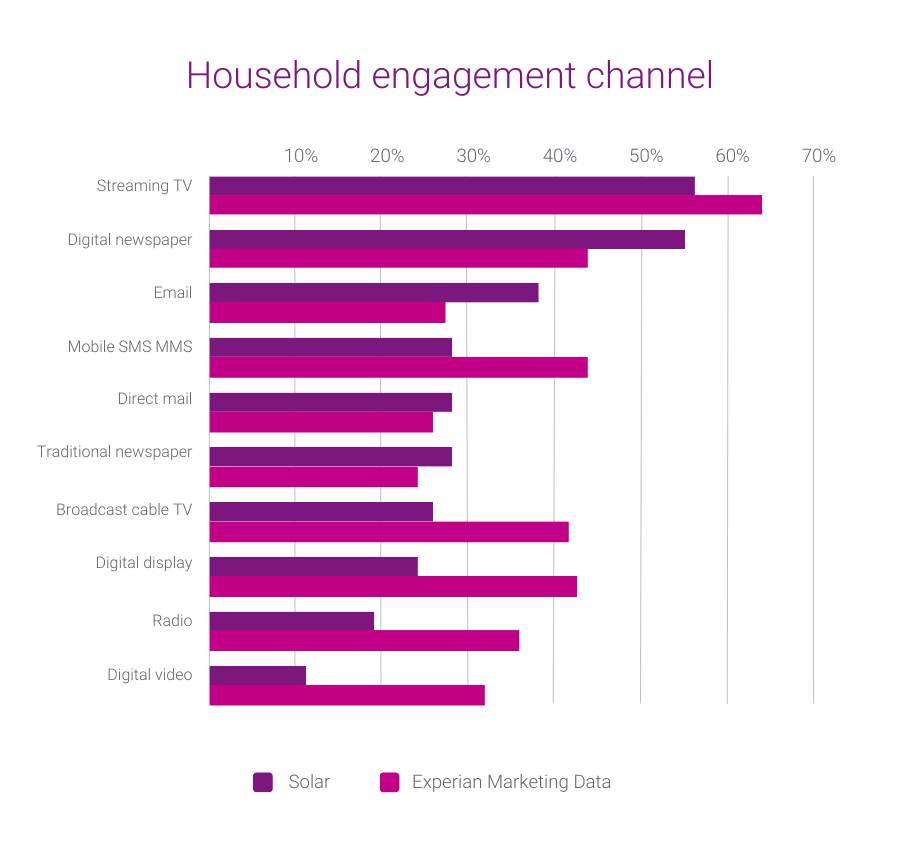
Preferred engagement channels
Consumers in our Solar energy audience are most receptive to ads served through digital channels like digital newspapers and email.
Solar energy audience pairings
Consumers in our Solar energy audience also belong to three of our Mosaic® USA groups:
- Power Elite
- Flourishing Families
- Booming with Confidence
Our consumer segmentation portal of 126 million households and 650 lifestyle and interest attributes empowers marketers like you to precisely target your ideal audience and communicate with them on a personal level. Mosaic’s data segments the U.S. into 19 overarching groups and 71 underlying types, giving you the insights needed to anticipate the behavior, attitudes, and preferences of your most profitable customers and communicate with them on their preferred channels, with messaging that resonates.
GreenAware
Our second eco-conscious audience is GreenAware.
GreenAware segments the 126 million U.S. households within Consumer View into four distinct groups. Each group differs in their attitudes and behaviors toward purchasing products that are environmentally safe and working with companies that are eco-conscious. We created these groups using an enhanced application of traditional statistical clustering techniques based on environmentally relevant measurements in Simmons’ National Consumer Study.
Based on the distinctive mindset of consumers toward the environment, you can learn how environmental concerns fit into their lives through four major consumer segments:
- Eco-Friendly Enthusiasts
- Sustainable Spectators
- Passive Greenies
- Eco Critics
Let’s dive deeper into each group to understand their unique perspective on the environment and how this impacts their attitudes and behaviors.
Eco-Friendly Enthusiasts
This eco-conscious segment prioritizes a green lifestyle and takes pride in avoiding products that harm the planet. With traditional and liberal values, they embrace optimism and prioritize family. With their children out of the house, they take the time for some well-deserved rejuvenation and are committed to a healthy lifestyle. Some members of this group are transitioning into retirement and welcoming a new chapter in their life.
- Mature adults and retirees
- College graduate or more
- Above average income
- May be married or single
- Typically own their homes
Sustainable Spectators
This segment aspires to be more sustainable, but they struggle with translating their green ideas into action. They have a soft spot for a cozy home. While their love for interior design and taking care of their own space is evident, they’re always looking for new experiences and opportunities to learn. Staying healthy and active is a top priority for this group, so it’s no surprise that they’re always looking for ways to stay fit and feel their best.
- Established and mid-life adults
- College graduate or more
- High income
- Typically married
- Likely to own their homes
Passive Greenies
This is the largest and one of the most youthful groups. Known for their love of exploration and self-discovery, they may not have fully embraced eco-conscious behaviors yet, but they are eager to stay current with the latest technology and trends. With their incredible ability to multitask, they’re always on-the-go, and constantly seek the next best thing.
- Mainly young adults and diverse
- Education ranges from high school through some college
- Below average income
- More likely to be single or divorced
- Typically rent
Eco Critics
This group is not likely to be eco-conscious and may have negative attitudes about the environment. They are confident, driven, and focused on their personal growth. They crave instant gratification, seeking out quick and easy solutions to their everyday decisions. They place a high value on entertainment, their social life, and carefully curate their image.
- Young and established adults
- Education ranges from high school through post-graduate studies
- High income
- Married or single
- Typically own their homes
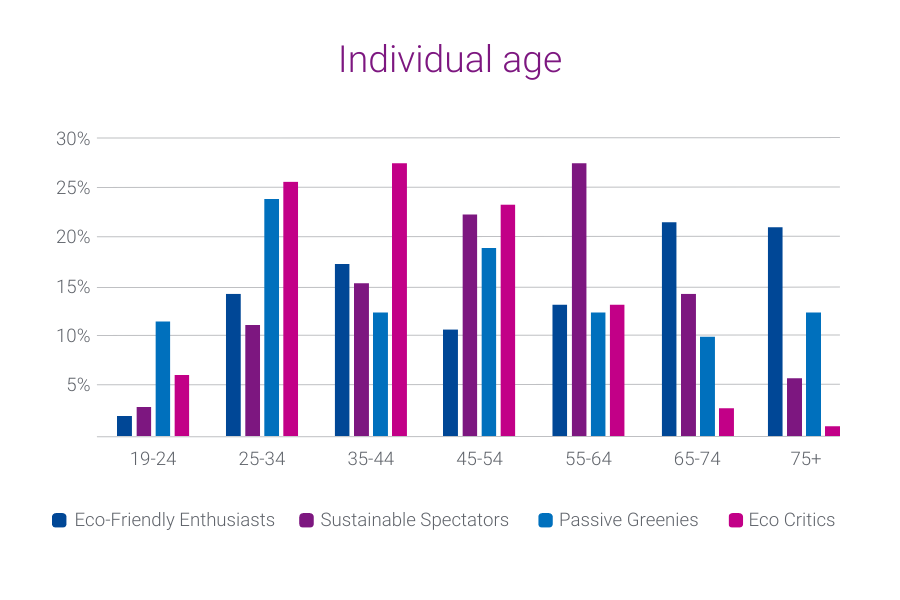
Let’s take a look at how the GreenAware segments stack up against each other in terms of age, household income, education level, and media preference. How do they compare? Let’s find out.
Age
Consumers in the Eco-Friendly Enthusiasts segment are the oldest of the four GreenAware segments – about half of the consumers are 65 or older. Eco Critics are the youngest segment, with over half of consumers in this group between ages 25-44.
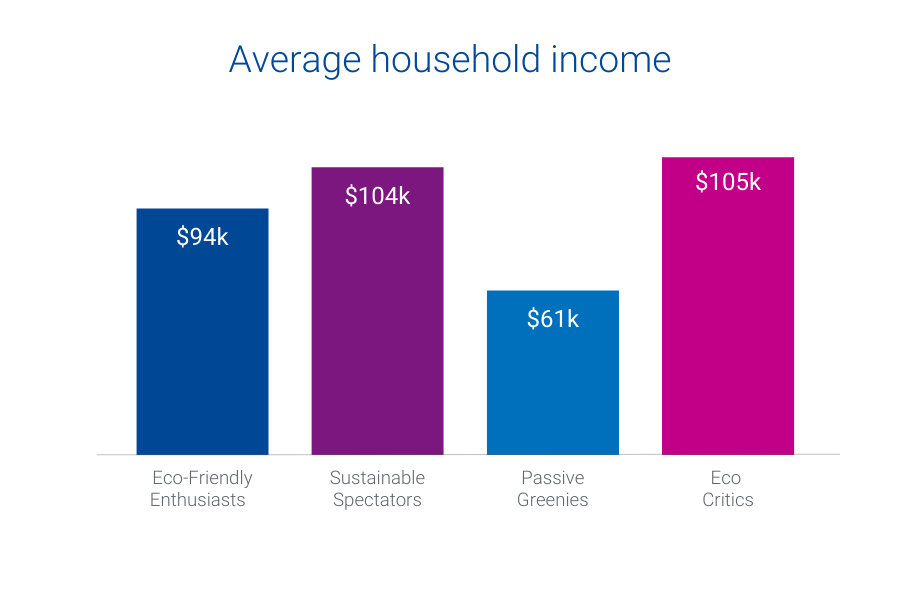
Household income
Sustainable Spectators and Eco Critics are the wealthiest GreenAware segments. The average household income of consumers in these segments is above $100,000. Passive Greenies have the lowest household income, with a majority below $50,000.
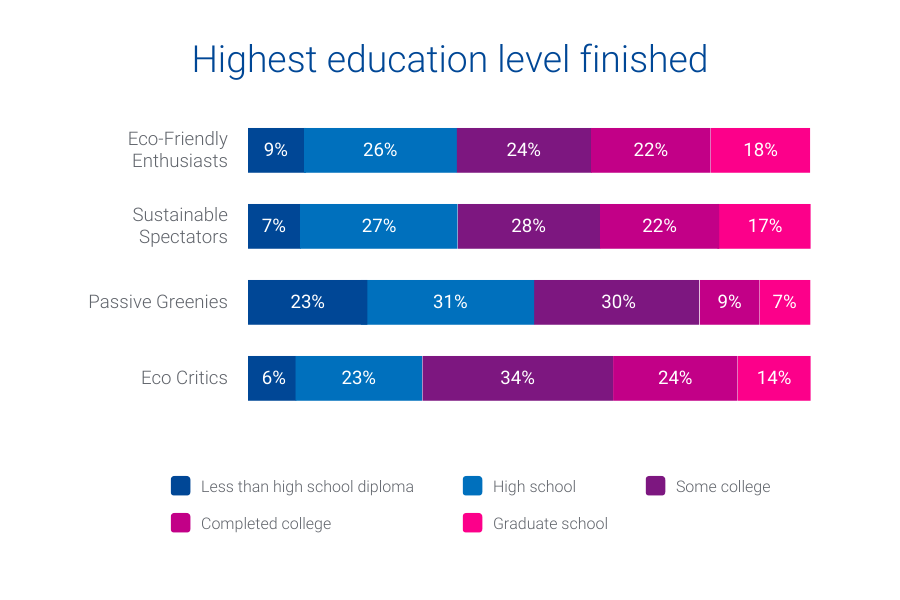
Education level and occupation
Passive Greenies are more likely to work Blue Collar jobs and have the lowest level of education. As the wealthiest segments, Sustainable Spectators and Eco Critics have the highest levels of college degrees and work in management, business, and financial operations. Eco-Friendly Enthusiasts are the most likely to be retired and out of the workforce.
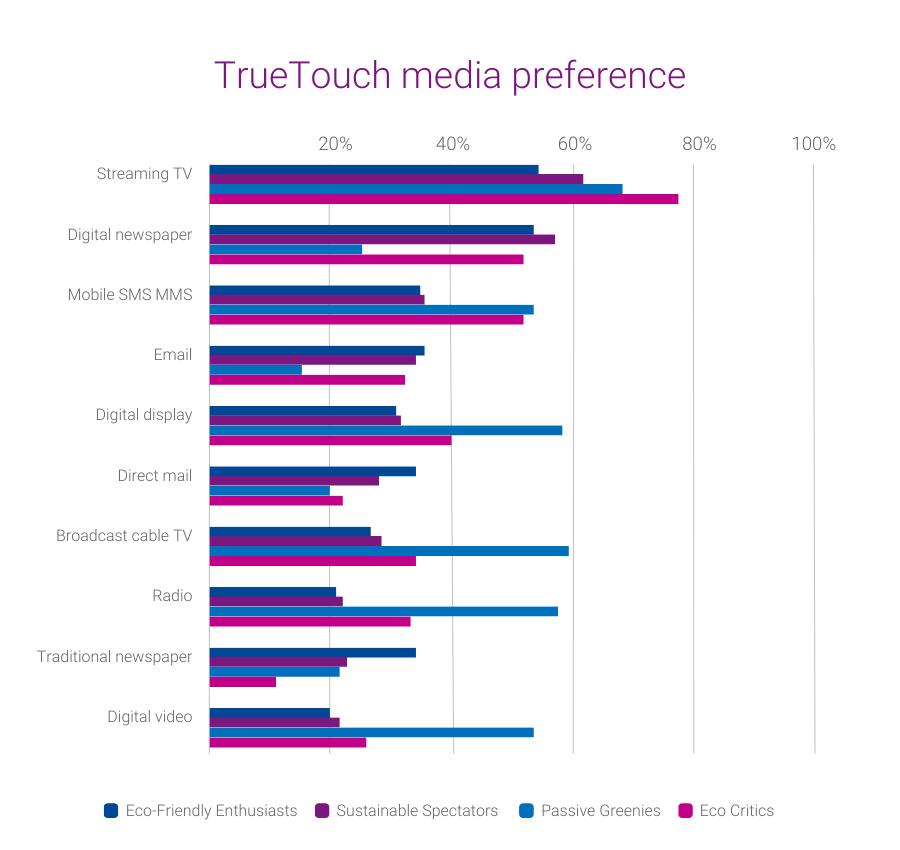
Preferred engagement channels
Streaming TV is the preferred engagement channel for all GreenAware segments.
Eco-Friendly Enthusiasts prefer digital channels like digital newspapers, mobile SMS, and email. They also engage with traditional channels like direct mail and newspaper.
Passive Greenies have a high preference for digital display, mobile SMS, digital video, broadcast cable TV, and radio.
Eco Critics have a high preference for digital channels like digital newspapers, mobile SMS, and digital display.
Sustainable Spectators strongly prefer digital newspapers. They don’t show as strong of a preference for mobile SMS and digital display as Eco Critics and Passive Greenies.
GreenAware audience pairings
Six of our Mosaic groups have at least one GreenAware segment with 10% or more of the population. For more precise targeting, below are suggested Mosaic audiences you can pair with each GreenAware segment:
| Eco-Friendly Enthusiasts | Sustainable Spectators | Passive Greenies | Eco Critics |
| Booming with Confidence | Power Elite | Singles and Starters | Power Elite |
| Autumn Years | Booming with Confidence | Golden Year Guardians | Suburban Style |
| Golden Year Guardians | Singles and Starters |
Electric vehicles
Our third eco-conscious audience is electric vehicles.
Electric vehicles (EVs) are having a major moment in the automotive industry. This is no surprise given that new EV models are being released and an increasing number of charging stations are popping up around the country. As EVs become more prominent, it’s essential to stay up to date on relevant trends to make informed decisions about what lies ahead.
The demand for electric vehicles (EVs) is on the rise
Consumers are embracing the EV revolution, showing their desire for a cleaner, greener future. Automotive marketers are increasingly looking to reach in-market EV shoppers and current alternative fuel vehicle owners due to the growing availability of electric vehicles, improved infrastructure, and rising popularity. In 2022, EVs charged up the market and accounted for a remarkable 6% of new retail registrations.
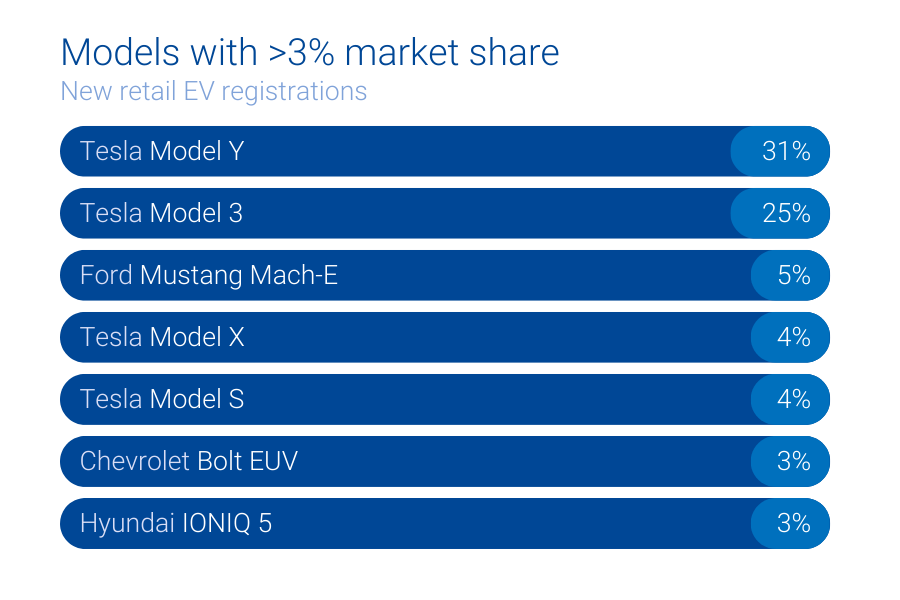
While Tesla continues to dominate the EV market, Ford, Chevrolet, and Hyundai are starting to compete, each holding more than 3% of the market share of new retail EV registrations.
Geography
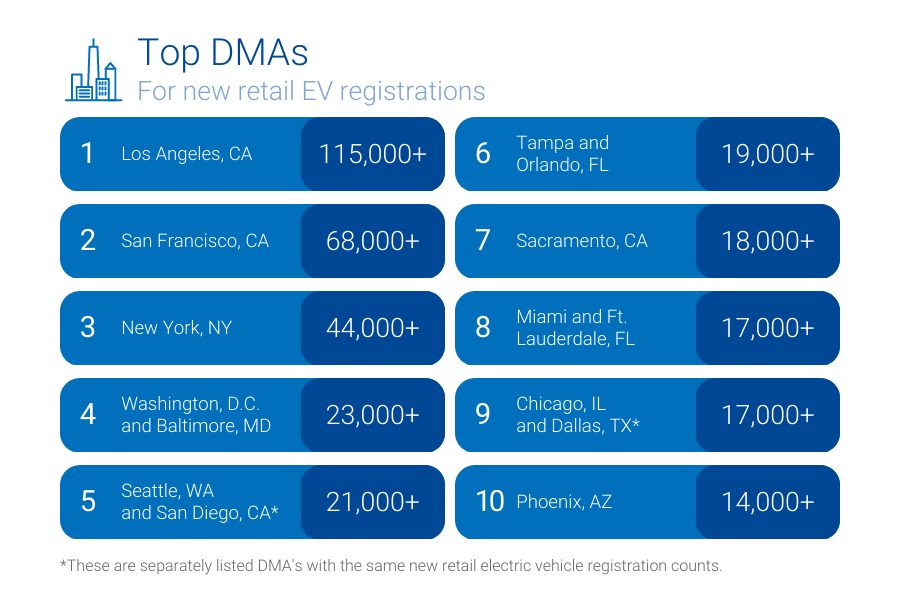
Where are we seeing the most new retail EV registrations? The top designated market areas (DMAs) for new retail EV registrations are mostly located in heavily populated, coastal cities like Los Angeles, CA and New York, NY.
The fastest growing DMAs, however, are in smaller cities like Tucson, AZ and Oklahoma City, OK.
Generational demographics
Gen X and Millennials make up the largest percentage of new retail EV buyers at 37.5% and 34.4%. Gen Z and the Silent generation represent the smallest shares at 5% and 2.1%. Boomers hover between Gen X and Millennials’ share and account for 20.6% of new EV retail purchases.
EV audience pairings
Our top five Mosaic groups for new EV buyers include:
- American Royalty
- Cosmopolitan Achievers
- Philanthropic Sophisticates
- Couples with Clout
- Fast Track Couples
How to target consumers in-market for electric vehicles
We offer 70+ audiences that are focused on likely buyers and owners of EV and plug-in hybrid (PHEV) vehicles. We also offer a subset of 28 audiences focused on individual EV/PHEV vehicle models.
Below is how you can find a few of these audiences on-the-shelf of most trusted advertising platforms:
- Autos, Cars, and Trucks > In Market-Fuel Type > Electric
- Autos, Cars, and Trucks > In Market-Fuel Type > Used Electric
- Autos, Cars, and Trucks > In-Market Make and Models > Tesla
- Autos, Cars, and Trucks > In-Market Make and Models > Chevrolet Bolt EV
We can help you reach eco-conscious consumers
Earth Day is a great opportunity to get creative with your marketing efforts with our three eco-conscious audiences: Solar energy, GreenAware, and electric vehicles. To find out how you can add eco-conscious audiences to your marketing plan, contact us.
Latest posts

London – 24 November, 2017 – Tapad, part of Experian, is the leader in cross-device marketing technology and continues to broaden its reach across EMEA. The business today reported a 20 percent growth in the scope of its regional device graph, a data set used by organisations to map consumers to their devices, enabling better, more personalised cross-device marketing. This news complements Tapad’s recent expansion of its UK team with the hire of experienced solutions engineer, Davide Rosamilia. As the demand for cross-device technology solutions continues to grow around the globe, coupled with the emergence of regulations such as Europe’s General Data Protection Regulation (GDPR), Tapad is committed to offering suppliers the greatest level of insight without compromising consumer privacy. Since Tapad started licensing its proprietary Tapad Device GraphTM just over a year ago, demand for the company’s technology has experienced significant growth. New supply partnerships and proactive data sourcing have also meant an increase in devices across key markets, which contribute to the overall 20 percent growth of the EMEA device graph, including a 44 percent increase in the U.K., 47 percent in France, and 85 percent in Germany. “We’re continuing to invest heavily in growing our regional device graph, allowing us to better meet the needs of EMEA marketers as they strive to reach individuals with greater precision in some of the most tightly regulated marketplaces worldwide,” said Tom Rolph, VP EMEA, Tapad. “This year, we have also welcomed 10 new data suppliers whom we’ve helped to increase cross-device amplification, attribution and audience extension, helping to further set us apart in the marketplace and successfully expand our EMEA presence.” Available around the world, the Device Graph provides access to Tapad’s globally compliant and privacy-safe datasets across EMEA, APAC and the U.S., and offers deeper knowledge of consumer preferences, purchase intent, and conversion behaviors. “Tapad has shown a unique ability to adapt to the nuances of the local EMEA market and display impressive growth without sacrificing dedication to privacy,” said Alistair Hill, CEO and Co-founder at On Device Research. “When we started vetting technology vendors, we needed to be sure that we selected a partner that could offer compliant and privacy-safe datasets to operate within our stringent data standards. Tapad’s probabilistic solution offered us greater scale, greater device reach, and increased engagement without compromising on privacy.” For information more about the Tapad Device Graph™, or to request a demo, contact us today. Get started with us
The Tapad Device Graph™ Will Expand Sizmek’s Cross-Device Reach and Improve the Efficiency and Precision of Digital Advertising NEW YORK, November 16, 2017 — Tapad, part of Experian and a leader in cross-device marketing technology, today announced a new global partnership with Sizmek, the largest independent buy-side advertising platform delivering impressions that inspire. By integrating the Tapad Device Graph™, Sizmek will enhance its AI-powered predictive capabilities to deliver accurate, cross-device messaging at global scale in a privacy-safe environment. Combined with Sizmek’s existing data enablement, creative optimization and media execution capabilities, the proprietary Tapad Device Graph improves the efficiency and precision of digital advertising by accurately matching people and devices. This enables advertisers to get a clear view of individual customer journeys, achieve scale without compromising on efficiency, and uncover new opportunities for conversion. Sizmek’s customers will have access to Tapad’s globally compliant and privacy-safe datasets across the Americas, EMEA, and APAC. With deeper knowledge of consumer preferences, purchase intent and conversion behaviors, Sizmek and its customers are able to enhance advertising strategies including cross-device audience identification and more. “Tapad is known for their strong cross-device capabilities, and their offering is an excellent addition to our growing program for best-of-breed data and measurement partners" says Mike Caprio, Sizmek’s Chief Growth Officer. “For our customers, this partnership will add further people-based marketing precision and reach to our comprehensive offerings around creative optimization, data enablement and media execution." “Sizmek’s adoption of industry-leading AI and machine learning campaigns will be a great complement for the Device Graph,” said Chris Feo, SVP, strategy & global partnerships at Tapad. “Our ability to create smaller, more customized segments in conjunction with Sizmek’s AI modeling will deliver efficiency, effectiveness and increased ROI for marketers worldwide.” This partnership comes at a time of a massive shift in the marketing technology industry. Companies like Tapad and Telenor, as well as Rocket Fuel and Sizmek, are joining forces to adopt those technologies that are most efficient and accurate at reaching consumers at scale in a personalized and non-intrusive way. The combination of Tapad and Sizmek’s offerings will provide international marketers with exceptional resources to lead a more cost effective and results driven campaign. For information more about the Tapad Device Graph™, contact us today. Get started with us

The Tapad Device Graph™ increases Throtle’s amplification by 475 percent. NEW YORK, Nov. 1, 2017 /PRNewswire/ — Tapad, now a part of Experian, the leader in cross-device marketing technology, today announced a partnership with Throtle, a leading data onboarding company. The Tapad Device Graph™ will enhance Throtle's best-in-class onboarding capabilities by providing accurate and privacy-safe cross-device reach as well as precise audiences at scale. In partnership with Tapad, Throtle will deterministically link its services to a corroborated individual with hundreds of targeting attributes. This linkage allows Throtle to offer true cross-device identity management and identity resolution services to accompany its robust onboarding capabilities. Throtle will also work with Tapad to validate its device graph, building larger, more comprehensive audience segments. To date, the Tapad Device Graph™ has connected 61 percent of Throtle IDs to related ones in the graph, with an average amplification rate of 475 percent for Throtle's IDs, or 4.8 new IDs per each of Throtle's. Throtle has also seen its overall match rates involving Tapad's identity insights rise an average of 15 percent since the inception of the partnership. More specifically, Tapad's mobile advertising IDs (MAIDs) have increased Throtle's in-app identity inventory by 35 percent. "Tapad has proven to be a trusted source for cross-device matching and has a tremendous reputation in the advertising and marketing technology industries for delivering superior precision and scale with the utmost dedication to privacy," says Paul Chachko, CEO, Throtle. "Since we first began our test phase, and continuing through to this day, Tapad has met and exceeded our expectations for what a partner should be." With Tapad's strong commitment to precision and accuracy, Throtle was confident that this partnership would prove to be the right choice for the strategic expansion of its platform. Not only does Tapad deliver in-depth insights, parsing deterministic from probabilistic linkages, but its pool of device-level touchpoints enables Throtle to increase scale without seeing a decline in precision. "Accuracy and precision are core characteristics of our proprietary Device Graph," explains Chris Feo, SVP, Strategy & Global Partnerships, Tapad. "When Throtle approached our team, we knew we would be the right partner to assist their leading onboarding technology. We're excited to work with Throtle to achieve cross-device reach, audience scale and precise deterministic and probabilistic linkages for its clients." For more information about the Tapad Device Graph™, or to request a demo, visit https://www.experian.com/marketing/consumer-sync About TapadTapad Inc. is a marketing technology company renowned for its breakthrough, unified, cross-device solutions. The company's signature Tapad Device Graph™ connects millions of consumers across billions of devices. The world's largest brands and most effective marketers entrust Tapad to provide an accurate, privacy-conscious, and unified approach to connecting with consumers across screens. In 2015, Tapad began licensing the Tapad Device Graph™ and swiftly became the established gold-standard throughout the ad tech ecosystem. Tapad is based in New York and has offices in Boston, Chicago, Dallas, Detroit, London, Los Angeles, Miami, Oslo, San Francisco, Singapore, and Tokyo. Tapad's numerous awards include: Forbes' Most Promising Companies, Deloitte's Technology Fast 500, Crain's Fast 50, TMCnet Tech Culture Award, and Global Startup Award's "Startup Founder of the Year". In 2016, Tapad was acquired by the Telenor Group, one of the world's largest mobile operators. About ThrotleThrotle is a data onboarding company focused on deterministic matching and identity resolution, empowering brands with true individual-based marketing. Our data centric onboarding approach guarantees the highest level of accuracy, scale, and responsiveness for our clients. For more information on Throtle, please visit, throtle.io. Contact us today!