
As the vibrant colors of spring emerge, so do opportunities for marketers to engage with their audience in fresh and meaningful ways. Crafting effective spring advertising campaigns requires a deep understanding of your target audience. In this blog post, we’ll explore five key audience categories, each presenting unique opportunities for impactful spring advertising campaigns.

Spring cleaning and home improvement
Embrace the energy of renewal associated with spring cleaning. Target audiences interested in home improvement and organization with Experian syndicated audiences like “Gardening Mothers” or “Home Improvement & DIY Frequent Spenders.” Share tips, hacks, and products that align with the desire for a fresh start, turning mundane chores into exciting opportunities for your brand to shine.
Here are 6 audience segments that you can activate to target consumers focused on spring cleaning and home improvements:
- Purchase Transactions > Household Goods > Frequent Spenders
- Purchase Predictors > Shoppers All Channels > Home Maintenance and Improvement
- Purchase Transactions > DIY and Advice Seekers > High Spenders
- Purchase Transactions > Home Improvement/DIY > High Spenders
- Retail Shoppers: Purchase Based > Home Improvement & DIY > Hardware & Home Improvement
- Retail Shoppers: Purchase Based > Shopping Behavior > Big Box and Club Stores: Walmart Frequent Spenders
Gardening
Spring is the time when consumers are investing in gardening equipment for lawn care. Here are a few audience segments you can activate to target consumers focused on gardening:
- Retail Shoppers: Purchase Based > Home Improvement & DIY > Garden & Landscaping Stores: Frequent Spenders
- Lifestyle and Interests (Affinity) > Hobbies > Gardening
- Lifestyle and Interests (Affinity) > Moms, Parents, Families > Gardening Mothers
- Purchase Predictors > Shoppers All Channels > Lawn and Garden
Movers and new homeowners
Did you know?
44% of new homeowners are between the ages of 25-39*.
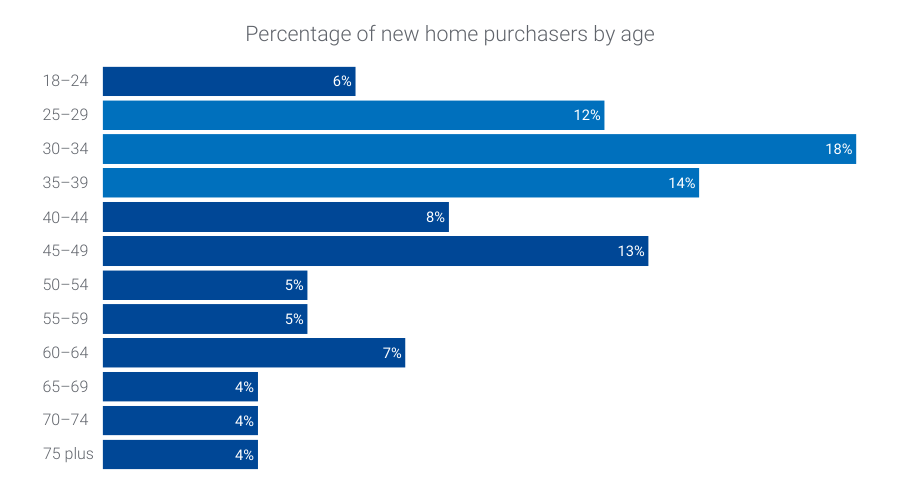
Improve engagement for your spring targeting by pairing our new homeowner audiences with our Demographics > Ages > 25-29, 30-34, and 35-39 syndicated audiences. Here are a few you can activate now:
- Life Events > New Homeowners > Last 6 Months
- Life Events > New Movers > Last 12 Months

Mother’s Day: Unveil the perfect gift
Appealing to the emotion of gratitude and love, Mother’s Day is a significant occasion for marketers. Activate Experian syndicated audiences such as “Mother’s Day Shoppers” and “Florists & Flower Gifts High Spenders” to tailor your spring advertising campaign toward those likely to purchase heartfelt gifts. Share ideas and promotions that resonate with the nurturing and caring spirit of this celebration.
Here are 6 audience segments that you can activate to target consumers getting ready to celebrate Mother’s Day:
- Retail Shoppers: Purchase Based > Seasonal > Mothers Day Shoppers Spenders
- Lifestyle and Interests (Affinity) > Moms, Parents, Families > Mothers with 2+ children
- Mobile Location Models > Visits > Mothers Day Shoppers
- Lifestyle and Interests (Affinity) > Moms, Parents, Families > Moms Age 25-54
- Mobile Location Models > Visits > Jewelry Retail Stores
- Retail Shoppers: Purchase Based > Shopping Behavior > Florists & Flower Gifts: High Spenders

Father’s Day: Celebrate Dads in style
Highlighting the significance of paternal bonds, Father’s Day is an excellent opportunity to showcase thoughtful gifts and experiences. Engage the “Father’s Day Shoppers” or “Growing and Expanding families” with content and products aligned with their interests. Craft a campaign that acknowledges the varied roles fathers play and the unique gifts they would appreciate.
Here are 6 audience segments that you can activate to target consumers getting ready to celebrate Father’s Day:
- Retail Shoppers: Purchase Based > Seasonal > Fathers Day Shoppers Spenders
- Mobile Location Models > Visits > Fathers Day Shoppers
- Mosaic – Personas – Lifestyle and Interests > Group M: Families in Motion > M45 – Growing and Expanding (Young, working-class families and single parent households that live in small city residences)
- Geo-Indexed > Demographics > Presence of Children: Ages: 7-9
- Lifestyle and Interests (Affinity) > Activities and Entertainment > Home Improvement Spenders
- Life Events > New Parents > Child Age 0-36 Months

Plan for the 2024 TV Upfronts
When gearing up for the 2024 upfronts, you can expand your TV planning by incorporating diverse audience categories into your spring advertising campaigns. It’s not just about targeting a demographic; it’s about captivating your unique audience. Whether it’s cord cutters, ad avoiders, avid streamers, or households that watch TV together, understanding and engaging with these distinct segments is paramount. To maximize impact, use comprehensive TV data that goes beyond broad demographics.
Here are 6 audience segments that you can activate as part of your TV planning strategy:
- Retail Shoppers: Purchase Based > Entertainment > Streaming/Video/Audio/CTV/Cable TV: Cable/Broadcast TV: Cord Cutters: Recent
- Retail Shoppers: Purchase Based > Entertainment > Streaming/Video/Audio/CTV/Cable TV: Streaming Video: High Spenders
- Television (TV) > Ad Avoiders/Ad Acceptors > Ad Avoiders
- Television (TV) > TV Enthusiasts > Paid TV High Spenders
- Television (TV) > Ad Avoiders/Ad Acceptors > Ad Acceptors
- Television (TV) > Household/Family Viewing > Pay TV/vMVPD Subscribers Households
To find consumers who are most likely to engage with your TV ads, you can layer in our TrueTouchTM engagement channel audiences:
- TrueTouch: Communication Preferences > Engagement Channel Preference > Digital Video
- TrueTouch: Communication Preferences > Engagement Channel Preference > Streaming TV

Summer preparation: Anticipate the fun ahead
As spring transitions to summer, help your audience gear up for the upcoming season. Target “Summer break travelers” or “Memorial Day Shoppers” with offerings that align with their summer plans. Whether it’s fashion, travel essentials, or outdoor gear, position your brand as an essential companion for their summer adventures.
Here are 6 audience segments that you can activate to target consumers getting ready for summer:
- Mobile Location Models > Visits > Summer Break Travelers
- Retail Shoppers: Purchase Based > Seasonal > Summer Sales Event Shoppers: Independence Day Shoppers
- Retail Shoppers: Purchase Based > Travel > Vacation/Leisure Travelers: Summer Trips
- Mosaic – Personas – Lifestyle and Interests > Group B: Flourishing Families > B09 – Family Fun-tastic (Upscale, middle-aged families with older children that live in suburban areas and lead busy lives focused on their children)
- Mobile Location Models > Visits > Memorial Day Shoppers
- Retail Shoppers: Purchase Based > Seasonal > Summer Sales Event Shoppers: High Spenders: Memorial Day Shoppers
Did you know?
Consumers between the age of 45-49 make up the largest percentage of top apparel shoppers*.
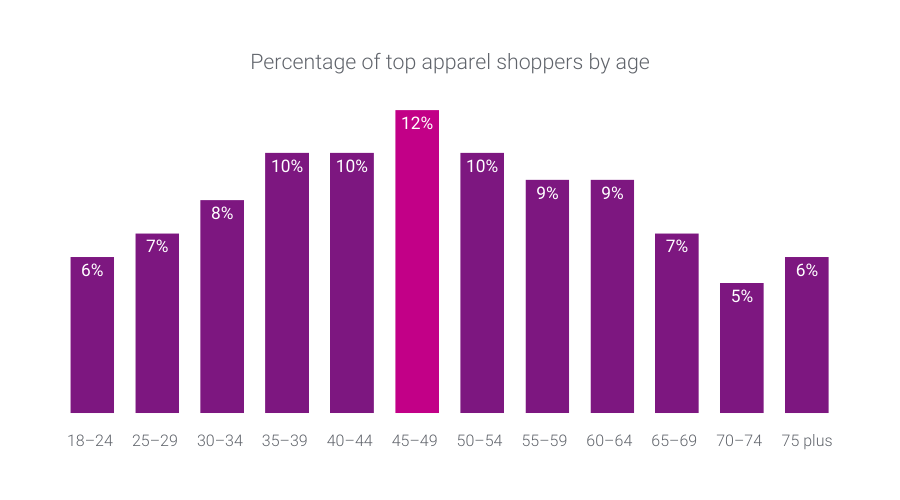
Improve engagement for summer apparel shopping targeting by refining your audience with our Demographics > Ages > 45-49 syndicated audience.
Spring into effective advertising with Experian’s syndicated audiences
For spring advertising campaigns, understanding your audience is the key to success. By activating Experian’s syndicated audiences, you can refine your approach and resonate by activating specific segments. Embrace our syndicated audiences so you deliver campaigns that not only capture attention but also build lasting connections with your audience. As you embark on this spring marketing journey, remember – the possibilities are as endless as the blossoming flowers.
You can activate our syndicated audiences on-the-shelf of most major platforms. For a full list of Experian’s syndicated audiences and activation destinations, download our syndicated audiences guide below.
Check out other seasonal audiences you can activate today.
Footnote
*Experian looked at our demographic and purchase-based data to understand retail trends over the past year. Our demographic and purchase-based data covers credit and debit card usage across 500 top merchants.
Latest posts

Autotrader leverages The Tapad Device GraphTM to achieve higher performance and reach new audiences across all devices New York, NY – September 6, 2017 – Tapad, the leader in cross-device marketing technology and now a part of Experian, today revealed findings from a campaign conducted with Autotrader which connects with more actual car buyers than any other third-party listing site.* Autotrader’s premium audience, combined with the Tapad Device GraphTM, delivered significant audience extension across desktop, mobile, and tablet to drive awareness and maximize both reach and delivery across screens. To help analyze shopping behaviors across multiple devices, the global automotive brand for this campaign turned to Autotrader and Tapad, who created a cross-device pre-roll video strategy with a focus on viewability, concentrating on potential customers already searching for vehicles. By using a one-to-one connection, instead of look-alike modeling, Tapad also ensured that the automotive brand discovered only new consumers across all of their devices. This approach discovered a new potential audience of more than 14 million consumers, eliminated communication waste and the risk of duplicates, increased overall performance, and ensured more of their campaign dollars reached meaningful audiences. Overall, this case study represents a leap forward in terms of audience-based targeting and the highly-sought after multi-touch attribution modeling. “We really enjoy working with the team at Tapad to help execute our Audience Extension campaigns”, said Lynne Green, product manager at Autotrader. “Their ability to meet the demands of an ever-changing industry, as well as their dependable customer service has allowed us to confidently deliver against our unique in-market automotive audience and provide our clients ongoing messaging opportunities to our audience beyond Autotrader.com.” “How identity relates to conversion behavior is a complex part of any advertising campaign,” said Jeff Kelosky, RVP and head of global automotive at Tapad. “After identifying auto consumer’s behavioral patterns and device usage while shopping for vehicles, we knew we could successfully help Autotrader and its automotive brand clients maximize campaign viewability and drive results.” To learn more about using Audience Extension with Autotrader, click here. For more about the Tapad Device GraphTM, or to request a demo, visit https://www.experian.com/marketing/consumer-sync Contact us today!
With campaigns applied to seven major holding companies, Tapad continues to see healthy adoption with The Trade Desk clients NEW YORK, NY – August 23, 2017 – Tapad, now a part of Experian, the leader in cross-device marketing technology, today announced its ongoing momentum with The Trade Desk, Inc. (Nasdaq: TTD), a global technology platform for buyers of advertising. Tapad is providing cross-device segments from the groundbreaking Tapad Device GraphTM through The Trade Desk’s platform. Since 2015, Tapad has seen steady growth in the use of its cross-device data across The Trade Desk platform. This forward progress continues, as 1H2017 saw important milestones for Tapad. Seven major private and independent holding companies now apply Tapad’s data to their campaigns, in addition to more than 1,500 unique brands. Tapad’s proprietary Device GraphTM connects billions of devices, providing unified and insightful data for brands, agencies, and marketers across the globe. Several of these clients, representing varying industries from financial, to auto, CPG and retail, apply Tapad’s data across a number of key tactics and strategies, including: first party CRM extension, third party audience extension, cross-device retargeting, cross-device frequency management, and more. Clients in these verticals continue to rely on Tapad’s cross-device data, as Tapad saw the amount of usage by financial and retail clients grow by four times over the past year, and double for automotive and CPG clients. “We are pleased to offer our clients access to Tapad’s device graph”, said David Danziger, VP of Data Partnerships, The Trade Desk. “Their cross-device identification capabilities have been a powerful addition to our omnichannel platform.” “This integration is a shining example of the amplifying effect of two of the best platforms working together,” said Chris Feo, SVP of Global Partnerships at Tapad. "Clients leveraging Tapad's Device Graph in The Trade Desk platform have the potential to see higher returns and reach with access to substantial cross-device data, as well as a very effective media platform." Contact us today!
Tapad Device Graph™ and Sojern’s mobile offering unify travel intent signals; achieve amplification rate of more than 600 percent NEW YORK, June 15, 2017 — Tapad, a part of Experian, the leader in cross-device marketing technology, is partnering with Sojern, travel’s direct demand engine, to provide marketers with an even stronger understanding of travelers as they research and shop across multiple devices. Combined with its 350 million global traveler profiles and billions of predictive purchase intent signals, Sojern utilizes the Tapad Device Graph™ to resolve the complex travel consumer journey, target travelers more precisely, and derive more actionable insights for its travel clientele. According to Sojern’s research, travelers visit hundreds of websites preceding their trip purchase, with some consumers reaching upwards of 450 touchpoints prior to booking. Sojern’s partnership with Tapad will help unify these touchpoints across devices, enabling travel brands to more effectively nurture and engage potential buyers during the purchase process, regardless of which device they use. “Sojern’s been focused on travel for over a decade, helping brands activate predictive purchase signals and leverage our traveler profiles into effective performance marketing campaigns,” said Mat Harris, Sojern’s VP of Product, Enterprise Solutions. “The cross-device insights we gain from the Tapad Device Graph provide a valuable tool for our customers to reach travelers across devices in real-time and at scale, on the right device.” Prior to selecting Tapad as its cross-device partner, Sojern surveyed several probabilistic and deterministic cross-device vendors and performed an extensive global test. The test was an examination of scale, match rate and several other factors, which enabled Sojern to learn as much as possible about each vendor. After examining the final test results, Sojern selected Tapad based on its excellent test performance, tried-and-true experience in the market and complimentary business model. To date, Sojern has already seen an amplification rate of more than 600 percent as a result of the integration, meaning that the Tapad Device Graph is connecting an average of six or more device and browser IDs for every one existing Sojern ID. “Not only is Sojern a compatible partner for our singular Device Graph capabilities, but they are also an incredible data partner to help expand our work in the travel industry,” said Pierre Martensson, SVP and GM of Tapad’s global data division. “Working with the team at Sojern allows us to solve a true challenge within the travel industry today: creating a unified view of customers so travel brands can better understand and access their key audiences at every point along their path to purchase.” Contact us today!