
As the vibrant colors of spring emerge, so do opportunities for marketers to engage with their audience in fresh and meaningful ways. Crafting effective spring advertising campaigns requires a deep understanding of your target audience. In this blog post, we’ll explore five key audience categories, each presenting unique opportunities for impactful spring advertising campaigns.

Spring cleaning and home improvement
Embrace the energy of renewal associated with spring cleaning. Target audiences interested in home improvement and organization with Experian syndicated audiences like “Gardening Mothers” or “Home Improvement & DIY Frequent Spenders.” Share tips, hacks, and products that align with the desire for a fresh start, turning mundane chores into exciting opportunities for your brand to shine.
Here are 6 audience segments that you can activate to target consumers focused on spring cleaning and home improvements:
- Purchase Transactions > Household Goods > Frequent Spenders
- Purchase Predictors > Shoppers All Channels > Home Maintenance and Improvement
- Purchase Transactions > DIY and Advice Seekers > High Spenders
- Purchase Transactions > Home Improvement/DIY > High Spenders
- Retail Shoppers: Purchase Based > Home Improvement & DIY > Hardware & Home Improvement
- Retail Shoppers: Purchase Based > Shopping Behavior > Big Box and Club Stores: Walmart Frequent Spenders
Gardening
Spring is the time when consumers are investing in gardening equipment for lawn care. Here are a few audience segments you can activate to target consumers focused on gardening:
- Retail Shoppers: Purchase Based > Home Improvement & DIY > Garden & Landscaping Stores: Frequent Spenders
- Lifestyle and Interests (Affinity) > Hobbies > Gardening
- Lifestyle and Interests (Affinity) > Moms, Parents, Families > Gardening Mothers
- Purchase Predictors > Shoppers All Channels > Lawn and Garden
Movers and new homeowners
Did you know?
44% of new homeowners are between the ages of 25-39*.
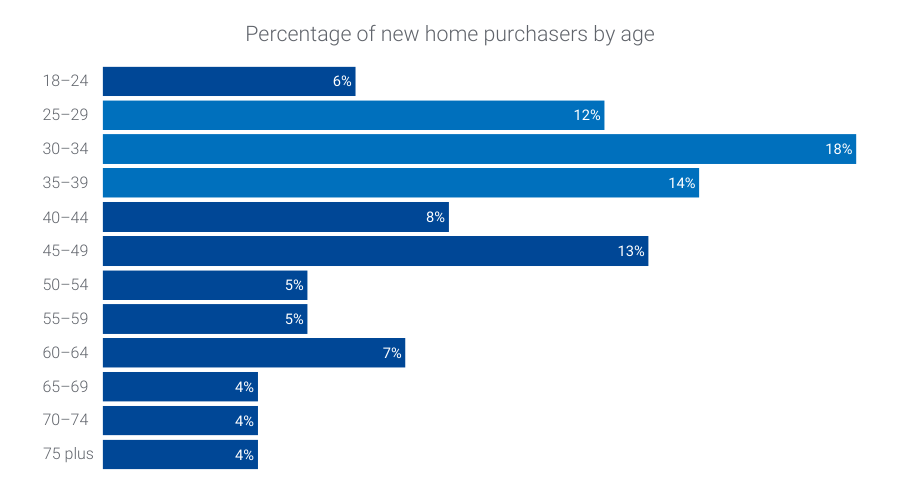
Improve engagement for your spring targeting by pairing our new homeowner audiences with our Demographics > Ages > 25-29, 30-34, and 35-39 syndicated audiences. Here are a few you can activate now:
- Life Events > New Homeowners > Last 6 Months
- Life Events > New Movers > Last 12 Months

Mother’s Day: Unveil the perfect gift
Appealing to the emotion of gratitude and love, Mother’s Day is a significant occasion for marketers. Activate Experian syndicated audiences such as “Mother’s Day Shoppers” and “Florists & Flower Gifts High Spenders” to tailor your spring advertising campaign toward those likely to purchase heartfelt gifts. Share ideas and promotions that resonate with the nurturing and caring spirit of this celebration.
Here are 6 audience segments that you can activate to target consumers getting ready to celebrate Mother’s Day:
- Retail Shoppers: Purchase Based > Seasonal > Mothers Day Shoppers Spenders
- Lifestyle and Interests (Affinity) > Moms, Parents, Families > Mothers with 2+ children
- Mobile Location Models > Visits > Mothers Day Shoppers
- Lifestyle and Interests (Affinity) > Moms, Parents, Families > Moms Age 25-54
- Mobile Location Models > Visits > Jewelry Retail Stores
- Retail Shoppers: Purchase Based > Shopping Behavior > Florists & Flower Gifts: High Spenders

Father’s Day: Celebrate Dads in style
Highlighting the significance of paternal bonds, Father’s Day is an excellent opportunity to showcase thoughtful gifts and experiences. Engage the “Father’s Day Shoppers” or “Growing and Expanding families” with content and products aligned with their interests. Craft a campaign that acknowledges the varied roles fathers play and the unique gifts they would appreciate.
Here are 6 audience segments that you can activate to target consumers getting ready to celebrate Father’s Day:
- Retail Shoppers: Purchase Based > Seasonal > Fathers Day Shoppers Spenders
- Mobile Location Models > Visits > Fathers Day Shoppers
- Mosaic – Personas – Lifestyle and Interests > Group M: Families in Motion > M45 – Growing and Expanding (Young, working-class families and single parent households that live in small city residences)
- Geo-Indexed > Demographics > Presence of Children: Ages: 7-9
- Lifestyle and Interests (Affinity) > Activities and Entertainment > Home Improvement Spenders
- Life Events > New Parents > Child Age 0-36 Months

Plan for the 2024 TV Upfronts
When gearing up for the 2024 upfronts, you can expand your TV planning by incorporating diverse audience categories into your spring advertising campaigns. It’s not just about targeting a demographic; it’s about captivating your unique audience. Whether it’s cord cutters, ad avoiders, avid streamers, or households that watch TV together, understanding and engaging with these distinct segments is paramount. To maximize impact, use comprehensive TV data that goes beyond broad demographics.
Here are 6 audience segments that you can activate as part of your TV planning strategy:
- Retail Shoppers: Purchase Based > Entertainment > Streaming/Video/Audio/CTV/Cable TV: Cable/Broadcast TV: Cord Cutters: Recent
- Retail Shoppers: Purchase Based > Entertainment > Streaming/Video/Audio/CTV/Cable TV: Streaming Video: High Spenders
- Television (TV) > Ad Avoiders/Ad Acceptors > Ad Avoiders
- Television (TV) > TV Enthusiasts > Paid TV High Spenders
- Television (TV) > Ad Avoiders/Ad Acceptors > Ad Acceptors
- Television (TV) > Household/Family Viewing > Pay TV/vMVPD Subscribers Households
To find consumers who are most likely to engage with your TV ads, you can layer in our TrueTouchTM engagement channel audiences:
- TrueTouch: Communication Preferences > Engagement Channel Preference > Digital Video
- TrueTouch: Communication Preferences > Engagement Channel Preference > Streaming TV

Summer preparation: Anticipate the fun ahead
As spring transitions to summer, help your audience gear up for the upcoming season. Target “Summer break travelers” or “Memorial Day Shoppers” with offerings that align with their summer plans. Whether it’s fashion, travel essentials, or outdoor gear, position your brand as an essential companion for their summer adventures.
Here are 6 audience segments that you can activate to target consumers getting ready for summer:
- Mobile Location Models > Visits > Summer Break Travelers
- Retail Shoppers: Purchase Based > Seasonal > Summer Sales Event Shoppers: Independence Day Shoppers
- Retail Shoppers: Purchase Based > Travel > Vacation/Leisure Travelers: Summer Trips
- Mosaic – Personas – Lifestyle and Interests > Group B: Flourishing Families > B09 – Family Fun-tastic (Upscale, middle-aged families with older children that live in suburban areas and lead busy lives focused on their children)
- Mobile Location Models > Visits > Memorial Day Shoppers
- Retail Shoppers: Purchase Based > Seasonal > Summer Sales Event Shoppers: High Spenders: Memorial Day Shoppers
Did you know?
Consumers between the age of 45-49 make up the largest percentage of top apparel shoppers*.
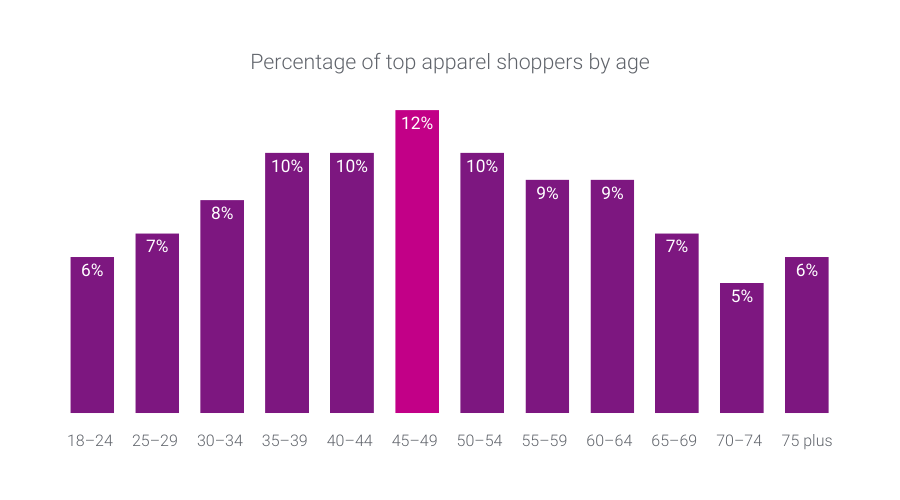
Improve engagement for summer apparel shopping targeting by refining your audience with our Demographics > Ages > 45-49 syndicated audience.
Spring into effective advertising with Experian’s syndicated audiences
For spring advertising campaigns, understanding your audience is the key to success. By activating Experian’s syndicated audiences, you can refine your approach and resonate by activating specific segments. Embrace our syndicated audiences so you deliver campaigns that not only capture attention but also build lasting connections with your audience. As you embark on this spring marketing journey, remember – the possibilities are as endless as the blossoming flowers.
You can activate our syndicated audiences on-the-shelf of most major platforms. For a full list of Experian’s syndicated audiences and activation destinations, download our syndicated audiences guide below.
Check out other seasonal audiences you can activate today.
Footnote
*Experian looked at our demographic and purchase-based data to understand retail trends over the past year. Our demographic and purchase-based data covers credit and debit card usage across 500 top merchants.
Latest posts

As partnership deals mount, aggressive hiring underway for unified cross-screen technology leaders NEW YORK, July 19, 2016 /PRNewswire/ — Tapad, the leader in cross-device marketing technology and now a part of Experian, has announced plans for aggressive expansion in the Asia Pacific (APAC) region. This move capitalizes on Tapad's exceptional performance for brands and marketing technology companies in North America and Europe. With it's proprietary Tapad Device Graph™, the company will enable global, regional and local clients and partners to understand, monetize and measure marketing to users across screens. The Tapad Device Graph is recognized as the most accurate, scalable cross-screen solution in the market today. The decision to expand into APAC was based on increased demand from global, as well as local, brands and clients, many of which have a strong market presence throughout the region. In addition to expanding its roster of world-class data partners, plans include building a world-class team in Singapore. Over the next few months, Tapad APAC will also establish local entities in additional markets. To accelerate its ramp-up, Tapad APAC is actively recruiting in many areas, ranging from skilled and experienced solutions engineers to seasoned sales and marketing professionals. "Tapad is thrilled to be answering the call for cross-device excellence in APAC," said Pierre Martensson, GM of Tapad APAC. "Our Device Graph is adding millions of devices daily and achieves unmatched levels of scale and accuracy while protecting consumer privacy. This meets a critical need in the region." Tapad appointed Martensson as General Manager of Tapad APAC in May, kicking off expansion in the region. Martensson comes to Tapad with nearly a decade of operations experience throughout APAC, having transformed, developed and grown global organizations. To learn more about partnership and employment opportunities available with Tapad in APAC, visit www.experian.com/careers. Contact us today!
Combined technology gives marketers an enhanced view of the customer for improved planning, targeting and optimization NEW YORK, July 12, 2016/PR Newswire/ - Tapad, the leader in cross-device marketing technology and now a part of Experian, today announced a partnership with Conversion Logic, the martech industry's most accurate unified marketing attribution provider. Conversion Logic will incorporate unified cross-screen data from Tapad's Device Graph™ to identify related devices and media exposures to enhance reporting on the path to conversion. By connecting Conversion Logic's proprietary Ensemble Method, which combines numerous state-of-the-art machine learning algorithms, tuned for each customer use-case for the most accurate results, with Tapad's unified, cross-device technology, marketers will benefit from a highly scientific approach to assessing advertising effectiveness with full, comprehensive customer insights. Linking these technologies will increase marketers' real-time ability to optimize brands' marketing channel spend and creative at a more granular level. During the past six months, Tapad has rapidly grown its data business, doubling the number of companies integrating the Device Graph™ into their platforms and growing the annualized revenue run rate by 210%. Tapad's highly scalable, cross-device data has been confirmed by Nielsen to be very precise. Tapad augments platforms' and publishers' tech stacks with additional scale and relevancy, granting advertisers amplified targeting and analysis options. The growth of the Device GraphTM has allowed Tapad to provide a growing network that benefits all partners with more efficient, effective consumer engagement. "Combining highly accurate data from Tapad with our own user ID technology and understanding how devices may be related at an individual level provides additional visibility into the path to conversion," said Alison Lohse, COO and co-founder of Conversion Logic. "The more we know about the customer journey, the more effective, efficient and customized marketers can be with marketing efforts. With Tapad, we have achieved a unified customer view that helps us piece together the purchase journey while preserving proven accuracy." "Conversion Logic's Ensemble Method delivers singularly customized and precise results that are not just accurate, but actionable," said Dave Fall, COO of Tapad. "The combination of powerful technology and a user-friendly interface, plus Tapad's ability to only consider relevant and scalable components in the marketplace, creates a more concentrated and beneficial environment for both its partners and clients." Contact us today!
B2B marketers can now deliver the right message to the right user at the right time across devices and channels NEW YORK, NY–(Marketwired – Jun 1, 2016) – Madison Logic, one of the world's fastest growing companies dedicated to solving the digital needs of B2B marketers, is partnering with Tapad, the leading provider of unified and now a part of Experian, cross-screen marketing technology solutions. Now business-to-business (B2B) marketers can power targeted advertising and content syndication programs across all channels, including smartphones, computers and tablets. The increasing shift in content consumption across mobile devices makes cross-device identification and attribution a top priority for B2B marketers. The Madison Logic and Tapad partnership gives B2B marketers unprecedented reach and scale with the ability to run always-on, cross-device, account-based marketing programs targeting decision makers who are actively researching similar products and services. "Screens are everywhere and so is the B2B buyer," said Vin Turk, SVP of Audience Development for Madison Logic. "This partnership allows marketers to harness the power of Madison Logic's intent data and combine it with Tapad's cross-device solutions to connect with the most-likely-to-convert prospects with hyper-relevant content wherever and whenever they're doing their research." "Relevance is essential to the success of B2B marketers, particularly now, when breaking through the clutter is difficult," said Dave Fall, COO of Tapad. "This partnership with Madison Logic allows marketers to leverage their existing customers while identifying and reaching new audiences with messaging tailored to every device." For more information about Madison Logic's account-based marketing platform, please visit https://www.madisonlogic.com/account-based-marketing/. For more information about Tapad's cross-platform advertising solutions, please visit https://www.experian.com/marketing/consumer-sync. Contact us today!