In 2022, Google began changing the availability of the information available in User-Agent strings across their Chromium browsers. The change is to use the set of HTTP request header fields called Client Hints. Through this process, a server can request, and if approved by the client, receive information that would have been previously freely available in the User-Agent string. This change is likely to have an impact on publishers across the open web that may use User-Agent information today.
To explain what this change means, how it will impact the AdTech industry, and what you can do to prepare, we spoke with Nate West, our Director of Product.
What is the difference between User-Agents and Client Hints?
A User-Agent (UA) is a string, or line of text, that identifies information about a web server’s browser and operating system. For example, it can indicate if a device is on Safari on a Mac or Chrome on Windows.
Here is an example UA string from a Mac laptop running Chrome:

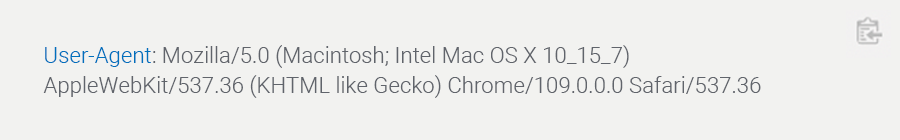
To limit the passive fingerprinting of users, Google is reducing components of the UA strings in their Chromium browsers and introducing Client Hints. When there is a trusted relationship between first-party domain owners and third-party servers, Client Hints can be used to share the same data.
This transition began in early 2022 with bigger expected changes beginning in February 2023. You can see in the above example, Chrome/109.0.0.0, where browser version information is already no longer available from the UA string on this desktop Chrome browser.
How can you use User-Agent device attributes today?
UA string information can be used for a variety of reasons. It is a component in web servers that has been available for decades. In the AdTech space, it can be used in various ad targeting use cases. It can be used by publishers to better understand their audience. The shift to limit access and information shared is to prevent nefarious usage of the data.
What are the benefits of Client Hints?
By using Client Hints, a domain owner, or publisher, can manage access to data activity that occurs on their web properties. Having that control may be advantageous. The format of the information shared is also cleaner than parsing a string from User-Agents. Although, given that Client Hints are not the norm across all browsers, a long-term solution may be needed to manage UA strings and Client Hints.
An advantage of capturing and sharing Client Hint information is to be prepared and understand if there is any impact to your systems and processes. This will help with the currently planned transition by Google, but also should the full UA string become further restricted.
Who will be impacted by this change?
Publishers across the open web should lean in to understand this change and any potential impact to them. The programmatic ecosystem supporting real-time bidding (RTB) needs to continue pushing for adoption of OpenRTB 2.6, which supports the passing of client hint information in place of data from UA strings.
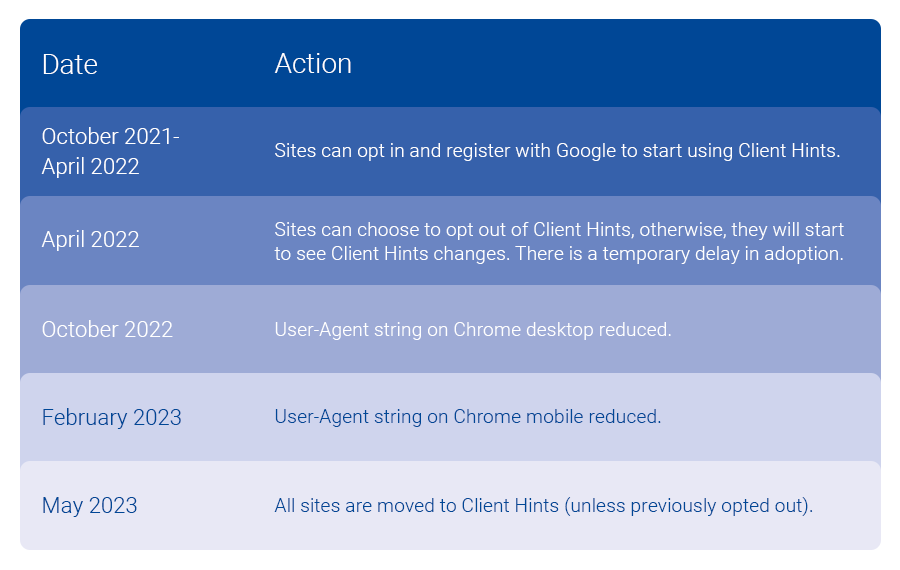
What is Google’s timeline for implementing Client Hints?

Do businesses have to implement Client Hints? What happens if they don’t?
Not capturing and sharing with trusted partners can impact capabilities in place today. Given Chromium browsers account for a sizable portion of web traffic, the impact will vary for each publisher and tech company in the ecosystem. I would assess how UA strings are in use today, where you may have security concerns or not, and look to get more information on how to maintain data sharing with trusted partners.
We can help you adopt Client Hints
Reach out to our Customer Success team at tapadcustomersuccess@experian.com to explore the best options to handle the User-Agent changes and implement Client Hints. As leaders in the AdTech space, we’re here to help you successfully make this transition. Together we can review the options available to put you and your team on the best path forward.
About our expert

Nate West, Director of Product
Nate West joined Experian in 2022 as the Director of Product for our identity graph. Nate focuses on making sure our partners maintain and grow identity resolution solutions today in an ever-changing future state. He has over a decade of experience working for media organizations and AdTech platforms.
Latest posts

Facebook has become a cultural phenomenon over the years and an object of affection for marketers to connect with its users. Experian Simmons has put together 10 consumer behavioral stats based on their National Consumer Study and New Media Study about the social networking site leading up to its Friday IPO launch: 39% of Facebook users say “this website gives me something to talk about.” Top 3 reasons Facebook users visit social networking sites: 86% to keep in touch with friends 72% for fun 66% to reconnect with/find people they’ve lost touch with 78% of Facebook users have shown support for a group or business on a social networking site. 34% of Facebook users have played games on a social networking site. Among those: 73% play social games (like Farmville, SIMS social, etc) 68% play casual games (like Bejeweled, etc) 73% play games on a social networking site once or more a day 28% of Facebook users with cell phones and 42% of Facebook users with a tablet computer have downloaded a social networking app for the device Adult residents of the following Designated Market Areas (DMAs) with 1,000,000 or more adult residents are the most likely to have visited Facebook in the last 7 days: ) Seattle-Tacoma, WA Austin, TX Salt Lake City, UT Portland, OR Washington, DC 15% of Facebook visitors follow a musical group on a social networking site, 14% follow a TV show, 11% follow a newspaper or news outlet and 4% follow a magazine. The average Facebook user is 39.3 years old. The average Facebook user claims an annual household income of $69,900 with annual household spending on discretionary goods and services of $15,500. Hispanic users of Facebook are 55% more likely than non-Hispanic users to say they like to follow their favorite brands or companies on social networking sites. Don’t miss 15 stats about Facebook, previously posted on the Experian Marketing services blog. . For more information like the data provided above please download the Experian Marketing Services 2012 Digital Marketer report.

Today, it costs more than $40 to send a five pound package from the U.S. to Canada or Mexico. The cost to Europe or South America is even more expensive. For U.S. companies operating on a global scale, such as retail specialists or ecommerce organizations, address accuracy is crucial. Organizations can’t afford undeliverable mail and packages due to a wrong address – the total cost would be unmanageable. Mistakes happen frequently, whether it is an error by the company or the customer. If a mistake is made, companies can’t ask the customer to cover delivery fees, leaving the organization with the bill. Retailers must also consider potential delays due to long distances and custom checks. Altogether, address errors result in a poor customer experience and a decrease in efficiency. Implementing international address verification will save money, time and improve the customer experience. By combining primary address data from national postal authorities with partner-supplied data, businesses can verify international addresses from countries all around the world.

On April 22nd, Americans and many of their terrestrial counterparts in countries around the world will celebrate Earth Day, a tradition that was started in the United States by Wisconsin Senator Gaylord Nelson in 1970. Much has changed on the planet since the first Earth Day, and even in recent years attitudes continue to evolve when it comes to our outlook towards the environment. In 2007, Experian Simmons created the GreenAware consumer segmentation, which classified respondents to the Simmons National Consumer Study between 2005 until 2007 into one of four mutually exclusive segments based on their consumer behaviors and attitudes toward the environment. Since then, Experian Simmons has continuously classified all adult respondents into the GreenAware segments providing our clients with valuable insights into the evolution of the environmental movement. The four GreenAware segments are: Behavioral Greens: This group of people thinks and acts green. They have negative attitudes towards products that pollute and incorporate green practices into their lives on a regular basis. Think Greens: This group of consumers think green, but don’t always act green. Potential Greens: This group neither behaves, nor thinks along particularly environmentally conscious lines and remains on the fence about key green issues. True Browns: They are not environmentally conscious, and may in fact have negative attitudes about environmental issues. Since 2005, we have observed a nearly constant increase in the percent of U.S. adults who are classified as Behavioral Greens, the “greenest” segment of the four. Today, 33% of adults are Behavioral Greens, up from 27% who were classified as such in 2005. Meantime, Think Greens have maintained an almost perfectly constant 21% share of the population. The size of the True Browns segment has also remained constant at between 14% and 15% of the total adult population. The Potential Green segment, however, has steadily declined in market share from 39% in 2005 to 31% today. La Vida Verde Hispanic Americans have traditionally been ahead of the curve when it comes to green thoughts and deeds and they’re only getting greener with time. Today, 39% of Hispanic adults are Behavioral Greens, up from 33% in 2007. Just 32% of non-Hispanic adults are Behavioral Greens today, up from 29% who fell into the greenest segment in 2007. Interestingly, among the True Browns segment there are virtually no Hispanics to be found, and, in fact, while the True Brown population is actually growing among non-Hispanics, Hispanics are increasingly moving to greener segments. Specifically, just 1.3% of Hispanics are True Browns today, down from 8% who registered as such in 2007. By comparison, 17% of non-Hispanics are True Browns today, up from 14% in 2007. Green Today, Greener Tomorrow? The illustration below shows the alignment of America’s largest metropolitan areas with the four GreenAware segments today and in 2007. We see that residents of the San Francisco-, New York- and Miami-areas are the most likely to be in alignment with the Behavioral Green mindset today. Denizens of Washington, D.C., Los Angeles, Chicago, Philadelphia and Boston tend to fit more closely with the Think Green set that has green attitudes and intentions, but not always the actions to back it up. But things are changing. In fact, since 2007, we’ve seen that as local minds change, some cities become aligned with a different, often greener, segment. Let’s look at Chicago, for instance. In 2007, Chicagoans’ environmental outlook was more reflective of a mix of Potential Greens and True Browns. Since then, local attitudes have changed so much that Chicago-area residents are now more aligned with Think Greens and Behavioral Greens. Likewise, Cleveland, which was clearly a True Brown town in 2007, now falls in step with the Potential Green segment. In five years’ time, who knows? Cleveland could be America’s next green leader. Not brown now towns Looking at markets large and small with the biggest drop in concentration of True Browns, we see that attitudes in inland markets located in Gulf States have become disproportionately less brown since the Deepwater Horizon oil spill in 2010. In fact, seven of the ten Designated Market Areas (DMA) that saw the biggest decline in the percentage of their population classified as True Browns between 2007 and 2011 are inland markets in states bordering the Gulf of Mexico. While the oil didn’t directly reach these markets, the attitude change did spread: For example, 3.2% of adults residing in the Columbus-Tupelo-West Point, Mississippi DMA today are classified as True Browns, down from 19.3% who were categorized as such in 2007. In Macon, Georgia, while not a Gulf State, a more impressive shift took place. In 2007, the Macon, Georgia DMA had the fourth highest percentage of its population classified as True Browns (20.1%) out of 209 DMAs. Today, only 5.8% of area residents are True Browns, which makes it the market with the 10th lowest concentrations of True Browns in the nation. Macon still has one of the lowest shares of residents who are Behavioral Greens in the nation, but what a difference a few years makes. While the towns directly in the path of the oil spill are not among those with the biggest relative decline in True Browns, area residents’ attitudes did take on a greener hue since the spill. Today, 8.4% of residents in Panama City are True Browns down from 17.3% in 2007. Likewise, only 9.8% of adults in both the Mobile-Pensacola and Biloxi Gulfport DMAs are True Browns down from 17.3% and 19.0%, respectively, who fell into the least green segment prior to the spill. Learn more about Experian Simmons consumer segmentation offerings