In 2022, Google began changing the availability of the information available in User-Agent strings across their Chromium browsers. The change is to use the set of HTTP request header fields called Client Hints. Through this process, a server can request, and if approved by the client, receive information that would have been previously freely available in the User-Agent string. This change is likely to have an impact on publishers across the open web that may use User-Agent information today.
To explain what this change means, how it will impact the AdTech industry, and what you can do to prepare, we spoke with Nate West, our Director of Product.
What is the difference between User-Agents and Client Hints?
A User-Agent (UA) is a string, or line of text, that identifies information about a web server’s browser and operating system. For example, it can indicate if a device is on Safari on a Mac or Chrome on Windows.
Here is an example UA string from a Mac laptop running Chrome:

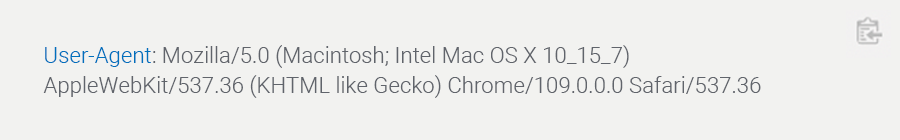
To limit the passive fingerprinting of users, Google is reducing components of the UA strings in their Chromium browsers and introducing Client Hints. When there is a trusted relationship between first-party domain owners and third-party servers, Client Hints can be used to share the same data.
This transition began in early 2022 with bigger expected changes beginning in February 2023. You can see in the above example, Chrome/109.0.0.0, where browser version information is already no longer available from the UA string on this desktop Chrome browser.
How can you use User-Agent device attributes today?
UA string information can be used for a variety of reasons. It is a component in web servers that has been available for decades. In the AdTech space, it can be used in various ad targeting use cases. It can be used by publishers to better understand their audience. The shift to limit access and information shared is to prevent nefarious usage of the data.
What are the benefits of Client Hints?
By using Client Hints, a domain owner, or publisher, can manage access to data activity that occurs on their web properties. Having that control may be advantageous. The format of the information shared is also cleaner than parsing a string from User-Agents. Although, given that Client Hints are not the norm across all browsers, a long-term solution may be needed to manage UA strings and Client Hints.
An advantage of capturing and sharing Client Hint information is to be prepared and understand if there is any impact to your systems and processes. This will help with the currently planned transition by Google, but also should the full UA string become further restricted.
Who will be impacted by this change?
Publishers across the open web should lean in to understand this change and any potential impact to them. The programmatic ecosystem supporting real-time bidding (RTB) needs to continue pushing for adoption of OpenRTB 2.6, which supports the passing of client hint information in place of data from UA strings.
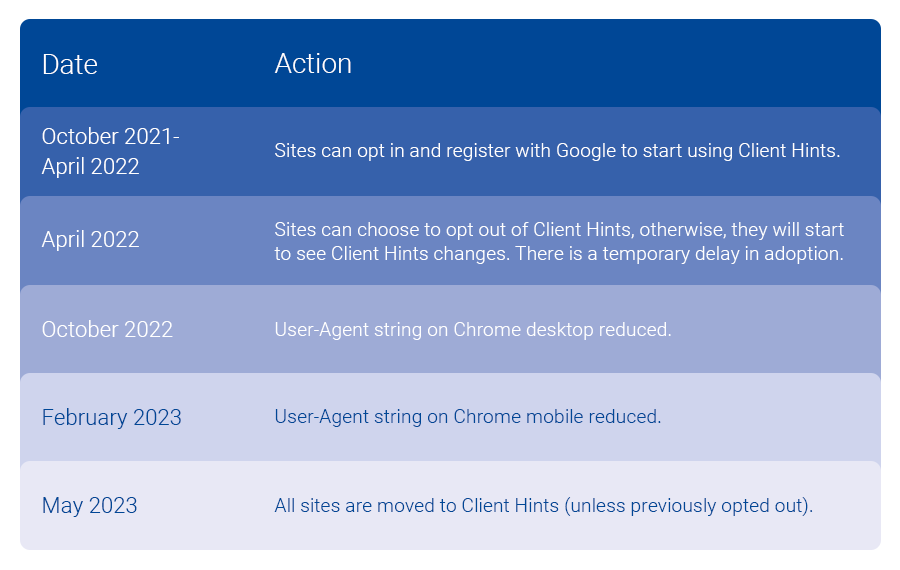
What is Google’s timeline for implementing Client Hints?

Do businesses have to implement Client Hints? What happens if they don’t?
Not capturing and sharing with trusted partners can impact capabilities in place today. Given Chromium browsers account for a sizable portion of web traffic, the impact will vary for each publisher and tech company in the ecosystem. I would assess how UA strings are in use today, where you may have security concerns or not, and look to get more information on how to maintain data sharing with trusted partners.
We can help you adopt Client Hints
Reach out to our Customer Success team at tapadcustomersuccess@experian.com to explore the best options to handle the User-Agent changes and implement Client Hints. As leaders in the AdTech space, we’re here to help you successfully make this transition. Together we can review the options available to put you and your team on the best path forward.
About our expert

Nate West, Director of Product
Nate West joined Experian in 2022 as the Director of Product for our identity graph. Nate focuses on making sure our partners maintain and grow identity resolution solutions today in an ever-changing future state. He has over a decade of experience working for media organizations and AdTech platforms.
Latest posts

Two storied franchises will collide in this year’s Super Bowl, the Green Bay Packers and the Pittsburgh Steelers. Sports fans from both markets are huge supporters of their football teams, but a look into their behavior and attitudes reveals passions beyond a one-dimensional Cheesehead or Towel Twirler. Considering the vast preferences, marketers recognize the need to define characteristics that truly distinguish their target audience. To provide those insights, we conducted a detailed market analysis using a wide variety of data sources including research information from Experian Simmons, Hitwise, and the Mosaic Consumer Lifestyle segmentation solution, which defines the predominant household types for each area (as featured in yesterday’s post: Cheeseheads vs. Terrible Towels). Today, we delve further into the hearts and houses of Green Bay and Pittsburgh area residents. GREEN BAY FANS PACK THEM IN FOR TAILGATING Green Bay area residents are more passionate about tailgating compared to their rivals in Pittsburgh. Among those who identify themselves as NFL football fans, Green Bay fans are 1.45 times more likely than Pittsburgh fans to have participated in a tailgate party within the past 12 months. They are also better equipped to tailgate due to a higher ownership rate for midsize SUVs, and both light duty and full size pickups (Road & Track magazine top-rated picks for tailgating), compared to Pittsburgh fans. STELLA AND STEELERS GO TOGETHER With every tailgate comes a beverage of choice, and in today’s analysis we’ve found that Bud Light and Budweiser are the light/low calorie and regular domestic brands of beer favored the most by both Green Bay and Pittsburgh fans. However, Pittsburgh fans are 1.56 times more likely than Green Bay fans to down a few of premium brand, Stella Artois. Notably, along with its best selling brands, Anheuser-Busch plans to devote a portion of its multi-million dollar ad spend to this Belgian import. FANTASIZING ABOUT FOOTBALL While all that tailgating is going on, Green Bay fans might also be boasting about their latest fantasy sports selections. They are 1.34 times more likely to say that they participate in a fantasy sports league compared to Pittsburgh fans. That’s not to say that Pittsburgh fans don’t enjoy their fantasy sports, indexing above the national average for visiting fantasy sports and football websites. PLAYING IN THE GREAT OUTDOORS Packers and Steelers fans enjoy being out in the elements, so chances are you’ll probably never see a dome over either Lambeau or Heinz Field. The most popular Green Bay football fan activities, with a higher participation rate compared to Pittsburgh fans, are: golfing, camping, state fairs, hunting, power boating and motorcycling. In the Pittsburgh area, with its impressive network of recreational trails, residents are 1.23 times more likely to in-line/roller skate and are 1.36 times more likely to play hockey, compared to Green Bay. Off land analysis shows that despite Green Bay residents’ close proximity to Lake Michigan and a multitude of water sport opportunities, Pittsburgh fans are more likely to spend time on the water, namely: canoeing, kayaking, sailing, and fly fishing. THROWING DEEP VERSUS HANDING OFF Each year Super Bowl advertisers try to reach their audiences across broadly defined demographics with little ability to measure the direct impact of their super-sized investments. It’s the equivalent of throwing a “Hail Mary” and hoping the receiver will leap above the clutter of defenders and catch the ball. Direct marketers, however, are using the behavioral and attitudinal data we’ve shared here to deliver their messages to a precisely targeted sub-audience. For marketers who want to be relevant and target accurately, this capability is the playmaker that scores a game winning touchdown every time. Click here for the full article Blog post author: Bill Schneider, VP, Experian Marketing Services. We’d love to hear your stories and how you’ve used lifestyle data. Please leave your comments or feedback below.

According to weekly trend data from Experian Simmons DataStreamSM, the number of U.S. adults paying a monthly visit to microblogging site Twitter.com has fallen during the past year by 14%. As of November 29, 2010, 8.25 million adults had made at least one visit to Twitter.com during the previous 30 days, down from 9.54 million adults who had visited the site in the 30 days prior to November 30, 2009. Does this mean the ultimate “fail whale” is lurking just over the horizon for Twitter? Not just yet. Among those who visit Twitter.com, Simmons DataStream shows that the average number of visits per month rose a relative 37% in the last year. Twitter.com visits in late November 2010, in fact, reached an average of 10.0 visits per month, up from just 7.3 visits per month the year prior. As visit frequency increased, however, the duration of the average Twitter.com session declined, suggesting visitors today are seeking more frequent quick hits, rather than spending longer periods of time reading through posts. According to Experian Hitwise, the average amount of time Twitter.com visitors spend on the site during a typical session fell to 13 minutes, 12 seconds on November 27, 2010, down from an average of 15 minutes, 12 seconds spent on the site each session on November 28, 2009. That said, Americans are still spending more time on Twitter.com than ever before. According to Experian Simmons estimates, Americans spent an estimated 2 hours and 12 minutes tweeting and reading tweets on Twitter.com in November 2010, up from 1 hour and 51 minutes spent on the site during November 2009. Swim on, fail whale, swim on. To tweet this blog post, click on the green “retweet” button at the top of this item. For more information on Simmons DataStream weekly reporting of nearly 40,000 consumer variables, visit our website.

As we ring in the New Year this week, Americans will be tossing back a few adult beverages in celebration. While alcohol consumption certainly increases around holidays and other times of celebration, many Americans imbibe year-round. So where across this great land of ours are you most likely to find adults willing and able to raise a glass (or two) and where are you most likely to be surrounded by teetotalers? Experian Simmons has the answer. Leveraging data from our SimmonsLOCAL study, we examined the drinking patterns of adults of legal drinking age in the 106 Designated Market Areas (DMAs) with populations of at least 500,000 adults age 21 and older. We then ranked those markets by the number of alcoholic beverages consumed by the average adult during a typical month. The chart below lists the DMAs that consume the most alcoholic beverages per capita in a typical month. First place goes to Boston, where the average adult of legal drinking age regularly kicks back 14.4 drinks a month. (Celebrations in Beantown are probably already underway.) Rank DMA Average drinks per month 1 Boston 14.4 2 Austin 13.8 3 Providence-New Bedford 13.4 4 Madison 13.2 4 Hartford & New Haven 13.2 6 Philadelphia 13.1 7 Chicago 13 8 Denver 12.9 9 Tallahassee-Thomasville 12.8 9 Milwaukee 12.8 11 Minneapolis-St. Paul 12.6 11 West Palm Beach-Ft. Pierce 12.6 11 Seattle-Tacoma 12.6 11 Tucson (Sierra Vista) 12.6 15 Green Bay-Appleton 12.5 16 San Diego 12.4 16 Baltimore 12.4 16 Washington, DC 12.4 16 Albany-Schenectady-Troy 12.4 20 New Orleans 12.3 20 St. Louis 12.3 20 Colorado Springs-Pueblo 12.3 23 Burlington-Plattsburgh 12.2 23 Syracuse 12.2 23 Norfolk-Portsmouth-Newport News 12.2 23 Spokane 12.2 23 Portland-Auburn 12.2 Source: Experian Simmons Adult residents of the markets listed below surely know how to have a good time-it's just unlikely to include a cocktail. The chart below lists the DMAs that consume the fewest alcoholic beverages per capita in a typical month. Residents of Chattanooga consume only 6 alcoholic beverages per month, on average, making it the least imbibing market-and probably the one that feels the best the morning after a big gathering. Rank DMA Average drinks per month 106 Chattanooga 6 105 Salt Lake City 7.2 105 Florence-Myrtle Beach 7.2 105 Charleston-Huntington 7.2 105 Tri-Cities, TN-VA 7.2 101 Knoxville 7.4 100 Lexington 7.9 99 Birmingham 8 98 Huntsville-Decatur 8.5 97 Nashville 8.9 97 Evansville 8.9 95 Paducah-Cape Girardeau-Harrisburg-Mt Vernon 9.1 94 Springfield, MO 9.2 94 Tulsa 9.2 94 Greenville-New Bern-Washington 9.2 91 Memphis 9.3 90 Greenville-Spartanburg-Asheville-Anderson 9.4 90 Jackson, MS 9.4 90 Wichita-Hutchinson Plus 9.4 86 Little Rock-Pine Bluff 9.5 86 Louisville 9.5 86 Ft. Smith-Fayetteville-Springdale-Rogers 9.5 83 Fresno-Visalia 9.6 82 Greensboro-High Point-Winston Salem 9.7 82 Roanoke-Lynchburg 9.7 Source: Experian Simmons For more information on SimmonsLOCAL's vivid reporting of consumer behaviors, attitudes, lifestyles and media consumption in 209 Designated Market Areas down to the ZIP code level, visit our website.