In 2022, Google began changing the availability of the information available in User-Agent strings across their Chromium browsers. The change is to use the set of HTTP request header fields called Client Hints. Through this process, a server can request, and if approved by the client, receive information that would have been previously freely available in the User-Agent string. This change is likely to have an impact on publishers across the open web that may use User-Agent information today.
To explain what this change means, how it will impact the AdTech industry, and what you can do to prepare, we spoke with Nate West, our Director of Product.
What is the difference between User-Agents and Client Hints?
A User-Agent (UA) is a string, or line of text, that identifies information about a web server’s browser and operating system. For example, it can indicate if a device is on Safari on a Mac or Chrome on Windows.
Here is an example UA string from a Mac laptop running Chrome:

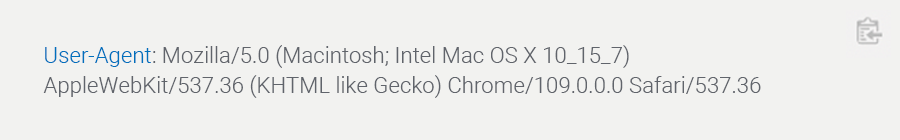
To limit the passive fingerprinting of users, Google is reducing components of the UA strings in their Chromium browsers and introducing Client Hints. When there is a trusted relationship between first-party domain owners and third-party servers, Client Hints can be used to share the same data.
This transition began in early 2022 with bigger expected changes beginning in February 2023. You can see in the above example, Chrome/109.0.0.0, where browser version information is already no longer available from the UA string on this desktop Chrome browser.
How can you use User-Agent device attributes today?
UA string information can be used for a variety of reasons. It is a component in web servers that has been available for decades. In the AdTech space, it can be used in various ad targeting use cases. It can be used by publishers to better understand their audience. The shift to limit access and information shared is to prevent nefarious usage of the data.
What are the benefits of Client Hints?
By using Client Hints, a domain owner, or publisher, can manage access to data activity that occurs on their web properties. Having that control may be advantageous. The format of the information shared is also cleaner than parsing a string from User-Agents. Although, given that Client Hints are not the norm across all browsers, a long-term solution may be needed to manage UA strings and Client Hints.
An advantage of capturing and sharing Client Hint information is to be prepared and understand if there is any impact to your systems and processes. This will help with the currently planned transition by Google, but also should the full UA string become further restricted.
Who will be impacted by this change?
Publishers across the open web should lean in to understand this change and any potential impact to them. The programmatic ecosystem supporting real-time bidding (RTB) needs to continue pushing for adoption of OpenRTB 2.6, which supports the passing of client hint information in place of data from UA strings.
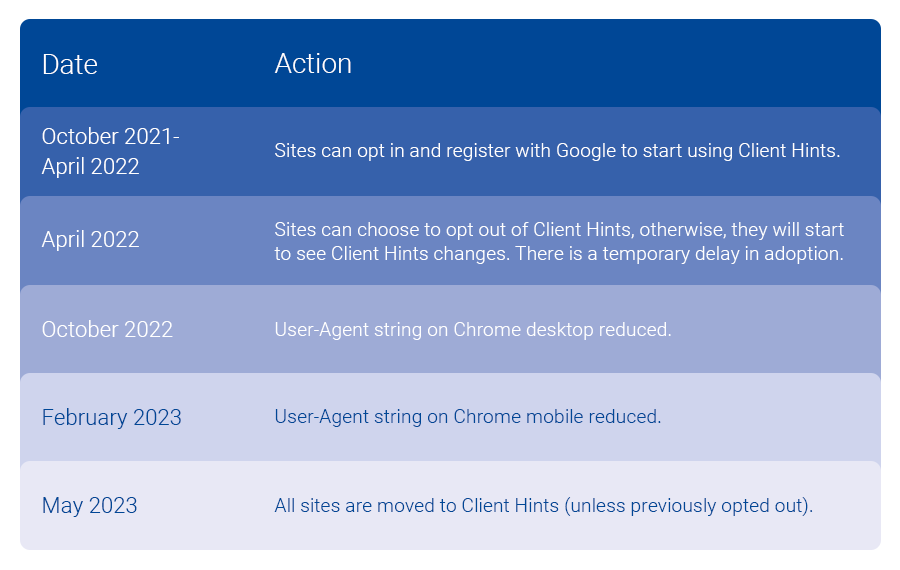
What is Google’s timeline for implementing Client Hints?

Do businesses have to implement Client Hints? What happens if they don’t?
Not capturing and sharing with trusted partners can impact capabilities in place today. Given Chromium browsers account for a sizable portion of web traffic, the impact will vary for each publisher and tech company in the ecosystem. I would assess how UA strings are in use today, where you may have security concerns or not, and look to get more information on how to maintain data sharing with trusted partners.
We can help you adopt Client Hints
Reach out to our Customer Success team at tapadcustomersuccess@experian.com to explore the best options to handle the User-Agent changes and implement Client Hints. As leaders in the AdTech space, we’re here to help you successfully make this transition. Together we can review the options available to put you and your team on the best path forward.
About our expert

Nate West, Director of Product
Nate West joined Experian in 2022 as the Director of Product for our identity graph. Nate focuses on making sure our partners maintain and grow identity resolution solutions today in an ever-changing future state. He has over a decade of experience working for media organizations and AdTech platforms.
Latest posts

Coffee drinkers in America Coffee plays such an integral part of every day life in America that it may be safe to say that coffee helps the United States go round. In fact, fully 60% of all U.S. households use either whole or ground coffee beans at home. Experian Simmons extensively reviewed the American coffee drinker for this report which features detailed insights into the coffee-drinking American. In addition, we compare the patrons of Dunkin’ Donuts and Starbucks, the leading players in the battle for brew. Coffee in the Home The average U.S. household that uses whole or ground coffee consumes 4.2 cups per day. In total that’s about 280.5 million cups of coffee consumed at home by Americans each day or about 102 billion cups per year. Among households that use coffee, 89% stock regular coffee and 46% stock decaf.* Among households that use coffee, 84% use pre-ground coffee and 26% use whole bean coffee at least some of the time.* Instant Flavored Coffee Over a quarter of households (27%) stock instant coffee. Sixteen percent of households use instant flavored coffee. The most commonly used flavors among instant flavored coffee drinkers are: Older Americans More Likely to Drink Coffee Fifty-seven percent of adults ages 18-24 live in households that use coffee, but 25 to 34 year olds are the least likely to stock coffee in their cupboards with only 54% reporting they use whole or ground bean coffee at home. Coffee Use Increases with Household Income Seventy percent of Americans who report annual household incomes of $150,000+ drink coffee compared with 54% of those with household income less than $25,000. Dunkin' Donuts Vs. Starbucks Dunkin' Donuts 11% of American adults go to DD Between 9.15.08 and 9.15.09 the share of DD customers who go there 6+ times a month is up 11%* DD consumers are 41% more likely than the average adult to be registered Independents and 9% less likely to be registered Republicans Starbucks 13% of American adults go to Starbucks Between 9.15.08 and 9.15.09 the share of Starbucks customers who go there 6+ times a month is down 22% Starbucks consumers are 11% more likely to be registered Independents and 11% more likely to be registered Republicans Coffee Drinkers Are Coffee Drinkers A majority of coffee-drinking Americans are loyal to their franchise. However, there are a considerable number of Dunkin’ Donuts and Starbucks consumers who jump between coffee houses. How Often Americans Order Their Coffee The majority of both Dunkin’ Donuts and Starbucks customers visit each chain between one and five times in a typical month. Learn more about Simmons consumer research and studies.

Two-thirds of U.S. Households Use Coupons Two-thirds of American households (67%) use coupons. And while the vast majority of households using coupons (87%) say they use them to save money, 30% also say that coupons are a way for them to try out new products. Newspapers are still the number one coupon source with 70% of coupon households still getting their coupons from a newspaper. The Internet is growing as a coupon source. A quarter of coupon households get coupons online today, up 46% in the last three years. What Americans Buy With Their coupons Nearly half of all American households use coupons to buy food/grocery products making them the most common items purchased with coupons followed by cleaning products and beauty/grooming products. Seven percent of households buy tobacco using coupons. Where Are Coupons Redeemed? Given that half of U.S. households use coupons for food/grocery products, it’s no surprise that 60% of all households redeem coupons in supermarket, grocery or convenient stores. While only a quarter of all households use coupons at restaurants/fast food chains, that number has risen by 9% since 2006, when 23% of households redeemed coupons at restaurants. Coupons Attract New Consumers With the start of the holiday shopping season around the corner retailers want to make sure consumers visit their store and/or website. One way to drive consumer traffic is with coupons. Close to 50 percent of American adults say they are likely to be drawn to a store they don’t normally shop at by a coupon. The Experian Simmons retail shopping segment known as Mall Maniacs make up just 12% of all shoppers, but that group is 82% more likely to be drawn to a new store by a coupon. Percentage of U.S. Adult Population by Shopping Segment Mall Maniacs and Status Strivers are 66% and 26% more likely, respectively, to appreciate getting emails that announce new products and services. Identifying these consumers is key to maximize online marketing dollars. Additionally, with more and more consumers shopping online, companies should ensure that coupons are redeemable both online and in-stores.

Definition of an NHL and Non-NHL fan The behaviors and preferences of National Hockey League (NHL) and non-NHL fans are compared in this report. Below are the definitions of each consumer type: NHL fans are 18+ adults who are either “very”, “somewhat”, or “a little bit” interested in NHL Non-NHL fans are 18+ adults who are “not at all” interested in NHL Who Are NHL Fans? Compared to 2006, there are 11 percent more American adults who are NHL fans*. And with 52 percent of its fans under the age of 45, the NHL’s fan base is – for the most part – young. NHL Fans Are Educated and Well Paid NHL fans are more likely than non-NHL fans to have graduated college and attained a graduate degree. The benefits of their higher education is clear as NHL fans are 64 percent more likely than non-NHL fans to personally earn an income of $150,000 or more annually. Next we’ll examine a few luxuries NHL fans enjoy: home-ownership, watches, and vehicles. Home Owners Seventy-seven percent of NHL fans own their place of residence. The graph below charts the percentage of NHL and non-NHL fans who own any resident type (includes house, condominium, co-op and mobile home). As illustrated, there are more NHL fans than non-fans who own homes that value at $300,000 or more. Watches Twenty-six percent of NHL fans purchased a watch for themselves or someone else in the last 12 months and their tastes are not cheap. NHL fans are 2.6 times more likely than non-fans to have spent $500 or more on a timepiece. Vehicles Similar to their watch purchasing behavior, NHL fans are willing to splurge on their vehicles. For their most recent vehicle purchase, NHL fans were 13 percent more likely than non-NHL fans to spend over $30,000. Internet Purchases NHL fans spend big online. During the last 12 months, NHL fans spent a total $9.9 billion on Internet purchases. Among those who made a purchase in the last year, NHL fans are 25 percent more likely than non-NHL fans to spend $1,000 or more online during the year. In fact, 41 percent of NHL fans who shop the Internet spend at least $500 online a year. Business Purchase Decision Makers The previous slides established that NHL fans have expensive taste and aren’t troubled spending extra to purchase personal items. However, can the same be said for business-related purchases? Indeed it can. Not only are there more NHL fans than non-fans making business purchase decisions, they’re also 54 percent more likely than non-fans to spend $100,000 or more on office products. Conclusion The National Hockey League has a growing fan base that doesn’t mind spending extra for products and services.