In 2022, Google began changing the availability of the information available in User-Agent strings across their Chromium browsers. The change is to use the set of HTTP request header fields called Client Hints. Through this process, a server can request, and if approved by the client, receive information that would have been previously freely available in the User-Agent string. This change is likely to have an impact on publishers across the open web that may use User-Agent information today.
To explain what this change means, how it will impact the AdTech industry, and what you can do to prepare, we spoke with Nate West, our Director of Product.
What is the difference between User-Agents and Client Hints?
A User-Agent (UA) is a string, or line of text, that identifies information about a web server’s browser and operating system. For example, it can indicate if a device is on Safari on a Mac or Chrome on Windows.
Here is an example UA string from a Mac laptop running Chrome:

To limit the passive fingerprinting of users, Google is reducing components of the UA strings in their Chromium browsers and introducing Client Hints. When there is a trusted relationship between first-party domain owners and third-party servers, Client Hints can be used to share the same data.
This transition began in early 2022 with bigger expected changes beginning in February 2023. You can see in the above example, Chrome/109.0.0.0, where browser version information is already no longer available from the UA string on this desktop Chrome browser.
How can you use User-Agent device attributes today?
UA string information can be used for a variety of reasons. It is a component in web servers that has been available for decades. In the AdTech space, it can be used in various ad targeting use cases. It can be used by publishers to better understand their audience. The shift to limit access and information shared is to prevent nefarious usage of the data.
What are the benefits of Client Hints?
By using Client Hints, a domain owner, or publisher, can manage access to data activity that occurs on their web properties. Having that control may be advantageous. The format of the information shared is also cleaner than parsing a string from User-Agents. Although, given that Client Hints are not the norm across all browsers, a long-term solution may be needed to manage UA strings and Client Hints.
An advantage of capturing and sharing Client Hint information is to be prepared and understand if there is any impact to your systems and processes. This will help with the currently planned transition by Google, but also should the full UA string become further restricted.
Who will be impacted by this change?
Publishers across the open web should lean in to understand this change and any potential impact to them. The programmatic ecosystem supporting real-time bidding (RTB) needs to continue pushing for adoption of OpenRTB 2.6, which supports the passing of client hint information in place of data from UA strings.
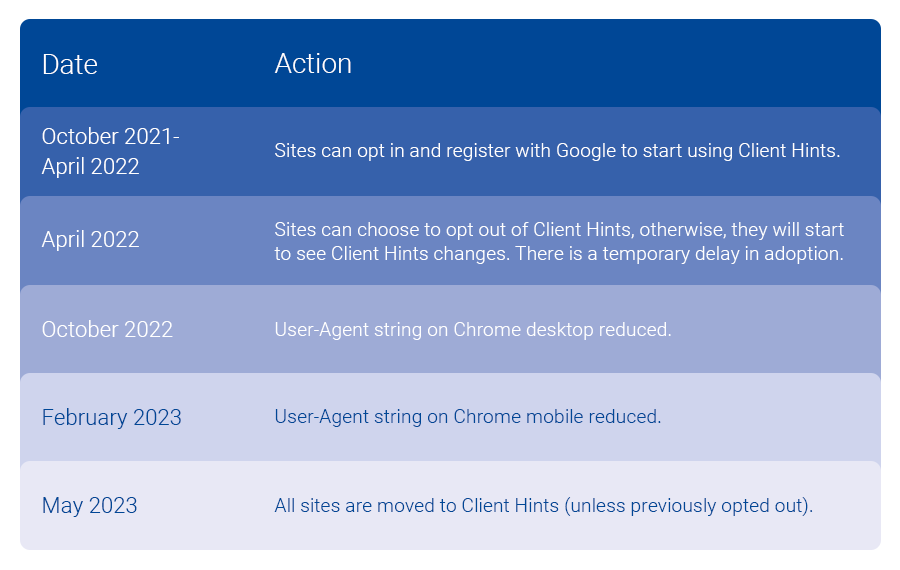
What is Google’s timeline for implementing Client Hints?

Do businesses have to implement Client Hints? What happens if they don’t?
Not capturing and sharing with trusted partners can impact capabilities in place today. Given Chromium browsers account for a sizable portion of web traffic, the impact will vary for each publisher and tech company in the ecosystem. I would assess how UA strings are in use today, where you may have security concerns or not, and look to get more information on how to maintain data sharing with trusted partners.
We can help you adopt Client Hints
Reach out to our Customer Success team at tapadcustomersuccess@experian.com to explore the best options to handle the User-Agent changes and implement Client Hints. As leaders in the AdTech space, we’re here to help you successfully make this transition. Together we can review the options available to put you and your team on the best path forward.
About our expert

Nate West, Director of Product
Nate West joined Experian in 2022 as the Director of Product for our identity graph. Nate focuses on making sure our partners maintain and grow identity resolution solutions today in an ever-changing future state. He has over a decade of experience working for media organizations and AdTech platforms.
Latest posts

2013 has been a milestone year for those lobbying on behalf of expanded rights of Lesbian, Gay, Bisexual and Transgendered (LGBT) Americans. With 12 states and the District of Columbia now formally recognizing same sex marriages and two highly anticipated rulings from the U.S. Supreme Court expected shortly, the momentum is currently on the side of those seeking greater recognition and support of LGBT-related issues. The speed with which public attitudes have shifted towards greater acceptance of LGBT individuals and their causes has left many marketers scrambling to devise plans that are not only inclusive of LGBT consumers, but in many instances, designed to overtly and publically court this influential and growing consumer segment. The 2013 LGBT consumer report out from Experian Marketing Services delivers insights marketers need to better understand the market that is on everyone’s radar. In this first of a series of blog posts, we’ll highlight key data from the report. Readers can download the full report at any time here. Living out Loud In 2006, when Experian Marketing Services first began measuring sexual orientation among respondents to our Simmons® National Consumer Study, we found that 3.4% of all non-Hispanic adults self-identified as either lesbian, gay, bisexual or transgendered (LGBT), a figure consistent with what leading LGBT researchers predicted at the time. However today, 4.3% of the non-Hispanic adult population self-identifies as LGBT, a figure that has risen slowly but steadily year-after-year. Younger adults have consistently been more likely to identify as LGBT, and in fact today, 5.8 percent of 18 to 34 year olds say they are lesbian, gay, bisexual or transgendered. As a result, the adult LGBT population predictably skews towards the younger age cohorts. Specifically, 36% of LGBT adults today are aged 18 to 34 versus 26% of the heterosexual population in that age range. Likewise, while 20% of heterosexual adults are age 65 and older, just 16% of LGBT adults are in this age range, though our data shows that the share of adults age 65 and older identifying as LGBT has also risen. Home and Family As a growing number of U.S. states pass laws recognizing same-sex marriages and civil unions, we see an increasing percentage of gay and lesbian Americans reporting that they are married. In 2007, for example, when only Massachusetts allowed same-sex marriage, 8% of gay men and 14% of lesbian women said they were married. Today, 17% of gay men and 16% of lesbian women are married. Marriage rates among lesbian and gay adults still lag well behind those of heterosexuals, but the gap is closing from both sides. In fact, while marriage rates are rising among lesbians and gays, they’re falling among heterosexuals. Today, 58% of heterosexual men and 53% of heterosexual women are married, compared to 60% of heterosexual men and 55% of heterosexual women who were married in 2007. The Pink Dollar Income levels are important to consider when targeting consumers, but more important is determining the amount of money left over for non-essentials after the other bills are paid. Despite earning nearly identical salaries, gay men have lower annual household discretionary expenditures than heterosexual men. Likewise, lesbian households have fewer dollars than those of heterosexual women to spend on non-essentials. This is mostly likely due to the fact that both lesbian and gay adults tend to reside in larger cities where the cost of living can be considerably higher than average. Interestingly, when household size is brought into the equation, we see that gay males actually have higher discretionary spending per capita than heterosexual men. In fact, gay men live in households that devote $6,794 per capita annually to non-essentials, which is $753 more than what heterosexual men spend. Forthcoming posts from this series will include insights into the automotive and food vertical markets; the mobile habits of LGBT consumers; and an examination of online visitors to LGBT content sites. Don’t want to wait? Download the full report now. Also, learn more about the Simmons LGBT Consumer Study, the only syndicated, national probability sample survey that measures the lifestyles, attitudes, media habits and brand preferences of the LGBT population giving marketers actionable insights into this powerful consumer segment that can be directly compared with those of heterosexuals.

The importance of affiliate marketing as a marketing channel is evident; it ranks as one of the most effective marketing channels for retailers, along with paid search and e-mail. While effective affiliate marketing relies on two groups, the publishers (affiliates) who display advertisements online and the advertisers (merchants) who aim to increase sales for their online shop, incorporating insights from Experian Marketing Services’ Hitwise can strengthen affiliate programs. I recently worked with Rakuten LinkShare on a webinar which highlights how their affiliate marketing services partnered with Hitwise create a proven package for success by providing valuable and actionable insights to affiliate marketers in understanding and targeting key consumer segments. Identify sites sending traffic to your category For our case study, we examined a custom category of Rakuten LinkShare department store clients and compared them with a category of department store non-clients. Using Hitwise, we examined which publisher sites sent traffic to each of the categories in order to identify the best affiliates to partner with. Among the top 20 publisher websites, a number of fashion and style content websites were sources of traffic to LinkShare Department store clients. Fashion and trend focused affiliate sites, namely ShopStyle and Polyvore, pointed to clear fashion editorial interest amongst those who visited LinkShare department store clients. Consider search terms used to capture consumer interest and intent Next, we looked at generic terms that sent traffic to affiliate site ShopStyle. Terms included searches for products sold in department stores such as variations of “heels” and “dresses”. The data indicates that ShopStyle is a good candidate to partner with because it attracted visits from those who are interested in fashion, looking for a deal, and who are likely in-market for specific products. Monitor effectiveness of affiliate programs and make timely decisions Hitwise can also be used by marketers to evaluate the effectiveness of their affiliate partnerships. For this example, we were able to show that Rakuten LinkShare affiliates sent a larger share of traffic to department store clients versus non-clients, pointing to a clear benefit from affiliate partnerships. As affiliate marketing is an increasingly critical channel for marketers, the importance of selecting the best and most relevant publishers is clear. When used in conjunction with affiliate marketing programs, Hitwise enables marketers to understand competitors’ online distribution and sources of traffic, select the best affiliates to partner with, and quantify the return on investment from partnerships.

New data from Experian Marketing Services’ Simmons® ConnectSM mobile and digital panel sheds light on the way smartphone users spend time using their phone, with the average adult clocking 58 minutes daily on their device. On average, smartphone owners devote 26% of the time they spend on their phone talking and another 20% texting. Social networking eats up 16% of smartphone time while browsing the mobile web accounts for 14% of time spent. Emailing and playing games account for roughly 9% and 8% of daily smartphone time, respectively, while use of the phone’s camera and GPS each take up another 2% of our smartphone day. *Activities include use of a smartphone’s native features dedicated to each activity as well as downloaded apps whose primary function falls under the given activity. For instance, “watch video” includes the act of watching video on the smartphone’s native video player as well as use of video apps such as YouTube, Netflix, etc. iPhone versus Android users Smartphone users may constantly debate which operating system is supreme, but we see clear differences between the ways consumers use their phone depending on the operating system that runs it. For starters, iPhone users spend an hour and fifteen minutes using their phones per day, a full 26 minutes more than the typical Android phone owner. Additionally, iPhone and Android smartphone owners use their phones in markedly different ways. For instance, 28% of the time that Android users spend using their phones is dedicated to talking, whereas iPhone users spend only 22% of their smartphone time talking on the device. Android owners also devote a greater share of time visiting websites on their phone than iPhone owners. On the other hand, iPhone owners spend a disproportionately greater share of smartphone time than Android owners texting, emailing, using the camera and social networking. Note on time spent It may surprise some to read that an activity like watching video accounts for such a small share (less than 1%) of the typical adult’s daily smartphone use. However, for the charts above to sum to a single daily total it was necessary to calculate individual activity contribution using a base of all smartphone owners, including those who don’t spend any time engaging in a given activity during a typical day. The chart below provides additional insights into the time spent engaging in the major smartphone activities examining only those individuals who engaged in each activity during a 24-hour period. I’ve also added into the chart a reach and frequency metric to indicate the popularity of each activity and the number of times per day that individuals engage in them. In the chart, the activities with the largest bubbles are those in which the greatest share of smartphone owners engage during a typical day and include the usual suspects: talking (79%), texting (76%), visiting websites (62%), emailing (61%) and social networking (52%). Activities with the fewest daily participants are: watching video, which 2.3% of smartphone owners do during a typical day, and reading, which just 0.5% of smartphone owners do daily. Given that nearly 98% of smartphone users don’t watch videos on their phone during a typical day, it’s easier to understand why video comprises such a low share of the average adult’s daily smartphone use. However, the chart above reveals that those who do watch video on their phone spend, on average, 5 minutes a day watching videos spread out over 4.2 different viewing sessions. For more information on consumers’ usage of smartphones, digital tablets, computers and other traditional and digital media platforms, check out Simmons Connect.