Loading...

How Cuebiq increased match rates amidst signal loss using Activity Feed

Published: June 26, 2024 by Lucy Simmonds

Cuebiq used Experian’s Activity Feed to resolve digital ad exposures to in-store purchases so that marketers could know the effectiveness of their clients’ media campaigns.

Cuebiq’s mission, as an offline intelligence and measurement company, is to deliver the most accurate and reliable insights on how digital marketing efforts impact offline consumer behavior. This case study shows how Cuebiq, despite signal loss, partnered with Experian to continue delivering in-store lift analyses. To achieve this, Cuebiq used Experian’s Activity Feed to resolve digital ad exposures to in-store purchases, so that marketers could know the effectiveness of their clients’ media campaigns.

Activity Feed helped Cuebiq increase its match rates by using all the identifiers supported in Experian’s signal-agnostic Digital Graph, reducing its reliance on third-party cookies. By partnering with Experian, Cuebiq could help their clients, marketers, more accurately measure their campaigns and optimize their media.

What is Activity Feed?

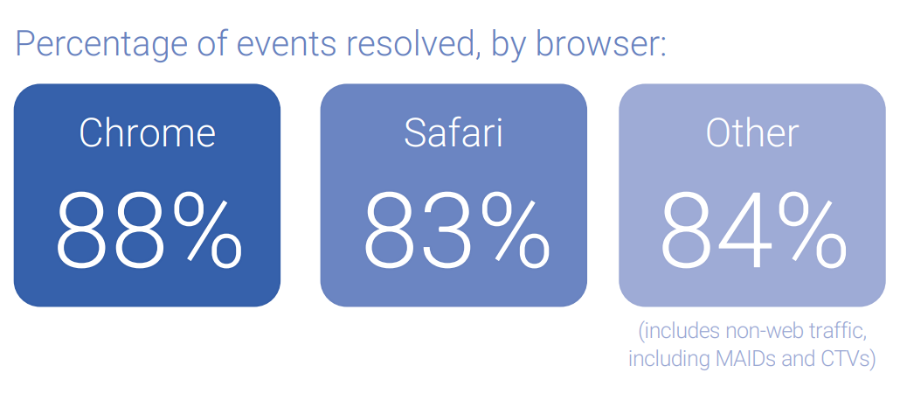
Experian’s Activity Feed pulls together fragmented digital event data from all digital channels, including browsers like Safari and Firefox that restrict traditional tracking methods. Activity Feed ingests and ties this digital ad exposure data to household or individual profiles hourly, helping clients associate that data to offline purchase activity made by that household or individual. Activity Feed plays a crucial role in overcoming fragmented data and helping marketers accurately measure their cross-channel marketing efforts.

Challenge: Increasing match rates across digital platforms

Cuebiq wanted to enhance how well they connect digital ad exposures, across web, mobile and connected TV (CTV) to specific mobile ad IDs (MAIDs), of those who visited clients’ stores. They needed a single technology partner who could collect data across these environments and improve these connections, especially as iOS updates, like iOS 14.5, posed potential challenges.

With the ability to resolve exposures to households, individuals, and MAIDs to then facilitate attribution of digital exposures to offline store visitation, Cuebiq could continue to provide accurate reports on how online ads impact offline consumer behavior. This clarity in data enables their clients to fine-tune their marketing strategies.

Cuebiq’s key objectives included:

  • Resolving digital exposures to MAIDs
  • Increasing overlap of offline and online data  
  • Improving the effectiveness of offline measurement offerings

Activity Feed: The solution to increase match rates

Cuebiq used Activity Feed to resolve data from cookieless environments like Safari to a single household or individual and saw significantly higher match rates. Cuebiq was able to track cross-channel media exposures, resolve them to MAIDs, and then use the Activity Feed output to correlate in-store visitation and sales to their clients’ media campaigns. Cuebiq also implemented the Experian pixel, which they placed to track all their marketers’ impressions (mobile, CTV, web traffic, etc.). The Experian pixel collects information in real-time, such as:

  • Timestamp
  • Cookies
  • Device ID (MAID/CTV) when available
  • IP address
  • User-Agent
  • Impression ID

“Before we started working with Experian, we couldn’t fully maximize ad views across the complex digital landscape. In just a few weeks, they were able to maximize the match rate across the fragmented digital inventory, solving a huge problem when it comes to cross-channel attribution.”

Luca Bocchiardi, Director of Product, Cuebiq

Results

Activity Feed combines separate data streams and matches them back to a household. This enables Cuebiq to expand household IDs and accurately identify MAIDs that are seen in-store for cross-channel measurement. Over a 21-day period, Cuebiq passed ~1 billion events to Experian. Activity Feed resolved 85% of total events to a household, 91% of which were tied to MAIDs.

Percentage of events resolved by browser:  

Chrome: 88%  

Safari: 83%  

Other (including non-web traffic, including MAIDs and CTVs): 84%  

By implementing Activity Feed, Cuebiq was successfully able to:

  • Gain clearer insights into the success of their client‘s campaigns
  • Match consumer engagements in a privacy-compliant manner
  • Tell the story of the key performance indicators (KPIs) related to their marketing efforts

Prepare for a cookieless future with higher match rates

Activity Feed is prepared for a cookieless future and uses alternative IDs, like ID5 IDs, hashed emails, and IPs for identity resolution, ensuring no reliance on third-party cookies. Experian remains fully committed to exploring a suite of next-generation solutions and prioritizing continued testing of different industry solutions, including the Google Privacy Sandbox, to help customers prepare for a future without cookies. We’ve identified six viable alternatives to third-party cookies, how these alternatives fall short, and how Experian can help you navigate these alternatives.

“Experian’s customer service is extremely efficient and collaborative. We trust them to keep putting our business first long-term.”

Luca Bocchiardi, Director of Product, Cuebiq

Download the full case study to discover how Cuebiq used Activity Feed to overcome their challenges. Your path to maximizing match rates and resolving data from cookieless environments starts here.


About Cuebiq

Cuebiq is transforming the way businesses interact with mobility data to providing a high-quality and transparent currency to map and measure offline behavior. They are at the forefront of all industry privacy standards, establishing an industry-leading data collection framework, and making it safe and easy for businesses to use location data for innovation and growth.

To learn more, visit their website at www.cuebiq.com


Latest posts

Loading…
Demographic and Preferences of Coffee Drinkers in America

Coffee drinkers in America Coffee plays such an integral part of every day life in America that it may be safe to say that coffee helps the United States go round. In fact, fully 60% of all U.S. households use either whole or ground coffee beans at home. Experian Simmons extensively reviewed the American coffee drinker for this report which features detailed insights into the coffee-drinking American. In addition, we compare the patrons of Dunkin’ Donuts and Starbucks, the leading players in the battle for brew. Coffee in the Home The average U.S. household that uses whole or ground coffee consumes 4.2 cups per day. In total that’s about 280.5 million cups of coffee consumed at home by Americans each day or about 102 billion cups per year. Among households that use coffee, 89% stock regular coffee and 46% stock decaf.* Among households that use coffee, 84% use pre-ground coffee and 26% use whole bean coffee at least some of the time.* Instant Flavored Coffee Over a quarter of households (27%) stock instant coffee. Sixteen percent of households use instant flavored coffee. The most commonly used flavors among instant flavored coffee drinkers are: Older Americans More Likely to Drink Coffee Fifty-seven percent of adults ages 18-24 live in households that use coffee, but 25 to 34 year olds are the least likely to stock coffee in their cupboards with only 54% reporting they use whole or ground bean coffee at home. Coffee Use Increases with Household Income Seventy percent of Americans who report annual household incomes of $150,000+ drink coffee compared with 54% of those with household income less than $25,000. Dunkin' Donuts Vs. Starbucks Dunkin' Donuts 11% of American adults go to DD Between 9.15.08 and 9.15.09 the share of DD customers who go there 6+ times a month is up 11%* DD consumers are 41% more likely than the average adult to be registered Independents and 9% less likely to be registered Republicans Starbucks 13% of American adults go to Starbucks Between 9.15.08 and 9.15.09 the share of Starbucks customers who go there 6+ times a month is down 22% Starbucks consumers are 11% more likely to be registered Independents and 11% more likely to be registered Republicans Coffee Drinkers Are Coffee Drinkers A majority of coffee-drinking Americans are loyal to their franchise. However, there are a considerable number of Dunkin’ Donuts and Starbucks consumers who jump between coffee houses. How Often Americans Order Their Coffee The majority of both Dunkin’ Donuts and Starbucks customers visit each chain between one and five times in a typical month. Learn more about Simmons consumer research and studies.

Dec 01,2009 by

Coupons Boost Holiday Sales Revenue

Two-thirds of U.S. Households Use Coupons Two-thirds of American households (67%) use coupons. And while the vast majority of households using coupons (87%) say they use them to save money, 30% also say that coupons are a way for them to try out new products. Newspapers are still the number one coupon source with 70% of coupon households still getting their coupons from a newspaper. The Internet is growing as a coupon source. A quarter of coupon households get coupons online today, up 46% in the last three years. What Americans Buy With Their coupons Nearly half of all American households use coupons to buy food/grocery products making them the most common items purchased with coupons followed by cleaning products and beauty/grooming products. Seven percent of households buy tobacco using coupons. Where Are Coupons Redeemed? Given that half of U.S. households use coupons for food/grocery products, it’s no surprise that 60% of all households redeem coupons in supermarket, grocery or convenient stores. While only a quarter of all households use coupons at restaurants/fast food chains, that number has risen by 9% since 2006, when 23% of households redeemed coupons at restaurants. Coupons Attract New Consumers With the start of the holiday shopping season around the corner retailers want to make sure consumers visit their store and/or website. One way to drive consumer traffic is with coupons. Close to 50 percent of American adults say they are likely to be drawn to a store they don’t normally shop at by a coupon. The Experian Simmons retail shopping segment known as Mall Maniacs make up just 12% of all shoppers, but that group is 82% more likely to be drawn to a new store by a coupon. Percentage of U.S. Adult Population by Shopping Segment Mall Maniacs and Status Strivers are 66% and 26% more likely, respectively, to appreciate getting emails that announce new products and services. Identifying these consumers is key to maximize online marketing dollars. Additionally, with more and more consumers shopping online, companies should ensure that coupons are redeemable both online and in-stores.

Nov 23,2009 by

Shopping Preferences and Purchase Behaviors of NHL Fans

Definition of an NHL and Non-NHL fan The behaviors and preferences of National Hockey League (NHL) and non-NHL fans are compared in this report. Below are the definitions of each consumer type: NHL fans are 18+ adults who are either “very”, “somewhat”, or “a little bit” interested in NHL Non-NHL fans are 18+ adults who are “not at all” interested in NHL Who Are NHL Fans? Compared to 2006, there are 11 percent more American adults who are NHL fans*. And with 52 percent of its fans under the age of 45, the NHL’s fan base is – for the most part – young. NHL Fans Are Educated and Well Paid NHL fans are more likely than non-NHL fans to have graduated college and attained a graduate degree. The benefits of their higher education is clear as NHL fans are 64 percent more likely than non-NHL fans to personally earn an income of $150,000 or more annually. Next we’ll examine a few luxuries NHL fans enjoy: home-ownership, watches, and vehicles. Home Owners Seventy-seven percent of NHL fans own their place of residence. The graph below charts the percentage of NHL and non-NHL fans who own any resident type (includes house, condominium, co-op and mobile home). As illustrated, there are more NHL fans than non-fans who own homes that value at $300,000 or more. Watches Twenty-six percent of NHL fans purchased a watch for themselves or someone else in the last 12 months and their tastes are not cheap. NHL fans are 2.6 times more likely than non-fans to have spent $500 or more on a timepiece. Vehicles Similar to their watch purchasing behavior, NHL fans are willing to splurge on their vehicles. For their most recent vehicle purchase, NHL fans were 13 percent more likely than non-NHL fans to spend over $30,000. Internet Purchases NHL fans spend big online. During the last 12 months, NHL fans spent a total $9.9 billion on Internet purchases. Among those who made a purchase in the last year, NHL fans are 25 percent more likely than non-NHL fans to spend $1,000 or more online during the year. In fact, 41 percent of NHL fans who shop the Internet spend at least $500 online a year. Business Purchase Decision Makers The previous slides established that NHL fans have expensive taste and aren’t troubled spending extra to purchase personal items. However, can the same be said for business-related purchases? Indeed it can. Not only are there more NHL fans than non-fans making business purchase decisions, they’re also 54 percent more likely than non-fans to spend $100,000 or more on office products. Conclusion The National Hockey League has a growing fan base that doesn’t mind spending extra for products and services.

Oct 05,2009 by

Subscribe to our newsletter

Enter your name and email for the latest updates

This site is protected by reCAPTCHA and the Google Privacy Policy and Terms of Service apply.

About Experian Marketing Services

At Experian Marketing Services, we use data and insights to help brands have more meaningful interactions with people. As leaders in the evolution of the advertising landscape, Experian Marketing Services can help you identify your customers and the right potential customers, uncover the most appropriate communication channels, develop messages that resonate, and measure the effectiveness of marketing activities and campaigns.

Visit our website

Subscribe to our newsletter

Stay up to date on the latest industry news and receive expert tips from our marketing experts.
Subscribe now!