At Experian, we power data-driven advertising through connectivity. Today, we’re excited to introduce our newest offering, which helps drive that connectivity: Experian’s Collaboration in clean rooms. This offering is now generally available in InfoSum, AWS Clean Rooms, and others. Experian can now facilitate successful data collaboration across multiple secure environments, such as at Experian, through crosswalks, and now in clean rooms.
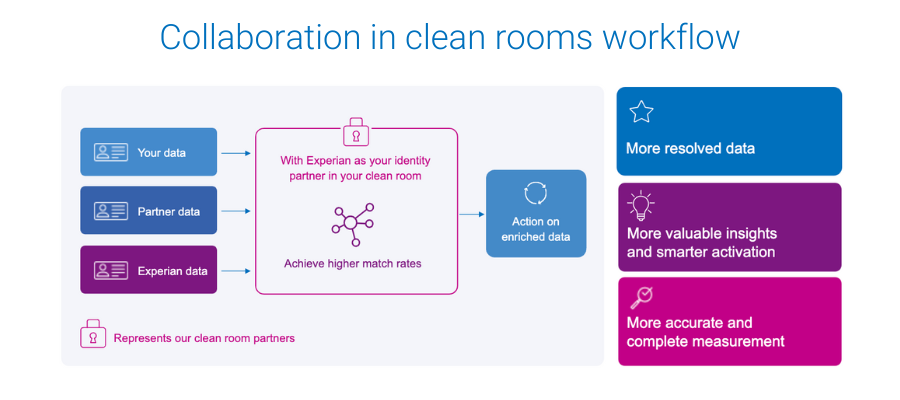
Whether you are a marketer or partner, introducing Experian’s signal-agnostic offline and digital identity graphs into your clean rooms lets you run identity resolution directly in the clean room. This means your data remains secure, while you and your partner experience higher match rates and you maximize your clean room investment, leading to:
- More resolved data
- More valuable insights and smarter activation
- More accurate and complete measurement
A leap forward in data collaboration
Backed by Experian’s Global Data Principles, Experian’s deep roots in identity and data security offer the most effective and trusted ways to match data and protect consumer privacy. Our signal-agnostic approach means we can resolve all types of offline and digital identity signals, which is valuable now and will become even more valuable as third-party cookies go away. Additionally, data hygiene is built right into our collaboration offering, helping to improve match rates.
The benefits of working with Experian’s rich identity data in a clean room environment are obvious so it is no surprise to see that 55% of data clean room users are using identity solutions in data clean rooms.
What are data clean rooms?
Data clean rooms are a tool typically used for data sharing, built on top of cloud providers such as AWS clean rooms. They protect data privacy while facilitating data collaboration among clients, marketers, businesses, and their partners. As the industry places greater emphasis on data security, clean rooms have emerged as secure environments that allow companies to:
- Enhance user privacy protection
- Minimize the impact of cookie deprecation
- Secure collaboration with data partners
The industry has quickly realized that, for what clean rooms offer by way of privacy and security, they lack resolution capabilities, typically yielding subpar match rates.
Benefits of Experian’s Collaboration in clean rooms offering
Built upon Experian’s rich offline and digital identity foundation, with support for various identifiers across platforms, Collaboration in clean rooms helps clients maximize the value of their data and meet the diverse needs of modern business.
Through Experian’s Collaboration in clean rooms offering, you can:
- Collaborate with partners for richer data insights
- Achieve higher match rates
- Improve audience building
- Produce more accurate and complete reports
- Ensure data privacy
Regardless of the identifier type you are looking to collaborate on, Experian has the identity data to support you and your partner. This leads to higher match rates and more resolved data for you to use to benefit your media initiatives.
Get started with Collaboration in clean rooms today
Get the most out of your first-party data with Collaboration in clean rooms, which is essential for businesses that want to compete in a fast-paced market and connect with consumers in today’s data-driven world. We understand the importance of data collaboration and make seamless, secure data sharing possible between partners.
Connect with us today to find out how Experian’s Collaboration in clean rooms offering ensures privacy while allowing you to extract valuable data insights for smarter data-driven advertising.
Latest posts

New data from Experian Marketing Services’ Simmons® ConnectSM mobile and digital panel sheds light on the way smartphone users spend time using their phone, with the average adult clocking 58 minutes daily on their device. On average, smartphone owners devote 26% of the time they spend on their phone talking and another 20% texting. Social networking eats up 16% of smartphone time while browsing the mobile web accounts for 14% of time spent. Emailing and playing games account for roughly 9% and 8% of daily smartphone time, respectively, while use of the phone’s camera and GPS each take up another 2% of our smartphone day. *Activities include use of a smartphone’s native features dedicated to each activity as well as downloaded apps whose primary function falls under the given activity. For instance, “watch video” includes the act of watching video on the smartphone’s native video player as well as use of video apps such as YouTube, Netflix, etc. iPhone versus Android users Smartphone users may constantly debate which operating system is supreme, but we see clear differences between the ways consumers use their phone depending on the operating system that runs it. For starters, iPhone users spend an hour and fifteen minutes using their phones per day, a full 26 minutes more than the typical Android phone owner. Additionally, iPhone and Android smartphone owners use their phones in markedly different ways. For instance, 28% of the time that Android users spend using their phones is dedicated to talking, whereas iPhone users spend only 22% of their smartphone time talking on the device. Android owners also devote a greater share of time visiting websites on their phone than iPhone owners. On the other hand, iPhone owners spend a disproportionately greater share of smartphone time than Android owners texting, emailing, using the camera and social networking. Note on time spent It may surprise some to read that an activity like watching video accounts for such a small share (less than 1%) of the typical adult’s daily smartphone use. However, for the charts above to sum to a single daily total it was necessary to calculate individual activity contribution using a base of all smartphone owners, including those who don’t spend any time engaging in a given activity during a typical day. The chart below provides additional insights into the time spent engaging in the major smartphone activities examining only those individuals who engaged in each activity during a 24-hour period. I’ve also added into the chart a reach and frequency metric to indicate the popularity of each activity and the number of times per day that individuals engage in them. In the chart, the activities with the largest bubbles are those in which the greatest share of smartphone owners engage during a typical day and include the usual suspects: talking (79%), texting (76%), visiting websites (62%), emailing (61%) and social networking (52%). Activities with the fewest daily participants are: watching video, which 2.3% of smartphone owners do during a typical day, and reading, which just 0.5% of smartphone owners do daily. Given that nearly 98% of smartphone users don’t watch videos on their phone during a typical day, it’s easier to understand why video comprises such a low share of the average adult’s daily smartphone use. However, the chart above reveals that those who do watch video on their phone spend, on average, 5 minutes a day watching videos spread out over 4.2 different viewing sessions. For more information on consumers’ usage of smartphones, digital tablets, computers and other traditional and digital media platforms, check out Simmons Connect.
New health information exchanges are prompting data quality efforts, as state and local healthcare agencies look to electronically share patient data.
If the time spent on the Internet for personal computers was distilled into an hour then 27 percent of it would be spent on social networking and forums across the United States, United Kingdom and Australia. In the U.S., 16 minutes out of every hour online is spent on social networking and forums, nine minutes on entertainment sites and five minutes shopping. Global comparison In the UK, 13 minutes out of every hour online is spent on social networking and forums, nine minutes on entertainment sites and six minutes shopping. Australian Internet users spend 14 minutes on social sites, nine on entertainment and four minutes shopping online. Across all three markets, time spent shopping online grew year-over-year, but the UK market emerged as having the most prolific online shoppers, spending proportionally more time on retail Websites than online users in the U.S. or Australia. British Internet users spent 10 percent of all time online shopping in 2012, compared to nine percent in the U.S. and six percent in Australia. This was in part due to a bumper winter holiday season in the UK where 370 million hours were spent shopping online, 24 percent higher than the monthly average. Consumption of news content also increased across all three markets with Australian users emerging as the most voracious consumers of news online. Six percent of all time spent online in Australia in 2012 was on a news Website, compared to five percent in the UK and four percent in the U.S. Meanwhile, the time spent on social media proportionate to other online activities declined across all three regions. The U.S., which has been the most dominant market for social media consumption in the last three years dropped from 30 percent of all time spent online to 27 percent. In Australia time spent on social dropped from 27 percent to 24 percent while in the UK it dipped from 25 percent to 22 percent year-over-year. This highlights the rise in access via 3G and 4G networks as consumers spend increasingly more time online while on the move. "Understanding consumer behavior across channels is more important than ever as more visits are being made on the move, particularly among social networking and email,” says Bill Tancer, general manager of global research for Experian Marketing Services. "With smartphones and tablets becoming more powerful, our data clearly indicates the difference between mobile and traditional desktop usage further enabling the ‘always on’ consumer mentality. Marketers need to understand these differences, as well as regionally, to ensure campaigns can be tailored for better and more effective engagement.” Mobile browsing When looking at the U.S. browsing data for mobile devices, email accounted for the largest time spent on average, for the same categories for Q1 2013. Email made up 23 percent of time spent on mobile devices for Q1-13, while social networking accounted for 15 percent. Entertainment had the third highest time spent with 13 percent, followed by shopping with 11 percent and travel with 9 percent. The mobile data does not include app usage, but does include mobile browsing within an app. Read more of the latest consumer trends in The 2013 Digital Marketer Report Learn more about consumer online behavior by visiting our Online Trends page Learn more about the author, Matt Tatham