
At Experian, we power data-driven advertising through connectivity. Today, we’re excited to introduce our newest offering, which helps drive that connectivity: Experian’s Collaboration in clean rooms. This offering is now generally available in InfoSum, AWS Clean Rooms, and others. Experian can now facilitate successful data collaboration across multiple secure environments, such as at Experian, through crosswalks, and now in clean rooms.
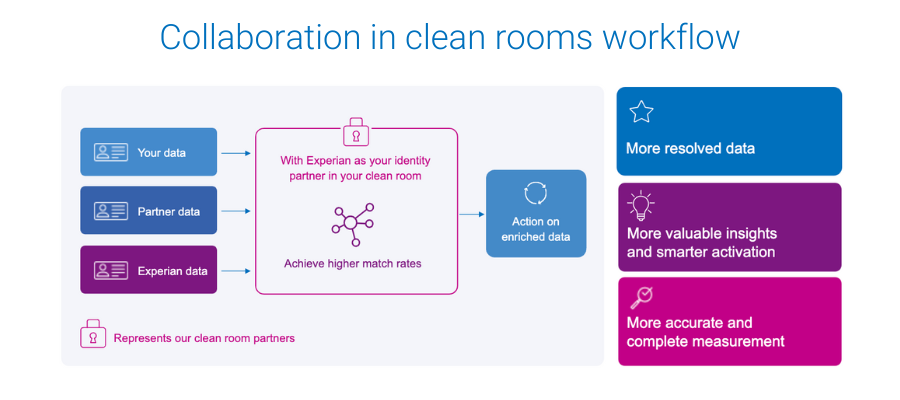
Whether you are a marketer or partner, introducing Experian’s signal-agnostic offline and digital identity graphs into your clean rooms lets you run identity resolution directly in the clean room. This means your data remains secure, while you and your partner experience higher match rates and you maximize your clean room investment, leading to:
- More resolved data
- More valuable insights and smarter activation
- More accurate and complete measurement
A leap forward in data collaboration
Backed by Experian’s Global Data Principles, Experian’s deep roots in identity and data security offer the most effective and trusted ways to match data and protect consumer privacy. Our signal-agnostic approach means we can resolve all types of offline and digital identity signals, which is valuable now and will become even more valuable as third-party cookies go away. Additionally, data hygiene is built right into our collaboration offering, helping to improve match rates.
The benefits of working with Experian’s rich identity data in a clean room environment are obvious so it is no surprise to see that 55% of data clean room users are using identity solutions in data clean rooms.

What are data clean rooms?
Data clean rooms are a tool typically used for data sharing, built on top of cloud providers such as AWS clean rooms. They protect data privacy while facilitating data collaboration among clients, marketers, businesses, and their partners. As the industry places greater emphasis on data security, clean rooms have emerged as secure environments that allow companies to:
- Enhance user privacy protection
- Minimize the impact of cookie deprecation
- Secure collaboration with data partners
The industry has quickly realized that, for what clean rooms offer by way of privacy and security, they lack resolution capabilities, typically yielding subpar match rates.
Benefits of Experian’s Collaboration in clean rooms offering
Built upon Experian’s rich offline and digital identity foundation, with support for various identifiers across platforms, Collaboration in clean rooms helps clients maximize the value of their data and meet the diverse needs of modern business.
Through Experian’s Collaboration in clean rooms offering, you can:
- Collaborate with partners for richer data insights
- Achieve higher match rates
- Improve audience building
- Produce more accurate and complete reports
- Ensure data privacy
Regardless of the identifier type you are looking to collaborate on, Experian has the identity data to support you and your partner. This leads to higher match rates and more resolved data for you to use to benefit your media initiatives.
Get started with Collaboration in clean rooms today
Get the most out of your first-party data with Collaboration in clean rooms, which is essential for businesses that want to compete in a fast-paced market and connect with consumers in today’s data-driven world. We understand the importance of data collaboration and make seamless, secure data sharing possible between partners.
Connect with us today to find out how Experian’s Collaboration in clean rooms offering ensures privacy while allowing you to extract valuable data insights for smarter data-driven advertising.
Latest posts

Two storied franchises will collide in this year’s Super Bowl, the Green Bay Packers and the Pittsburgh Steelers. Sports fans from both markets are huge supporters of their football teams, but a look into their behavior and attitudes reveals passions beyond a one-dimensional Cheesehead or Towel Twirler. Considering the vast preferences, marketers recognize the need to define characteristics that truly distinguish their target audience. To provide those insights, we conducted a detailed market analysis using a wide variety of data sources including research information from Experian Simmons, Hitwise, and the Mosaic Consumer Lifestyle segmentation solution, which defines the predominant household types for each area (as featured in yesterday’s post: Cheeseheads vs. Terrible Towels). Today, we delve further into the hearts and houses of Green Bay and Pittsburgh area residents. GREEN BAY FANS PACK THEM IN FOR TAILGATING Green Bay area residents are more passionate about tailgating compared to their rivals in Pittsburgh. Among those who identify themselves as NFL football fans, Green Bay fans are 1.45 times more likely than Pittsburgh fans to have participated in a tailgate party within the past 12 months. They are also better equipped to tailgate due to a higher ownership rate for midsize SUVs, and both light duty and full size pickups (Road & Track magazine top-rated picks for tailgating), compared to Pittsburgh fans. STELLA AND STEELERS GO TOGETHER With every tailgate comes a beverage of choice, and in today’s analysis we’ve found that Bud Light and Budweiser are the light/low calorie and regular domestic brands of beer favored the most by both Green Bay and Pittsburgh fans. However, Pittsburgh fans are 1.56 times more likely than Green Bay fans to down a few of premium brand, Stella Artois. Notably, along with its best selling brands, Anheuser-Busch plans to devote a portion of its multi-million dollar ad spend to this Belgian import. FANTASIZING ABOUT FOOTBALL While all that tailgating is going on, Green Bay fans might also be boasting about their latest fantasy sports selections. They are 1.34 times more likely to say that they participate in a fantasy sports league compared to Pittsburgh fans. That’s not to say that Pittsburgh fans don’t enjoy their fantasy sports, indexing above the national average for visiting fantasy sports and football websites. PLAYING IN THE GREAT OUTDOORS Packers and Steelers fans enjoy being out in the elements, so chances are you’ll probably never see a dome over either Lambeau or Heinz Field. The most popular Green Bay football fan activities, with a higher participation rate compared to Pittsburgh fans, are: golfing, camping, state fairs, hunting, power boating and motorcycling. In the Pittsburgh area, with its impressive network of recreational trails, residents are 1.23 times more likely to in-line/roller skate and are 1.36 times more likely to play hockey, compared to Green Bay. Off land analysis shows that despite Green Bay residents’ close proximity to Lake Michigan and a multitude of water sport opportunities, Pittsburgh fans are more likely to spend time on the water, namely: canoeing, kayaking, sailing, and fly fishing. THROWING DEEP VERSUS HANDING OFF Each year Super Bowl advertisers try to reach their audiences across broadly defined demographics with little ability to measure the direct impact of their super-sized investments. It’s the equivalent of throwing a “Hail Mary” and hoping the receiver will leap above the clutter of defenders and catch the ball. Direct marketers, however, are using the behavioral and attitudinal data we’ve shared here to deliver their messages to a precisely targeted sub-audience. For marketers who want to be relevant and target accurately, this capability is the playmaker that scores a game winning touchdown every time. Click here for the full article Blog post author: Bill Schneider, VP, Experian Marketing Services. We’d love to hear your stories and how you’ve used lifestyle data. Please leave your comments or feedback below.

According to weekly trend data from Experian Simmons DataStreamSM, the number of U.S. adults paying a monthly visit to microblogging site Twitter.com has fallen during the past year by 14%. As of November 29, 2010, 8.25 million adults had made at least one visit to Twitter.com during the previous 30 days, down from 9.54 million adults who had visited the site in the 30 days prior to November 30, 2009. Does this mean the ultimate “fail whale” is lurking just over the horizon for Twitter? Not just yet. Among those who visit Twitter.com, Simmons DataStream shows that the average number of visits per month rose a relative 37% in the last year. Twitter.com visits in late November 2010, in fact, reached an average of 10.0 visits per month, up from just 7.3 visits per month the year prior. As visit frequency increased, however, the duration of the average Twitter.com session declined, suggesting visitors today are seeking more frequent quick hits, rather than spending longer periods of time reading through posts. According to Experian Hitwise, the average amount of time Twitter.com visitors spend on the site during a typical session fell to 13 minutes, 12 seconds on November 27, 2010, down from an average of 15 minutes, 12 seconds spent on the site each session on November 28, 2009. That said, Americans are still spending more time on Twitter.com than ever before. According to Experian Simmons estimates, Americans spent an estimated 2 hours and 12 minutes tweeting and reading tweets on Twitter.com in November 2010, up from 1 hour and 51 minutes spent on the site during November 2009. Swim on, fail whale, swim on. To tweet this blog post, click on the green “retweet” button at the top of this item. For more information on Simmons DataStream weekly reporting of nearly 40,000 consumer variables, visit our website.

As we ring in the New Year this week, Americans will be tossing back a few adult beverages in celebration. While alcohol consumption certainly increases around holidays and other times of celebration, many Americans imbibe year-round. So where across this great land of ours are you most likely to find adults willing and able to raise a glass (or two) and where are you most likely to be surrounded by teetotalers? Experian Simmons has the answer. Leveraging data from our SimmonsLOCAL study, we examined the drinking patterns of adults of legal drinking age in the 106 Designated Market Areas (DMAs) with populations of at least 500,000 adults age 21 and older. We then ranked those markets by the number of alcoholic beverages consumed by the average adult during a typical month. The chart below lists the DMAs that consume the most alcoholic beverages per capita in a typical month. First place goes to Boston, where the average adult of legal drinking age regularly kicks back 14.4 drinks a month. (Celebrations in Beantown are probably already underway.) Rank DMA Average drinks per month 1 Boston 14.4 2 Austin 13.8 3 Providence-New Bedford 13.4 4 Madison 13.2 4 Hartford & New Haven 13.2 6 Philadelphia 13.1 7 Chicago 13 8 Denver 12.9 9 Tallahassee-Thomasville 12.8 9 Milwaukee 12.8 11 Minneapolis-St. Paul 12.6 11 West Palm Beach-Ft. Pierce 12.6 11 Seattle-Tacoma 12.6 11 Tucson (Sierra Vista) 12.6 15 Green Bay-Appleton 12.5 16 San Diego 12.4 16 Baltimore 12.4 16 Washington, DC 12.4 16 Albany-Schenectady-Troy 12.4 20 New Orleans 12.3 20 St. Louis 12.3 20 Colorado Springs-Pueblo 12.3 23 Burlington-Plattsburgh 12.2 23 Syracuse 12.2 23 Norfolk-Portsmouth-Newport News 12.2 23 Spokane 12.2 23 Portland-Auburn 12.2 Source: Experian Simmons Adult residents of the markets listed below surely know how to have a good time-it's just unlikely to include a cocktail. The chart below lists the DMAs that consume the fewest alcoholic beverages per capita in a typical month. Residents of Chattanooga consume only 6 alcoholic beverages per month, on average, making it the least imbibing market-and probably the one that feels the best the morning after a big gathering. Rank DMA Average drinks per month 106 Chattanooga 6 105 Salt Lake City 7.2 105 Florence-Myrtle Beach 7.2 105 Charleston-Huntington 7.2 105 Tri-Cities, TN-VA 7.2 101 Knoxville 7.4 100 Lexington 7.9 99 Birmingham 8 98 Huntsville-Decatur 8.5 97 Nashville 8.9 97 Evansville 8.9 95 Paducah-Cape Girardeau-Harrisburg-Mt Vernon 9.1 94 Springfield, MO 9.2 94 Tulsa 9.2 94 Greenville-New Bern-Washington 9.2 91 Memphis 9.3 90 Greenville-Spartanburg-Asheville-Anderson 9.4 90 Jackson, MS 9.4 90 Wichita-Hutchinson Plus 9.4 86 Little Rock-Pine Bluff 9.5 86 Louisville 9.5 86 Ft. Smith-Fayetteville-Springdale-Rogers 9.5 83 Fresno-Visalia 9.6 82 Greensboro-High Point-Winston Salem 9.7 82 Roanoke-Lynchburg 9.7 Source: Experian Simmons For more information on SimmonsLOCAL's vivid reporting of consumer behaviors, attitudes, lifestyles and media consumption in 209 Designated Market Areas down to the ZIP code level, visit our website.