At Experian, we power data-driven advertising through connectivity. Today, we’re excited to introduce our newest offering, which helps drive that connectivity: Experian’s Collaboration in clean rooms. This offering is now generally available in InfoSum, AWS Clean Rooms, and others. Experian can now facilitate successful data collaboration across multiple secure environments, such as at Experian, through crosswalks, and now in clean rooms.
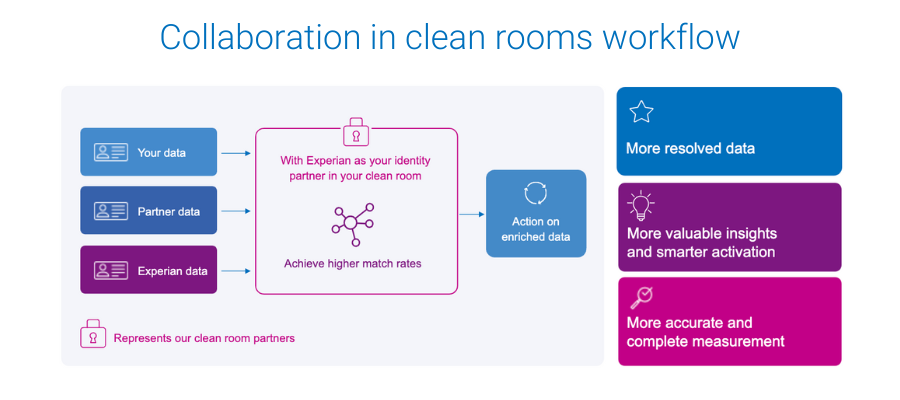
Whether you are a marketer or partner, introducing Experian’s signal-agnostic offline and digital identity graphs into your clean rooms lets you run identity resolution directly in the clean room. This means your data remains secure, while you and your partner experience higher match rates and you maximize your clean room investment, leading to:
- More resolved data
- More valuable insights and smarter activation
- More accurate and complete measurement
A leap forward in data collaboration
Backed by Experian’s Global Data Principles, Experian’s deep roots in identity and data security offer the most effective and trusted ways to match data and protect consumer privacy. Our signal-agnostic approach means we can resolve all types of offline and digital identity signals, which is valuable now and will become even more valuable as third-party cookies go away. Additionally, data hygiene is built right into our collaboration offering, helping to improve match rates.
The benefits of working with Experian’s rich identity data in a clean room environment are obvious so it is no surprise to see that 55% of data clean room users are using identity solutions in data clean rooms.
What are data clean rooms?
Data clean rooms are a tool typically used for data sharing, built on top of cloud providers such as AWS clean rooms. They protect data privacy while facilitating data collaboration among clients, marketers, businesses, and their partners. As the industry places greater emphasis on data security, clean rooms have emerged as secure environments that allow companies to:
- Enhance user privacy protection
- Minimize the impact of cookie deprecation
- Secure collaboration with data partners
The industry has quickly realized that, for what clean rooms offer by way of privacy and security, they lack resolution capabilities, typically yielding subpar match rates.
Benefits of Experian’s Collaboration in clean rooms offering
Built upon Experian’s rich offline and digital identity foundation, with support for various identifiers across platforms, Collaboration in clean rooms helps clients maximize the value of their data and meet the diverse needs of modern business.
Through Experian’s Collaboration in clean rooms offering, you can:
- Collaborate with partners for richer data insights
- Achieve higher match rates
- Improve audience building
- Produce more accurate and complete reports
- Ensure data privacy
Regardless of the identifier type you are looking to collaborate on, Experian has the identity data to support you and your partner. This leads to higher match rates and more resolved data for you to use to benefit your media initiatives.
Get started with Collaboration in clean rooms today
Get the most out of your first-party data with Collaboration in clean rooms, which is essential for businesses that want to compete in a fast-paced market and connect with consumers in today’s data-driven world. We understand the importance of data collaboration and make seamless, secure data sharing possible between partners.
Connect with us today to find out how Experian’s Collaboration in clean rooms offering ensures privacy while allowing you to extract valuable data insights for smarter data-driven advertising.
Latest posts

According to Experian Simmons, just over 5% of all U.S. adults and nearly a quarter of adult NCAA men’s tournament viewers (24%) qualify as likely online game streamers. How do you know which ones they are?
While WOM sites like Yelp.com continue to grow, their participants continue to be a very distinct subset of U.S. Internet users.
The audiences for the men’s and women’s NCAA Basketball Tournaments are decidedly different from one another. How do they stack up head-to-head?