
Ditch the cookie, not the data with the next evolution of contextual targeting
Today, we’re excited to announce Contextually-Indexed Audiences, a game-changer in contextual targeting. Experian’s new solution offers advertisers a powerful, privacy-safe solution that combines the precision of deterministic audience targeting with the flexibility of contextual targeting. Powered by real-time analysis from two million websites, access to 1,400 trusted audience segments, and easy activation through the top demand-side platform’s contextual marketplace or Audigent private marketplaces (PMPs), this solution offers advertisers a scalable way to reach their target consumers.
With this solution, advertisers can reach consumers on websites that over-index for visitors with the demographics, behaviors, or interests, they are looking to target. For example, an automotive brand can select Experian’s “Contextually-indexed in-market for a luxury electric car” audience segment and reach consumers when they are browsing websites that often attract that exact segment. Best of all, this is done in a privacy-safe way since it’s not reliant on cookies, mobile ad IDs (MAIDs) or other user identifiers.
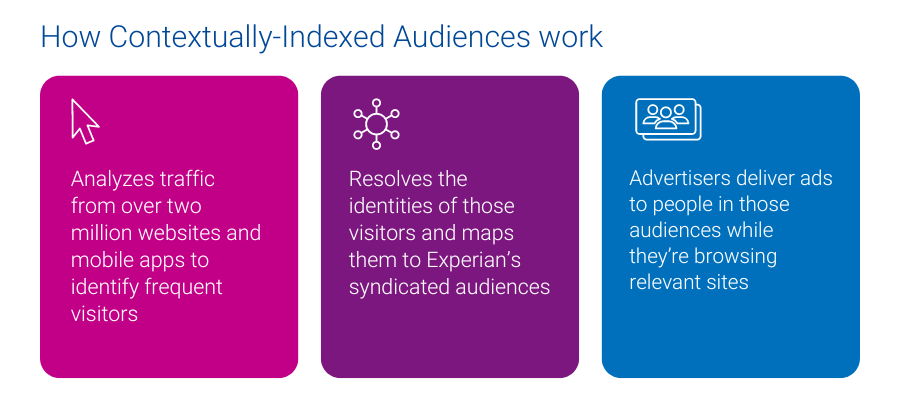
How Contextually-Indexed Audiences work
Contextually-Indexed Audiences harness advanced machine learning technology to move beyond traditional keyword-based strategies. The solution works in three steps:
- First, it analyzes traffic from over two million websites and mobile apps to identify the types of frequent visitors to those platforms.
- Next, using Experian’s Digital Graph, it resolves the identities of those visitors and maps them to more than 1,400 of Experian’s Syndicated Audiences, determining which audiences are most overrepresented on each site.
- Finally, the relevant audiences are assigned to those sites, allowing advertisers to deliver ads to people in those audiences while they are actively browsing the websites — without relying on user identifiers.

Customer success story
A leading auto manufacturer was among the first clients to activate this new solution while we were in beta. The goal was to identify new contextual targeting solutions that focus on privacy while maintaining scale and performance. The client identified two key target audiences: first-time vehicle buyers and experienced buyers. The initial campaigns using this new solution were highly successful. Even as the campaign scaled to twice the original volume, it continued to deliver three times the targeted click-through rate (CTR) goal.
“Partnering with industry leaders like Experian, we’re pushing the boundaries of contextual targeting with innovative data strategies that offer buyers greater flexibility and improved performance. These advanced contextual solutions are exciting as they not only drive results but also have the same privacy safeguards as traditional contextual targeting.”
Matt Griffith, CTO & Co-Founder, Audigent
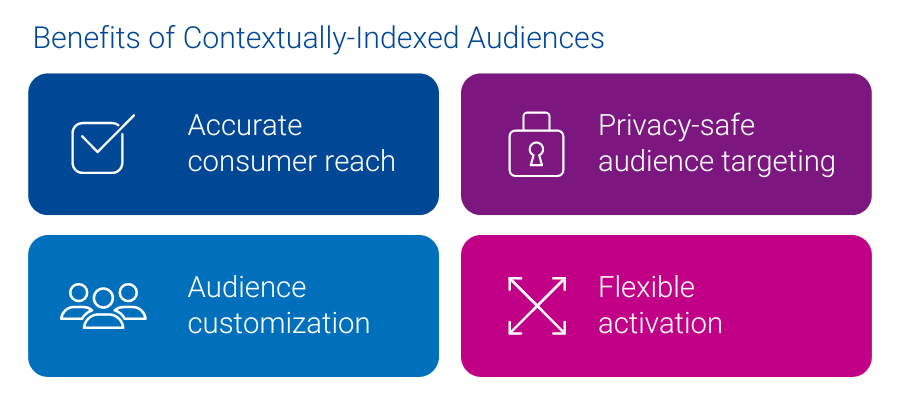
Benefits of Contextually-Indexed Audiences
- Accurate consumer reach: Real-time integrations with over two million websites and apps coupled with machine-learning indexing technology ensure audience segments are constantly refreshed, which means advertisers reach consumers based on their latest habits.
- Privacy-safe audience targeting: These audiences are not reliant on cookies or any other user identifiers for targeting.
- Audience customization: Create the right audience segment for your campaign by using a combination of over 1,400 audiences across 12 data categories like demographics, politics, health, travel, finance, and TV.
- Flexible activation: Activate these audiences instantly in the top demand-side platform’s contextual marketplace or utilize our partnership with Audigent to create a custom private marketplace (PMP), where they can be activated across any media buying platform. When using a PMP, advertisers benefit from additional performance optimization capabilities.

Experian’s Contextually-Indexed Audiences offer advertisers a powerful solution that combines the precision of audience targeting with the flexibility of contextual targeting. With real-time analysis of over two million sites and access to 1,400 trusted audience segments, advertisers can reach consumers based on their exact behaviors and interests. This is done in a privacy-safe, yet scalable way since it’s not reliant on cookies or other user identifiers. Whether activating instantly through the top demand-side platform or customizing through Audigent PMPs, this is the future of audience targeting.
Ditch the cookie, not the data, and elevate your strategy today.
Latest posts

Marketers traditionally use income, net worth and income-producing assets to enhance their consumer targeting efforts. However, these data elements provide insight only into spending capacity, not how much is actually being spent. Consumers who appear nearly identical in terms of demographics may, in fact, vary widely when it comes to discretionary spending. Some are savers, some are spenders and some have more financial obligations than others. Experian Marketing Services offers data-driven marketers a way to cut straight to the chase when targeting consumers by out-of-pocket expenditures with the Discretionary Spend Estimate. This estimate is available for direct marketing applications to enhance marketers’ targeting efforts as well as an add-on to the Simmons National Consumer Study (NCS) providing marketers with the ability to evaluate discretionary spending against any of the 60,000 consumer variables measured in the study offered by Experian Simmons. In the new 2011 Discretionary Spend Report, Experian Simmons presents a vivid profile of American households by the amount spent annually on nonessential goods and services, including things like entertainment, dining out, personal care, etc. For starters, we report that an estimated 28% of Americans’ annual household spending is on discretionary goods and services. Specifically: The typical U.S. household today shells out $12,800 annually on discretionary expenditures Over half of households spend less than $10,000 on discretionary purchases each year, including just over a third that spend less than $7,000 annually Only 5.8% of American households spend $30,000 or more per year on nonessential goods and services, including 2.2% that spend $40,000 or more annually Distribution of U.S. households, by annual discretionary spending Furthermore, we estimate that, in aggregate, Americans spend $1.47 trillion annually on discretionary goods and services. Despite the fact that households spending less than $7,000 on nonessentials comprise over a third of all households, this segment of the population accounts for just 10.8% of total annual discretionary spending in the United States. Combined, households spending less than $7,000 annually contribute $158.3 billion in discretionary spending to the economy at large The top 2.2% of spenders (those households that spend $40,000 a year or more on nonessentials) account for fully 11.2% of the nation's total annual discretionary spending Households spending between $20,000 and $29,999 annually on nonessential purchases account for the largest single share of the nation’s spending: $305.1 billion Proportion of nation’s total annual discretionary spending, by spend segment Total annual discretionary spend contribution, by spend segment Understanding the pocketbooks of America’s spenders is one thing, but understanding what’s going on in their heads is another. Luckily, Experian Simmons delivers the mindset of the American consumers; below is a look at select attitudes that uncover real differences in personalities and lifestyles of Americans depending on their annual discretionary spending. Highlights include: 46% of high spenders say they often drink alcoholic beverages making them 77% more likely than the average U.S. adult to do so High spenders like to drive faster than normal while low spenders like to drive alone for a sense of freedom Low spenders say that “money is the best measure of success,” but they also say they “don’t want responsibility” High spenders say they are often chosen to be the spokesperson of a group Check back here for more posts on America’s discretionary spending habits and behaviors or download the full 2011 Discretionary Spend Report now.

The BRICs markets (Brazil, Russia, India and China) are becoming ever larger forces in the world economy. For some time their growth rates have been faster than those experienced in western economies, and they have borne the recent economic crisis with greater resilience. In many ways it's wrong to refer to the BRICs as "developing" markets — by some measures they can be considered just as developed as the "developed" markets. Manufacturers and service providers have to be interested in the BRICs. Their sheer size, allied with these growth rates, means they offer huge potential. Growth rates in the BRICs for a range of items have been rapid. Data from Global TGI, an international network of market and media research companies spanning over 50 countries and six continents, shows this very clearly. In this post we look at three examples in diverse sectors. These charts show the trend over the last decade in the ownership in the BRICs markets of cars, microwave ovens and bank cards. They are based on the total measured urban adult Global TGI population in all cases. We can also compare this with the trend in the U.S. sourcing data from Experian Simmons. Boom in car ownership There has been dramatic increase in the ownership of cars over the last decade in Russia (80%), India (90%) and China (200% growth). These rates of growth are a clear sign of how economic development spreads wealth and makes items affordable to increasing numbers of consumers. The exception to this picture is Brazil, where car ownership was considerably higher than in the other BRICs at the opening of the new century, and growth has been more serene. By comparison to the BRICs we see from Experian Simmons that in the U.S. (as well as Great Britain) there has been virtually no percentage growth — new purchases are largely replacement purchases. The microwave oven market heats up Purchasing a microwave oven for your home is by no means as expensive an undertaking as purchasing a car, but it requires the availability of sufficient disposable income. In this category we see from Global TGI significant growth in all the BRICs over the last decade — from a 50% increase in Brazil to over 700% in Russia. The growth story in Russia is typical of many categories in fast-growing markets: ten years ago a microwave oven was still an expensive item for most households given their purchasing capacity, and ownership was largely the preserve of the well-off. Subsequently however, it has become affordable as well as being regarded as necessary by most people, and penetration has grown dramatically. As with automobiles, growth of microwave ovens in the U.S. has remained flat with fully 89% of all American homes already owning a microwave. Financial sophistication The growth in ownership of credit and debit cards arises from people's need to manage money, and greater levels of financial sophistication. Clearly it also represents a huge opportunity for financial institutions. It has been striking across all the BRICS — and there is still potential for more, perhaps in India most of all. Again we see from very little growth over the same period in the U.S. and Britain, which were already saturated. Today, 83% of Americans have a debit or credit card, as do 90% of Brits. Consumer growth in the BRICs will continue Across many other categories the same picture can be seen, of rapid growth yet still much further potential. We can anticipate growth in the BRICs and other developing markets continuing to outpace growth in western markets across the full range of consumption categories. With economic growth happening at different speeds this trend seems likely to last for a long time. Furthermore, it's not only that they are growing faster. In population terms, the BRICs together represent 42% of the people of the world. Their large populations mean that they will increasingly dominate world markets in absolute numbers too. When this rapid macro-economic development is considered along with the sheer size of their consumer markets and the speed of their growth evident from these Global TGI figures, it is very clear why many manufacturers are focusing attention very closely on the BRICs. Learn more about how Experian Simmons and Global TGI can provide you with consumer insights across the globe with comparisons to the United States.

In the digital age, print coupons are dinosaurs, right? Not one bit. In fact, according to Experian Simmons, users of printed coupons — those obtained from newspapers, magazines, mail, etc.—outnumber users of digital coupons by a margin of almost 3-to-1. As of February 14, 2011 (the latest date for which data was available at the time of this post), 68% of all U.S. adults said their household uses print coupons, a number that has remained relatively unchanged during the past five years. 68% of all U.S. adults said their household uses print coupons, a number that has remained relatively unchanged during the past five years. By comparison, Experian Simmons also reports that 22% of all U.S. adults say their household uses digital coupons obtained from email or the Internet. That figure may be lower than the usage reported for any measured type of print coupon, including those handed out in or near stores, but adoption of digital coupons is growing: in 2005, just 12% of American adults used digital coupons. Smartphones adoption will continue to propel digital coupon use to historic highs in the months and years to come. According to an analysis featured in the 2010 U.S. Household Consumer Trend and Benchmark Report, 34% of U.S. iPhone owners use digital coupons compared with just 21% of non-iPhone owners. Interestingly, use of print coupons among iPhone owners doesn’t suffer a bit. In fact, as of February 14, 2011, 68% of iPhone owners reported that their household used print coupons versus 64% of non-iPhone owners, making it obvious that merchants should give their customers an option of using both print and digital coupons. For further consumer insights, download the 2010 U.S. Household Consumer Trend and Benchmark Report, which includes trends on economic outlook by household income, charitable contributions and planned automobile purchases.