
Ditch the cookie, not the data with the next evolution of contextual targeting
Today, we’re excited to announce Contextually-Indexed Audiences, a game-changer in contextual targeting. Experian’s new solution offers advertisers a powerful, privacy-safe solution that combines the precision of deterministic audience targeting with the flexibility of contextual targeting. Powered by real-time analysis from two million websites, access to 1,400 trusted audience segments, and easy activation through the top demand-side platform’s contextual marketplace or Audigent private marketplaces (PMPs), this solution offers advertisers a scalable way to reach their target consumers.
With this solution, advertisers can reach consumers on websites that over-index for visitors with the demographics, behaviors, or interests, they are looking to target. For example, an automotive brand can select Experian’s “Contextually-indexed in-market for a luxury electric car” audience segment and reach consumers when they are browsing websites that often attract that exact segment. Best of all, this is done in a privacy-safe way since it’s not reliant on cookies, mobile ad IDs (MAIDs) or other user identifiers.
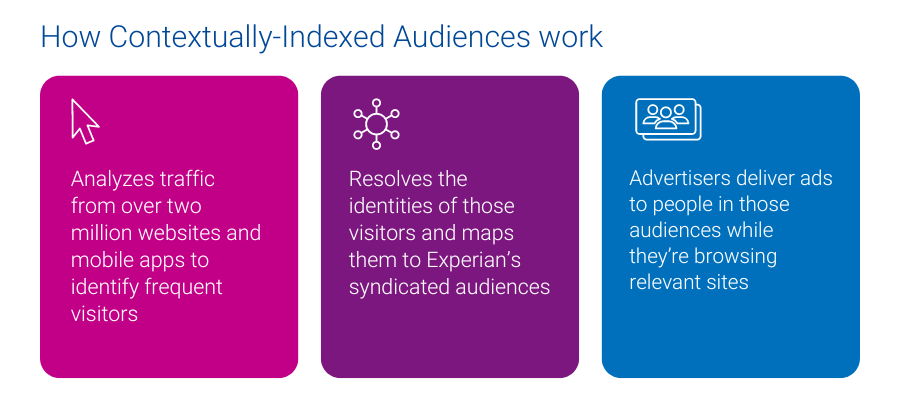
How Contextually-Indexed Audiences work
Contextually-Indexed Audiences harness advanced machine learning technology to move beyond traditional keyword-based strategies. The solution works in three steps:
- First, it analyzes traffic from over two million websites and mobile apps to identify the types of frequent visitors to those platforms.
- Next, using Experian’s Digital Graph, it resolves the identities of those visitors and maps them to more than 1,400 of Experian’s Syndicated Audiences, determining which audiences are most overrepresented on each site.
- Finally, the relevant audiences are assigned to those sites, allowing advertisers to deliver ads to people in those audiences while they are actively browsing the websites — without relying on user identifiers.

Customer success story
A leading auto manufacturer was among the first clients to activate this new solution while we were in beta. The goal was to identify new contextual targeting solutions that focus on privacy while maintaining scale and performance. The client identified two key target audiences: first-time vehicle buyers and experienced buyers. The initial campaigns using this new solution were highly successful. Even as the campaign scaled to twice the original volume, it continued to deliver three times the targeted click-through rate (CTR) goal.
“Partnering with industry leaders like Experian, we’re pushing the boundaries of contextual targeting with innovative data strategies that offer buyers greater flexibility and improved performance. These advanced contextual solutions are exciting as they not only drive results but also have the same privacy safeguards as traditional contextual targeting.”
Matt Griffith, CTO & Co-Founder, Audigent
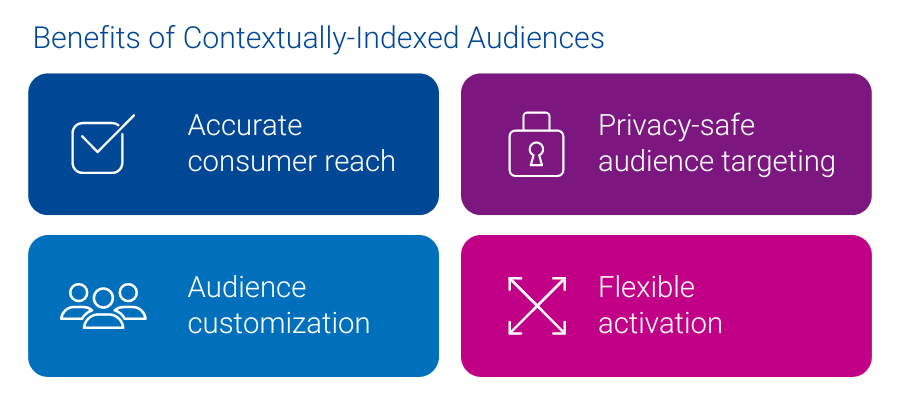
Benefits of Contextually-Indexed Audiences
- Accurate consumer reach: Real-time integrations with over two million websites and apps coupled with machine-learning indexing technology ensure audience segments are constantly refreshed, which means advertisers reach consumers based on their latest habits.
- Privacy-safe audience targeting: These audiences are not reliant on cookies or any other user identifiers for targeting.
- Audience customization: Create the right audience segment for your campaign by using a combination of over 1,400 audiences across 12 data categories like demographics, politics, health, travel, finance, and TV.
- Flexible activation: Activate these audiences instantly in the top demand-side platform’s contextual marketplace or utilize our partnership with Audigent to create a custom private marketplace (PMP), where they can be activated across any media buying platform. When using a PMP, advertisers benefit from additional performance optimization capabilities.

Experian’s Contextually-Indexed Audiences offer advertisers a powerful solution that combines the precision of audience targeting with the flexibility of contextual targeting. With real-time analysis of over two million sites and access to 1,400 trusted audience segments, advertisers can reach consumers based on their exact behaviors and interests. This is done in a privacy-safe, yet scalable way since it’s not reliant on cookies or other user identifiers. Whether activating instantly through the top demand-side platform or customizing through Audigent PMPs, this is the future of audience targeting.
Ditch the cookie, not the data, and elevate your strategy today.
Latest posts

2013 has been a milestone year for those lobbying on behalf of expanded rights of Lesbian, Gay, Bisexual and Transgendered (LGBT) Americans. With 12 states and the District of Columbia now formally recognizing same sex marriages and two highly anticipated rulings from the U.S. Supreme Court expected shortly, the momentum is currently on the side of those seeking greater recognition and support of LGBT-related issues. The speed with which public attitudes have shifted towards greater acceptance of LGBT individuals and their causes has left many marketers scrambling to devise plans that are not only inclusive of LGBT consumers, but in many instances, designed to overtly and publically court this influential and growing consumer segment. The 2013 LGBT consumer report out from Experian Marketing Services delivers insights marketers need to better understand the market that is on everyone’s radar. In this first of a series of blog posts, we’ll highlight key data from the report. Readers can download the full report at any time here. Living out Loud In 2006, when Experian Marketing Services first began measuring sexual orientation among respondents to our Simmons® National Consumer Study, we found that 3.4% of all non-Hispanic adults self-identified as either lesbian, gay, bisexual or transgendered (LGBT), a figure consistent with what leading LGBT researchers predicted at the time. However today, 4.3% of the non-Hispanic adult population self-identifies as LGBT, a figure that has risen slowly but steadily year-after-year. Younger adults have consistently been more likely to identify as LGBT, and in fact today, 5.8 percent of 18 to 34 year olds say they are lesbian, gay, bisexual or transgendered. As a result, the adult LGBT population predictably skews towards the younger age cohorts. Specifically, 36% of LGBT adults today are aged 18 to 34 versus 26% of the heterosexual population in that age range. Likewise, while 20% of heterosexual adults are age 65 and older, just 16% of LGBT adults are in this age range, though our data shows that the share of adults age 65 and older identifying as LGBT has also risen. Home and Family As a growing number of U.S. states pass laws recognizing same-sex marriages and civil unions, we see an increasing percentage of gay and lesbian Americans reporting that they are married. In 2007, for example, when only Massachusetts allowed same-sex marriage, 8% of gay men and 14% of lesbian women said they were married. Today, 17% of gay men and 16% of lesbian women are married. Marriage rates among lesbian and gay adults still lag well behind those of heterosexuals, but the gap is closing from both sides. In fact, while marriage rates are rising among lesbians and gays, they’re falling among heterosexuals. Today, 58% of heterosexual men and 53% of heterosexual women are married, compared to 60% of heterosexual men and 55% of heterosexual women who were married in 2007. The Pink Dollar Income levels are important to consider when targeting consumers, but more important is determining the amount of money left over for non-essentials after the other bills are paid. Despite earning nearly identical salaries, gay men have lower annual household discretionary expenditures than heterosexual men. Likewise, lesbian households have fewer dollars than those of heterosexual women to spend on non-essentials. This is mostly likely due to the fact that both lesbian and gay adults tend to reside in larger cities where the cost of living can be considerably higher than average. Interestingly, when household size is brought into the equation, we see that gay males actually have higher discretionary spending per capita than heterosexual men. In fact, gay men live in households that devote $6,794 per capita annually to non-essentials, which is $753 more than what heterosexual men spend. Forthcoming posts from this series will include insights into the automotive and food vertical markets; the mobile habits of LGBT consumers; and an examination of online visitors to LGBT content sites. Don’t want to wait? Download the full report now. Also, learn more about the Simmons LGBT Consumer Study, the only syndicated, national probability sample survey that measures the lifestyles, attitudes, media habits and brand preferences of the LGBT population giving marketers actionable insights into this powerful consumer segment that can be directly compared with those of heterosexuals.

The importance of affiliate marketing as a marketing channel is evident; it ranks as one of the most effective marketing channels for retailers, along with paid search and e-mail. While effective affiliate marketing relies on two groups, the publishers (affiliates) who display advertisements online and the advertisers (merchants) who aim to increase sales for their online shop, incorporating insights from Experian Marketing Services’ Hitwise can strengthen affiliate programs. I recently worked with Rakuten LinkShare on a webinar which highlights how their affiliate marketing services partnered with Hitwise create a proven package for success by providing valuable and actionable insights to affiliate marketers in understanding and targeting key consumer segments. Identify sites sending traffic to your category For our case study, we examined a custom category of Rakuten LinkShare department store clients and compared them with a category of department store non-clients. Using Hitwise, we examined which publisher sites sent traffic to each of the categories in order to identify the best affiliates to partner with. Among the top 20 publisher websites, a number of fashion and style content websites were sources of traffic to LinkShare Department store clients. Fashion and trend focused affiliate sites, namely ShopStyle and Polyvore, pointed to clear fashion editorial interest amongst those who visited LinkShare department store clients. Consider search terms used to capture consumer interest and intent Next, we looked at generic terms that sent traffic to affiliate site ShopStyle. Terms included searches for products sold in department stores such as variations of “heels” and “dresses”. The data indicates that ShopStyle is a good candidate to partner with because it attracted visits from those who are interested in fashion, looking for a deal, and who are likely in-market for specific products. Monitor effectiveness of affiliate programs and make timely decisions Hitwise can also be used by marketers to evaluate the effectiveness of their affiliate partnerships. For this example, we were able to show that Rakuten LinkShare affiliates sent a larger share of traffic to department store clients versus non-clients, pointing to a clear benefit from affiliate partnerships. As affiliate marketing is an increasingly critical channel for marketers, the importance of selecting the best and most relevant publishers is clear. When used in conjunction with affiliate marketing programs, Hitwise enables marketers to understand competitors’ online distribution and sources of traffic, select the best affiliates to partner with, and quantify the return on investment from partnerships.

New data from Experian Marketing Services’ Simmons® ConnectSM mobile and digital panel sheds light on the way smartphone users spend time using their phone, with the average adult clocking 58 minutes daily on their device. On average, smartphone owners devote 26% of the time they spend on their phone talking and another 20% texting. Social networking eats up 16% of smartphone time while browsing the mobile web accounts for 14% of time spent. Emailing and playing games account for roughly 9% and 8% of daily smartphone time, respectively, while use of the phone’s camera and GPS each take up another 2% of our smartphone day. *Activities include use of a smartphone’s native features dedicated to each activity as well as downloaded apps whose primary function falls under the given activity. For instance, “watch video” includes the act of watching video on the smartphone’s native video player as well as use of video apps such as YouTube, Netflix, etc. iPhone versus Android users Smartphone users may constantly debate which operating system is supreme, but we see clear differences between the ways consumers use their phone depending on the operating system that runs it. For starters, iPhone users spend an hour and fifteen minutes using their phones per day, a full 26 minutes more than the typical Android phone owner. Additionally, iPhone and Android smartphone owners use their phones in markedly different ways. For instance, 28% of the time that Android users spend using their phones is dedicated to talking, whereas iPhone users spend only 22% of their smartphone time talking on the device. Android owners also devote a greater share of time visiting websites on their phone than iPhone owners. On the other hand, iPhone owners spend a disproportionately greater share of smartphone time than Android owners texting, emailing, using the camera and social networking. Note on time spent It may surprise some to read that an activity like watching video accounts for such a small share (less than 1%) of the typical adult’s daily smartphone use. However, for the charts above to sum to a single daily total it was necessary to calculate individual activity contribution using a base of all smartphone owners, including those who don’t spend any time engaging in a given activity during a typical day. The chart below provides additional insights into the time spent engaging in the major smartphone activities examining only those individuals who engaged in each activity during a 24-hour period. I’ve also added into the chart a reach and frequency metric to indicate the popularity of each activity and the number of times per day that individuals engage in them. In the chart, the activities with the largest bubbles are those in which the greatest share of smartphone owners engage during a typical day and include the usual suspects: talking (79%), texting (76%), visiting websites (62%), emailing (61%) and social networking (52%). Activities with the fewest daily participants are: watching video, which 2.3% of smartphone owners do during a typical day, and reading, which just 0.5% of smartphone owners do daily. Given that nearly 98% of smartphone users don’t watch videos on their phone during a typical day, it’s easier to understand why video comprises such a low share of the average adult’s daily smartphone use. However, the chart above reveals that those who do watch video on their phone spend, on average, 5 minutes a day watching videos spread out over 4.2 different viewing sessions. For more information on consumers’ usage of smartphones, digital tablets, computers and other traditional and digital media platforms, check out Simmons Connect.