The AdTech industry is undergoing rapid changes as it adjusts to the impacts of data deprecation and ever-changing privacy regulations. At the same time, there are fears of a potential economic downturn. How should you handle marketing in a recession? What should your marketing mix look like? In this blog post, we’ll cover how to navigate this uncertainty and three essential ingredients for your marketing mix.
First, we’ll look at the complexity and uncertainty facing marketers.
Turbulence with Twitter
After Elon Musk’s Twitter takeover in October 2022, half of Twitter’s top 100 advertisers left the platform and started to seek out alternatives.
The retail media boom
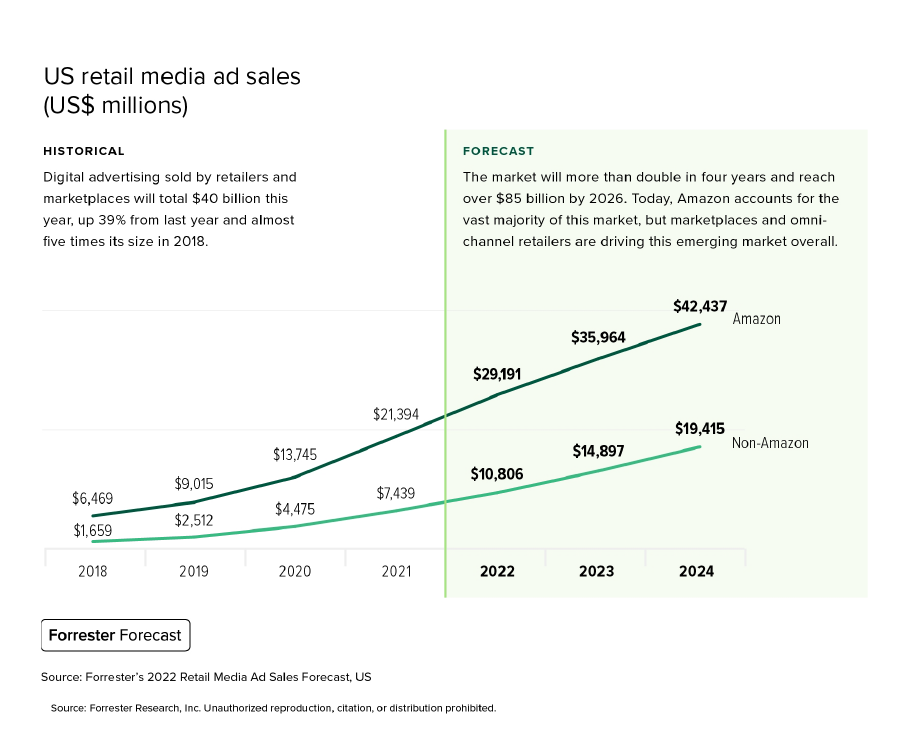
In the next four years, Forrester Research projects that U.S. retail media ad sales will double to reach 85 billion by 2026.1
Most of this growth is catalyzed by CPG and consumer electronic brands that have a scarcity of zero- and first-party data; they need more media closer to the point of purchase, especially as CFOs are scrutinizing budgets.
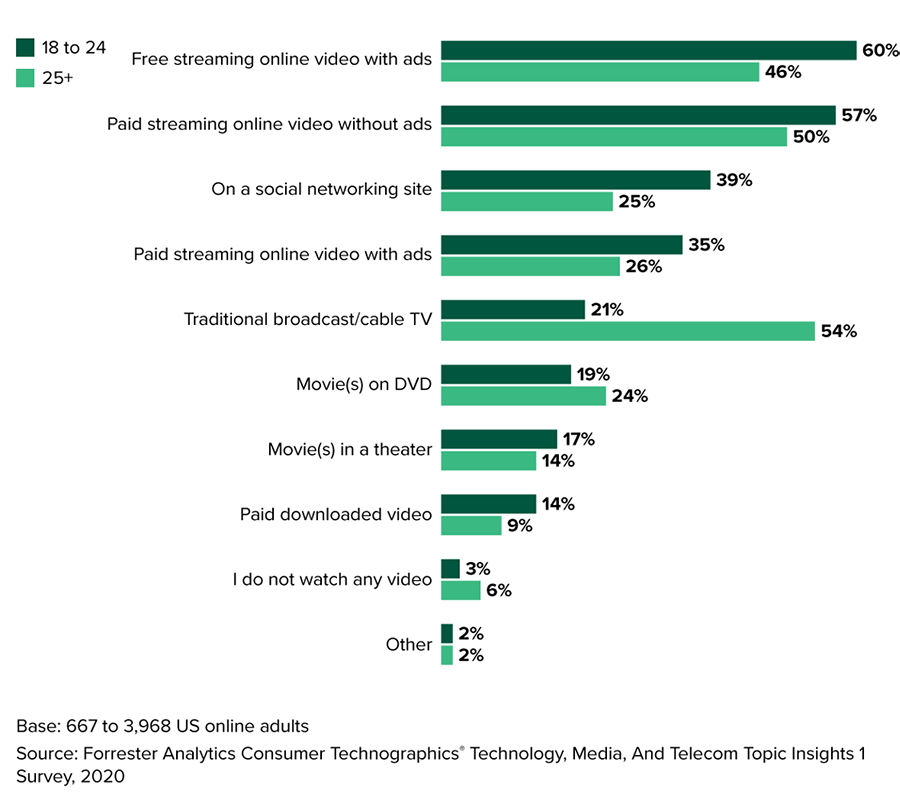
Consumption continues to fragment
It’s becoming harder than ever to reach the right person, at the right time, predict their intent, and get a 360-degree view of your customer.2
Data deprecation is top of mind
According to Forrester Research, updating their data strategy to address data deprecation is the number one priority for marketers. Addressing data deprecation is also a priority for consumers, who increasingly feel that audience targeting is more intrusive than beneficial.3
Data deprecation affects identity solutions
Third-party data and mobile ad IDs (MAIDs) are the connective tissue for identity solutions. As we see those signals go away, there are fewer linkages to resolve identity and it’s leading to a rise in fragmented, duplicated, and shallow identity.
Recession fears
In addition to everything happening in AdTech, there are also fears of a possible recession. According to Forrester, 40% of Gen Z and 41% of Millennials believe fears of an upcoming recession are greatly exaggerated. On the other hand, only 24% of Gen X and 12% of Baby Boomers agree.4
Navigate uncertainty and marketing in a recession
With the current macroeconomic conditions, data deprecation, and fragmented consumption in mind, what should your strategy look like for marketing in a recession? Forrester recommends three strategies:
- People-led planning
- Test creative
- Optimize for marginal costs
People-led planning
Planning doesn’t have to be fragmented. Map offline and online media exposures to consumer decision journeys. Strategies like lifetime value (LTV) driven audience segmentation to correlate awareness at top of the funnel layered with demand generation exposures harvested later in the funnel. To do this, it’s crucial to work with providers that give you visibility into the audience buyer’s journey to awareness, intent, consideration, and purchase, all the way through to loyalty.5
Test creative
Make your creative work harder for you. Apply the same rigor with your creative that you applied to segmentation. Utilize multivariate testing to identify creative that is winning or losing. When you understand how each variable performs, you can scale the variables with creative optimization to have a material impact on performance.
Optimize for marginal costs
Optimize for marginal costs of acquisition, not just the average. Adjust for incrementality – what is the cost to acquire one more customer, rather than the average cost of acquisition.
Find the right marketing mix in a recession
With these changes in mind, how can you find the right marketing mix in a recession? We can show you the way.
You can create the right marketing mix with three key ingredients:
- Audiences
- Identity
- Activation
Let’s explore each ingredient to start you down the path toward marketing campaign success.
Audiences: Know your customer
The first ingredient to add to your marketing mix in a recession is your audience. Knowing your customer is key to targeting the right audiences successfully. Data-driven targeting can help you find your best audiences based on demographics, modeled lifestyles, and behaviors to improve marketing campaign performance.
Not sure where to start when it comes to developing your target audience strategy? We can help. We track digital usage of our data used by advertisers and identified the top four digital audiences that advertisers purchased over the last four years.
Four digital audiences to consider
Marketing strategies are only as strong as the data foundation they’re built on. The top four digital audiences that advertisers are purchasing from Experian include:
- Demographics
- Behavioral
- Modeled Lifestyles
- Custom Audiences
Demographics
Examples include age, gender, relationship status, living situation, life experience, and employment.
Behavioral
This audience allows marketers to identify households that are more likely to engage in certain activities or belong to certain groups.
Modeled Lifestyles
Experian’s Mosaic® USA segmentation. This is a household-based consumer lifestyle segmentation system that classifies all U.S. households and neighborhoods into 71 unique types and 19 overarching groups, providing a 360-degree view of consumers’ choices, preferences, and habits.
Custom Audiences
This is an audience blended from multiple sources or derived from first-party look-alike modeling.
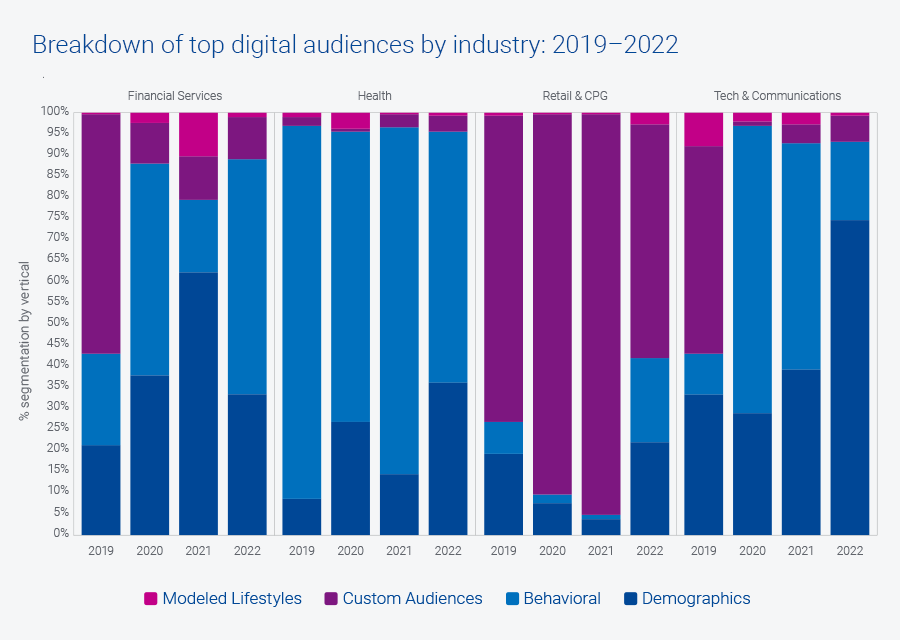
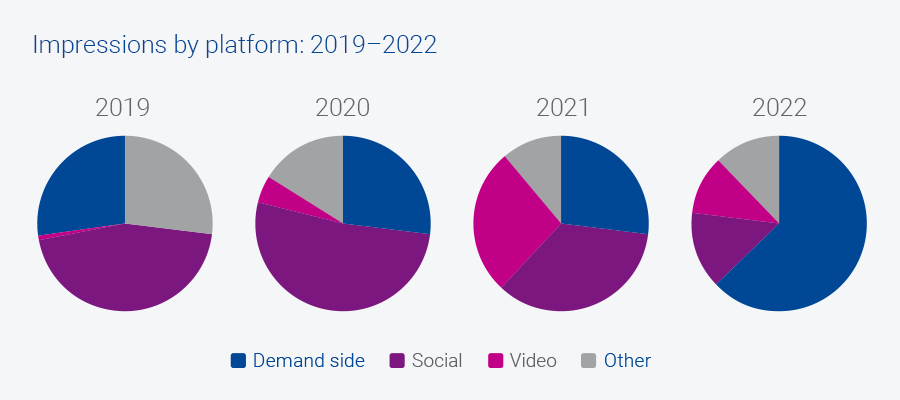
Changes in digital audience strategies
Over the last four years, Modeled Lifestyles and Custom Audience purchases represented the smallest share of digital activation, while Behavioral and Demographic segments were more popular with advertisers.
When the U.S. rolled out the COVID-19 vaccine, consumers became more active. People were shopping in stores, returning to the gym, and taking trips that they had postponed during the height of the pandemic. Marketers turned to higher compositions of Demographic and Modeled Lifestyles to reach these audiences between April and December of 2021.
Sustained growth in Demographic audience activation could suggest a move back to tried and true audience strategies as signals continue to decline and amid evolving regulation. With economic uncertainty, marketers return to what they know. Traditional targeting methods like Demographics and Modeled Lifestyles are the baseline of many marketing strategies and we predict that we will continue to see marketers activating against these data sets.
Download our 2023 digital audience trends and predictions report to discover our full insights on how digital activation has changed and where we’re headed.
Identity: Understand the customer journey
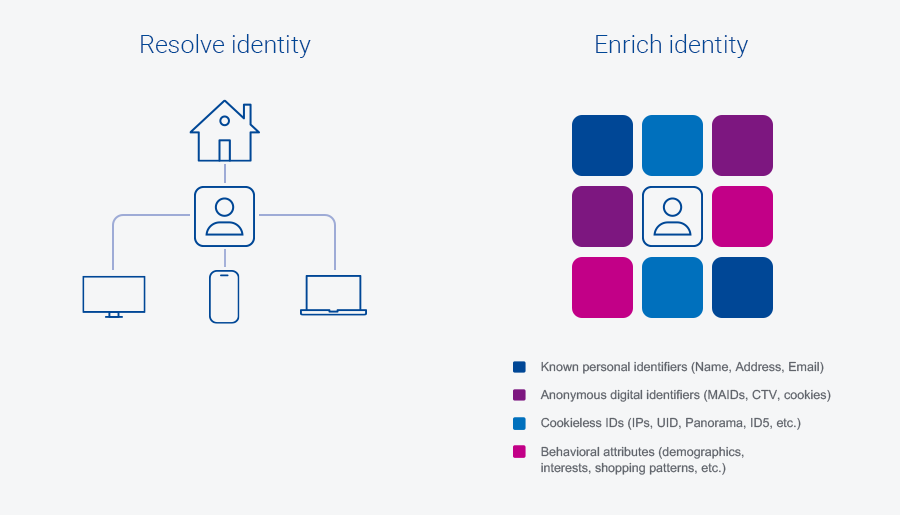
Identity resolution is the next ingredient that you should add to your marketing mix in a recession. It should be a foundational element of every marketer’s strategy.
What is identity resolution? In the simplest terms, identity resolution is the process of matching different devices, IDs, and touchpoints back to a single person. Identity resolution expands marketers’ addressability and reach of their target audience and helps inform and measure accurate customer journeys.
Identity resolution challenges
Identity resolution faces two main challenges:
- Making the data actionable. Humans are complex. We have behaviors that change based on our current social groups and life events, we use dozens of internet-connected devices in a single day, and we exhibit distinct behaviors that happen online and in the physical world. This means marketers have mounds of data being collected from different channels based on that dynamic behavior of people, making it feel impossible to organize the data in a way that makes it feel actionable, know how it ties back to real humans, and ensure they’re doing it in a responsible and compliant way.
- Signal loss. Marketers continue to lose important signals that they’ve previously been able to rely on to inform their next move. Signals are being lost as our industry places more privacy regulations and restrictions on what can be tracked and as consumers themselves change behaviors to protect their privacy.
As consumer behaviors continue to change and signals disappear, identity resolution gets exponentially harder.
Expand addressability and reach with identity resolution
Data deprecation adversely affects identity solutions, but identity resolution should be a key ingredient in your marketing mix. Identity resolution ensures that consumers experience more relevant products, offers, and messaging – allowing you to reap the ROI benefits of hitting consumers at the perfect point in their journey.
Finding an identity resolution partner
When selecting an identity resolution partner, you should understand the data and processes that are implemented behind the scenes. It’s important to know:
- What makes up their consumer database?
- How fresh is their data?
- What identifiers can they match?
- How do they protect consumer privacy?
At Experian, we’re rooted in deterministic offline data which creates a stable foundation. We then layer in digital and behavioral touchpoints. We have decades of experience managing consumer data safely. We have insights on 250 million individuals, three billion devices, and one trillion device signals. Our databases evolve as quickly as the human behavior powering them does.
Our approach to identity resolution is open and agnostic. This means we can collect and ingest nearly all available offline and online identifiers. We can do this in all types of environments, including connected TV (CTV), mobile, and cookieless. We have two types of identity resolution:
- Offline
- Digital
This ensures we control how known and anonymous data points are connected for consumer privacy purposes.
Identity resolution in action
Our depth of data gives our clients access to see the whole human and gain the context around singular data points.
Let’s walk through an example of our identity resolution capabilities.
Challenge
Our TV media platform client needed to measure the effectiveness of an ad campaign they were running on behalf of a leading consumer electronics brand. The TV platform wanted to be able to accurately report on which consumers made a purchase after seeing the brand’s TV commercial on their platforms.
Solution
Using our digital identity resolution services, our client could capture online purchases made on the brand’s website and link them back to a consumer profile. In addition to online transactions, our client used our offline resolution services to resolve email addresses of consumers that purchased offline, using warranty registration details.
With online and offline purchase data now resolved back to an individual ID, we also performed identity resolution on viewers in their TV subscriber files that had also been exposed to the TV commercial. This allowed us to identify subscribers that had both seen the ad and purchased a product.
We provided our client with a packaged report that they could white-label and pass along to the brand.
Results
By providing this attribution reporting to the brand, the TV platform could validate the ROI spent on their platform. The brand was extremely satisfied with the results, and they transitioned the one-off TV commercial into an ongoing campaign and purchased quarterly measurement. This led to solid recurring revenue for the TV platform.
Activation: Experiment and measure the impact
The third and final ingredient to finding the right marketing mix in a recession is activation. Experimentation is the best way to determine which channels work best for your business and provide the most ROI.
Demand-side platforms (DSP), video platforms, and sell-side targeting are three important activation channels that you should consider experimenting with.
Demand-side platforms
We continue to see increased demand for environments where alternative identifiers are being transacted (like DSPs and video). Social channels are decreasing; this can be attributed to changes in privacy, security, and concerns around brand safety.
Amazon’s DSP is catching up with Google and Meta to become a top ad platform.
Video platforms
Digital video and other video channels like over-the-top (OTT) and CTV will continue to grow. Digital video will capture the most ad spend in 2023 (22.4% in 2023 vs 19.3% in 2022). Because of this, advertisers are placing bigger bets on the combination of addressable and CTV.
Sell-side targeting
Data sharing relationships will become strongest on the sell-side as we move toward consented first-party data. Ad dollars are shifting to channels that use the sell-side approach, like retail media and CTV.
Sell-side targeting enables brands to access large amounts of inventory across publishers and retailers. By getting closer to the ad inventory, advertisers can future-proof their strategies by having more access to better data signals. Direct relationships like these will be necessary as privacy regulations increase and signal loss continues.
We can help you find the right marketing mix in a recession
Now is the time to be opportunistic. Gaining share of voice during a downturn is cost-effective. Proactive marketing builds pent-up demand.
Delivering the right message in the right place at the right time means truly knowing your prospects and customers as individuals. At Experian, we bring you the highest-resolution picture of people, so you and your customers can connect with confidence.
You can turn prospects into customers with the right audience. By understanding your customers better, you can find more like them. Together we can power better results.
Find the right marketing mix
Check out our webinar, “Find the right marketing mix with rising consumer expectations.” Guest speaker, Nikhil Lai, Senior Analyst from Forrester Research, joined Experian experts Erin Haselkorn and Eden Wilbur. Watch the recording to learn:
- New data on the complexity and uncertainty facing marketers
- Consumer trends for 2023
- Recommendations on finding the right channel mix and the right consumers
Sources
- 2022 Retail Media Ad Sales Forecast, US. Forrester Research, Inc. 2022.
- Forrester Analytics Consumer Technographics® Technology, Media, and Telecom Topic Insights 1 Survey. Forrester Research, Inc. 2020.
- CMO Pulse Survey. Forrester Research, Inc. July 2021.
- Forrester’s Consumer Energy And Retail Online Survey. Forrester Research, Inc.
- People-Led Planning Solves Customer Problems to Drive Growth. Forrester Research, Inc. August 2, 2021.
Latest posts

Cell phone ownership among American adults is 91% and 98% among young adults. Verizon and AT&T will almost certainly continue to dominate the market, especially given the fact that cell phone subscribers are increasingly staying with their provider for an extended period of time.
The popularity of flash sale websites with limited time & inventory offerings have grown exponentially over the two years. Online shoppers’ love for the thrill of snagging designer clothing, home décor, travel and even wine have caused visits to the category to increase 368% in July 2011 as compared to the same month two years ago and 109% one year ago. So far in 2011, Nordstrom acquired HauteLook, Amazon entered the fray with MyHabit and recently Saks Fifth Avenue announced the launch of a dedicated flash sale website after offering sale events per week on Saks’ main website. In July 2011, Zulily.com, a website offering sales targeted for women and babies/kids, captured the highest market share of visits at 16%, followed by Ideeli and LivingSocial Escapes. Amazon’s MyHabit ranked 11th, out of the 87 websites in the custom category after only 2 months in operation. Several of the major players over the past six months, the total visits to Ideeli increased 42%, Gilt.com up 14% and Nordstrom’s Hautelook up 8% for July 2011 as compared to February 2011. Total visits for MyHabit jumped 128% for July 2011 as compared to May 2011 when the website launched. The audience for Flash Sales continues to be attractive, and willing to shop – over-indexing against the online population for household incomes over $100k and creditworthy VantageScores of A and B.
The most effective way to segment a back-to-school audience is to include basic data elements with a segmentation methodology that recognizes the lifestyle and behavioral differences among households containing school-aged children. Experian’s Mosaic lifestyle segmentation solution can provide key insights into this lucrative audience.