In our last few blog posts, we’ve talked about customer segmentation and different ways to segment your target audience into smaller chunks like demographic and psychographic segmentation to connect with the right people. Customer segmentation enables marketers to focus their marketing efforts on their target customers, improving their marketing targeting strategy.
But what if there was a subset of users that had an even bigger impact when targeted? Enter Super Users – the strategic players who can give your ROI numbers a major boost! It may take some trial-and-error testing to pinpoint these super segments accurately, but knowing how these key individuals interact is essential for any successful marketing targeting strategy.
What is a Super User?
As technology progresses and media consumption grows, a unique group is rising to the top.
Activate Consulting’s Technology & Media Outlook 2023 found that Super Users are powering the digital world, with a strong presence across all major media and technology verticals. This select crowd is made up of young, educated individuals who lead affluent lifestyles – spending more time and money than any other user group!
Why should you add Super Users to your marketing targeting strategy?
Super Users are a highly influential audience with the potential to drive major business growth. They stand out from other users in their commitment and dedication across four key areas:
- Time spent with media
- Spend
- Technology and media adoption
- Emerging eCommerce behaviors
“Over the next years, the imperative for technology and media companies will be to identify, reach, and super-serve Super Users – the single group of power users whose time and spend far surpass those of other users.”
Activate consulting’s technology & media outlook 2023
You can use Super Users as a subset of your marketing targeting strategy. While you may need to reach beyond Super Users to achieve your goals, it’s worthwhile to consider:
- Targeting them separately
- Spending more on media
- Reaching them at a higher frequency
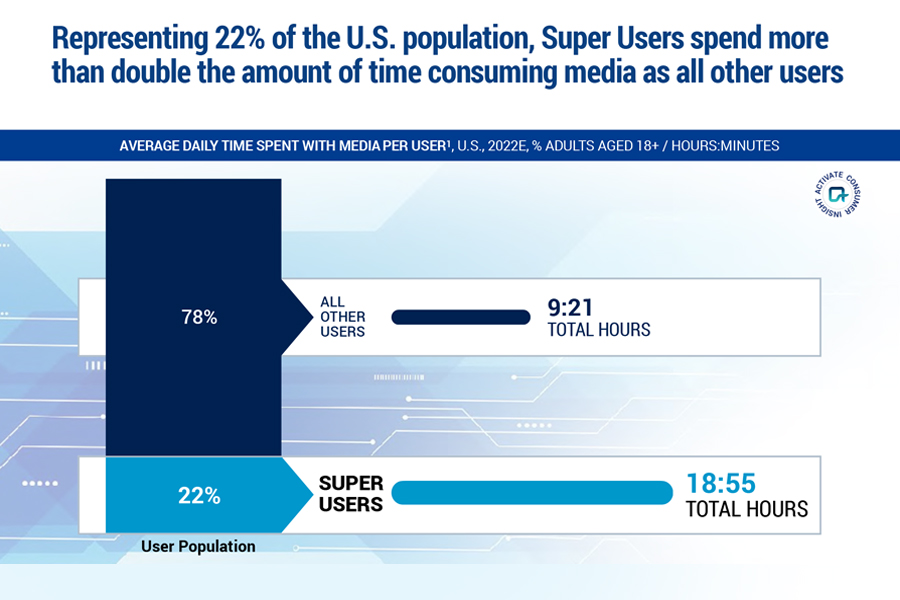
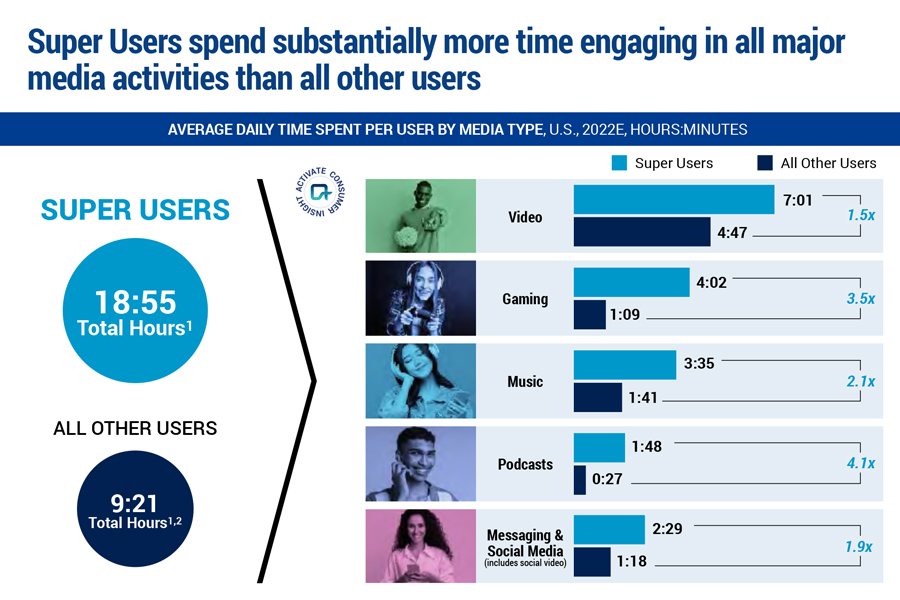
Time spent with media
Super Users make a powerful impact, despite comprising only 22% of the U.S. population. They are incredibly influential in terms of media consumption and engagement – spending more than double the amount of time interacting with content compared to other users.
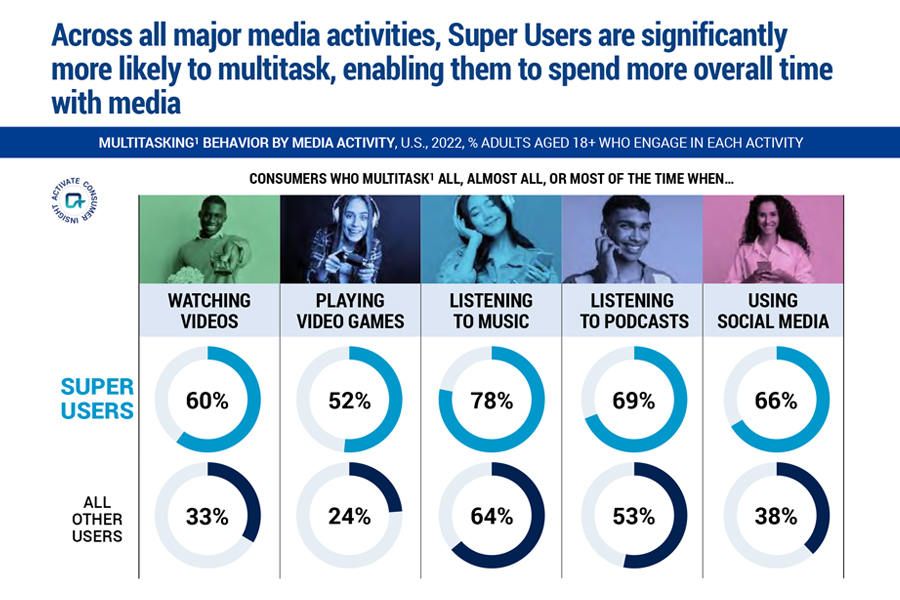
Inclined to multitask
Super Users take multitasking to the next level. Not only do they spend more time with electronics, but they excel in the art of juggling multiple activities. While watching videos and playing video games on one device, Super Users might also be busy engaging with social media on another. This makes them an unstoppable force when it comes to getting the most out of their digital experiences!
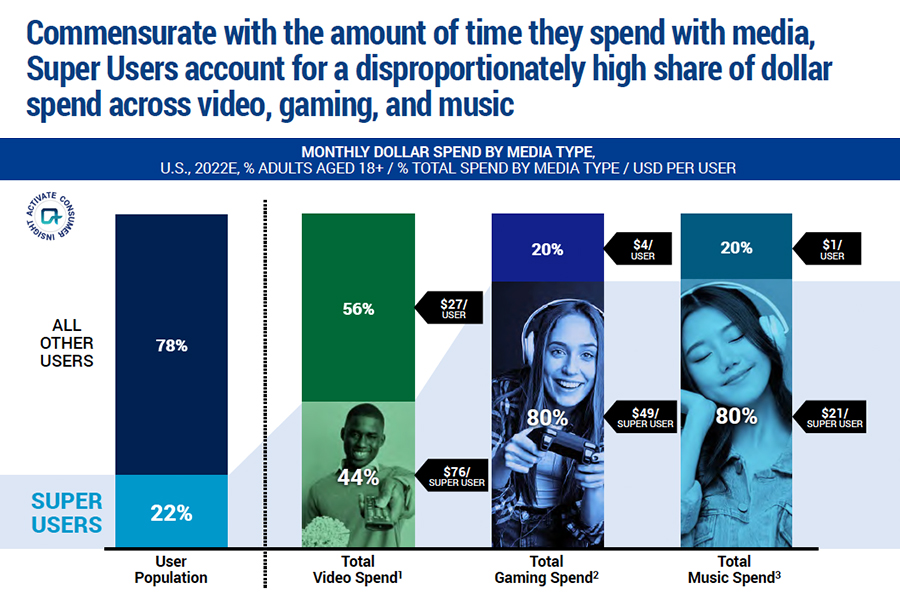
High share of dollar spend
Super Users are big spenders when it comes to media, particularly in gaming and music. Compared with all other users, Super Users’ average video spend is close to triple the amount ($76 vs $27). However, their biggest increases come from gaming and music; they’re collectively spending 12x more on games and shelling out 21x as much for tunes!
With 60% of eCommerce spend coming from Super Users, they are driving the industry forward with their enthusiasm and willingness to test out cutting-edge shopping trends like buying through social media, live streaming purchases, and trying on products virtually. Super Users are setting the tone for this dynamic industry.
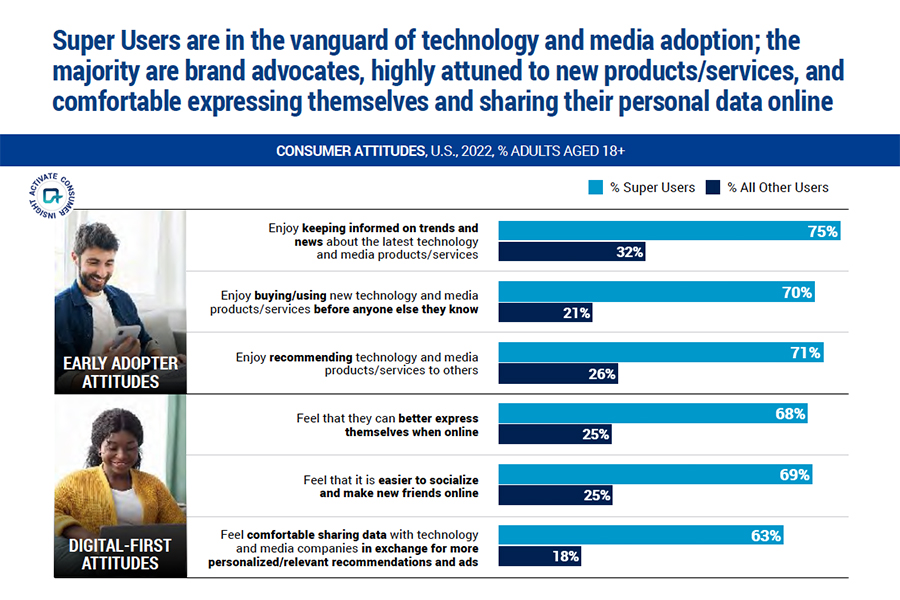
Technology and media adoption
Most Super Users are brand advocates. They’re trendsetting individuals who stay ahead of the curve on media and technology. They eagerly take advantage of new products, services, and data-sharing opportunities to receive tailored ads that fit their lifestyle.
Crypto & NFTs
Super Users blaze the trail for cryptocurrency and non-fungible tokens (NFTs)! This group is five times more likely to explore, engage with, and embrace new digital-monetary technologies.
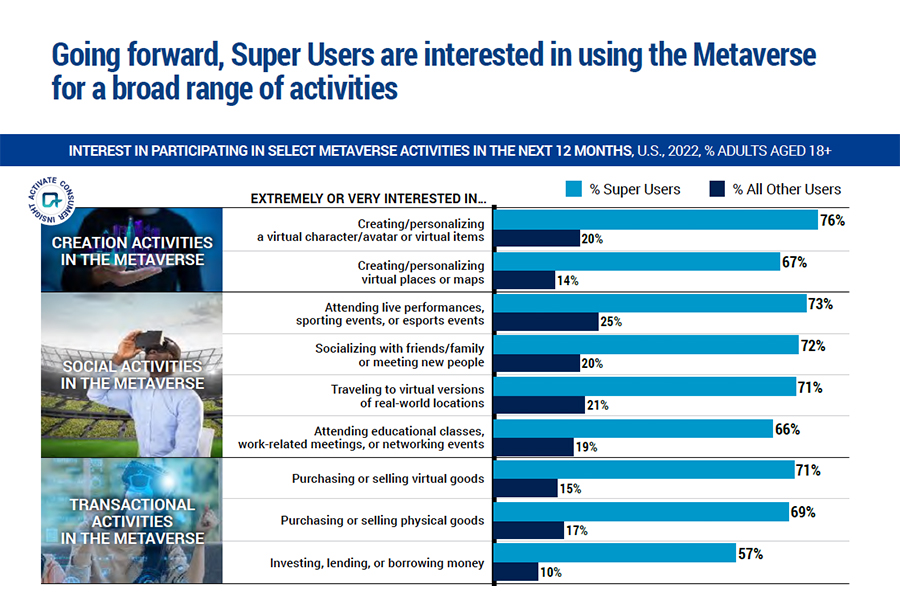
Pioneers of the Metaverse
As Metaverse usage continues to rise, Super Users are leading the way. Over 80% of these trailblazers have embraced these digital spaces within just the last year. We’re seeing accelerated interest from them as they seek out new opportunities for creativity, connections, and transactions within their favorite Metaverses. Many express interest in Metaverse experiences such as purchasing physical items to creating virtual havens. In fact, they’re 5x more interested in all things meta-related!
How Experian can help you identify and target Super Users
So how can you find your Super Users and include them in your marketing targeting strategy? Whether you want to build or acquire highly addressable audiences, we can help you precisely reach the right individuals and households in any channel you desire with Consumer View.
Consumer View
It all starts with data. Delivering the right message in the right place at the right time means truly knowing your prospects and customers as individuals – their lifestyles, behaviors, and shopping preferences. Consumer View data can provide a deeper understanding of your customers.
Consumer View is the world’s largest consumer database that contains over 3,900 attributes for 250 million adult consumers in the U.S. with coverage of 126 million (98%) of U.S. households. Consumer View can help you find out:
- What do your customers look like?
- What do your customers do?
- How and when should you reach your customers?
- What motivates your customers?
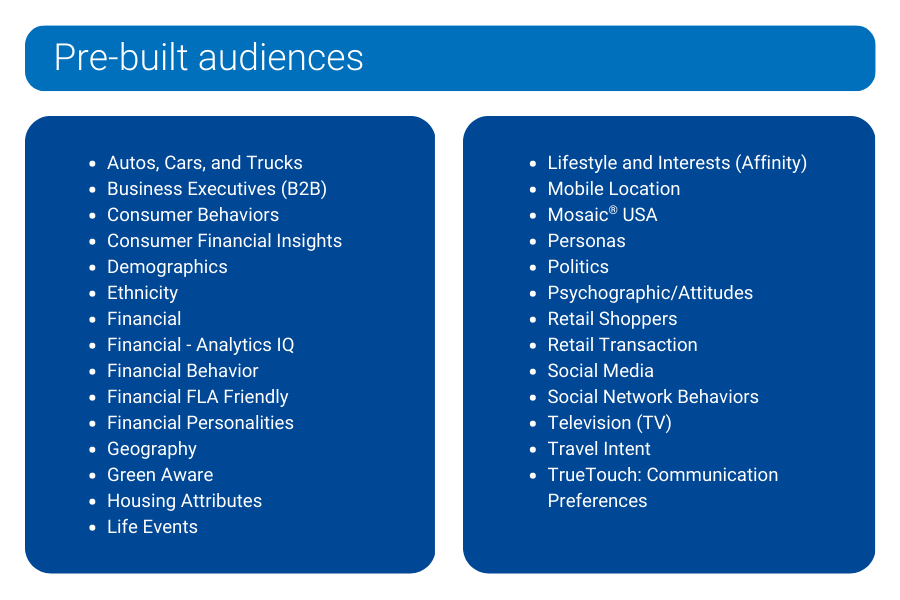
Modeled and syndicated audiences
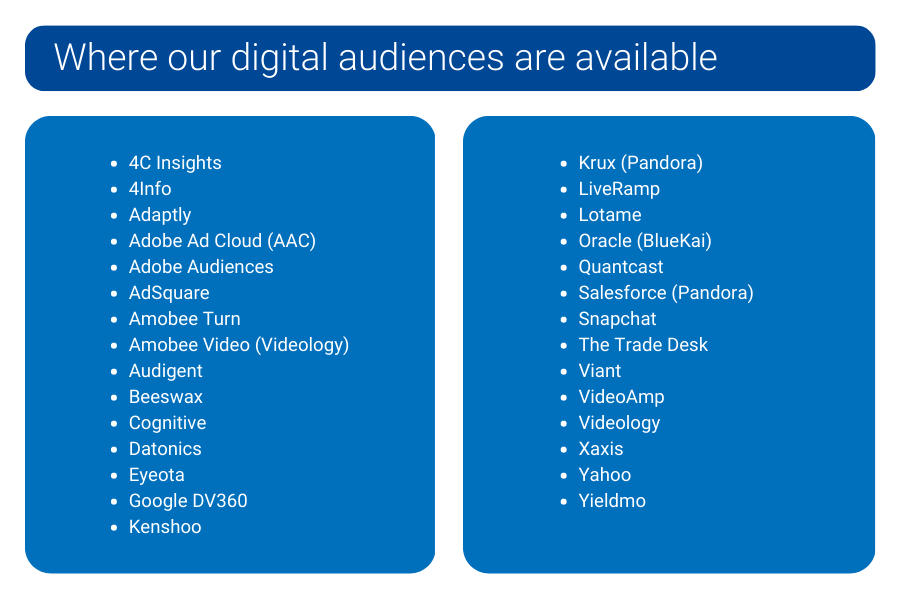
We have over 2,500 pre-built audiences that are privacy-safe and built using advanced data science and the most comprehensive consumer data available. These digital audiences are readily available via major publishers, data management platforms (DMPs), advanced TV operators, and demand-side platforms (DSPs).
Our pre-built audiences can be used consistently across multiple distribution partners – making sure you can quickly find the right audience for the right campaign without having to build your own consumer personas. In addition to being available as digital audiences, our segmentation products are also available to use across all consumer touchpoints to enable consistent omnichannel campaign targeting.
There are infinite data combinations and selections we can help you with for optimal audience targeting. Using our comprehensive inventory of data, we can find even the most unusual of audiences to help you connect with new prospects. From demographics to behavioral and psychographic information, we draw on a massive base of knowledge accumulated during five decades in business.
Mosaic® USA
Experian’s Mosaic® USA is a household-based consumer lifestyle segmentation system that classifies all U.S. households and neighborhoods into 71 unique types and 19 overarching groups, providing a 360-degree view of consumers’ choices, preferences, and habits. Using Mosaic lifestyle segmentation, you can anticipate the behavior, attitudes, and preferences of your best customers and reach them in the most effective traditional and digital channels with the right message in the right place at the right time.
Tailored Segmentation uses a sophisticated data-driven clustering system that leverages the 71 Mosaic types that match to first-party data like yours. Tailored Segmentation allows you to regroup Mosaic types based on the attributes you weigh as more impactful to your business. Have you designed your own segments in-house? You can apply Tailored Segmentation to those segments for deeper insights through a tailored analysis. Are you still looking for a way to segment your market even though you understand your typical best customer? Tailored Segmentation can weigh these attributes and develop a custom clustering and analysis of your market.
We can help you find your Super Users
Super Users are an important segment of any market. Marketers need to be able to identify them quickly and act upon their insights. Our marketing solutions provide the necessary data and analytical capabilities to easily find and target your potential Super Users for an effective marketing targeting strategy.
With Experian, you can deliver messages that are more in line with what matters to this influential group of customers. We understand how challenging it can be to find these customers and ensure they get the tailored, personalized messaging they deserve – so let us help you do just that! We can provide deep insights beyond the generic customer persona that allows marketers to look into the effectiveness of their marketing strategies from multiple angles. We want to help you gain an edge over your competitors by helping you identify, target, and engage Super Users for increased revenue growth. Ready to find your Super Users?
Sources
Activate Technology & Media Outlook 2023. Activate Consulting.
Latest posts

The Latino Influence Project came about because we wanted to prove if Hispanics really are influencing the mainstream or not.
Experian Marketing Services Consumer Expectation Index shows positive outlook for 2012 holiday season.
Time to polish off our crystal ball and give predictions from consumers’ fingertips of hot products of the holiday season. See what made the list.