2024 marked a significant year. AI became integral to our workflows, commerce and retail media networks soared, and Google did not deprecate cookies. Amidst these changes, ID bridging emerged as a hot topic, raising questions around identity reliability and transparency, which necessitated industry-wide standards. We believe the latest IAB OpenRTB specifications, produced in conjunction with supply and demand-side partners, set up the advertising industry for more transparent and effective practices.
So, what exactly is ID bridging?
As signals, like third-party cookies, fade, ID bridging emerged as a way for the supply-side to offer addressability to the demand-side. ID bridging is the supply-side practice of connecting the dots between available signals, that were generated in a way that is not the expected default behavior, to understand a user’s identity and communicate it to prospective buyers. It enables the supply-side to extend user identification beyond the scope of one browser or device.
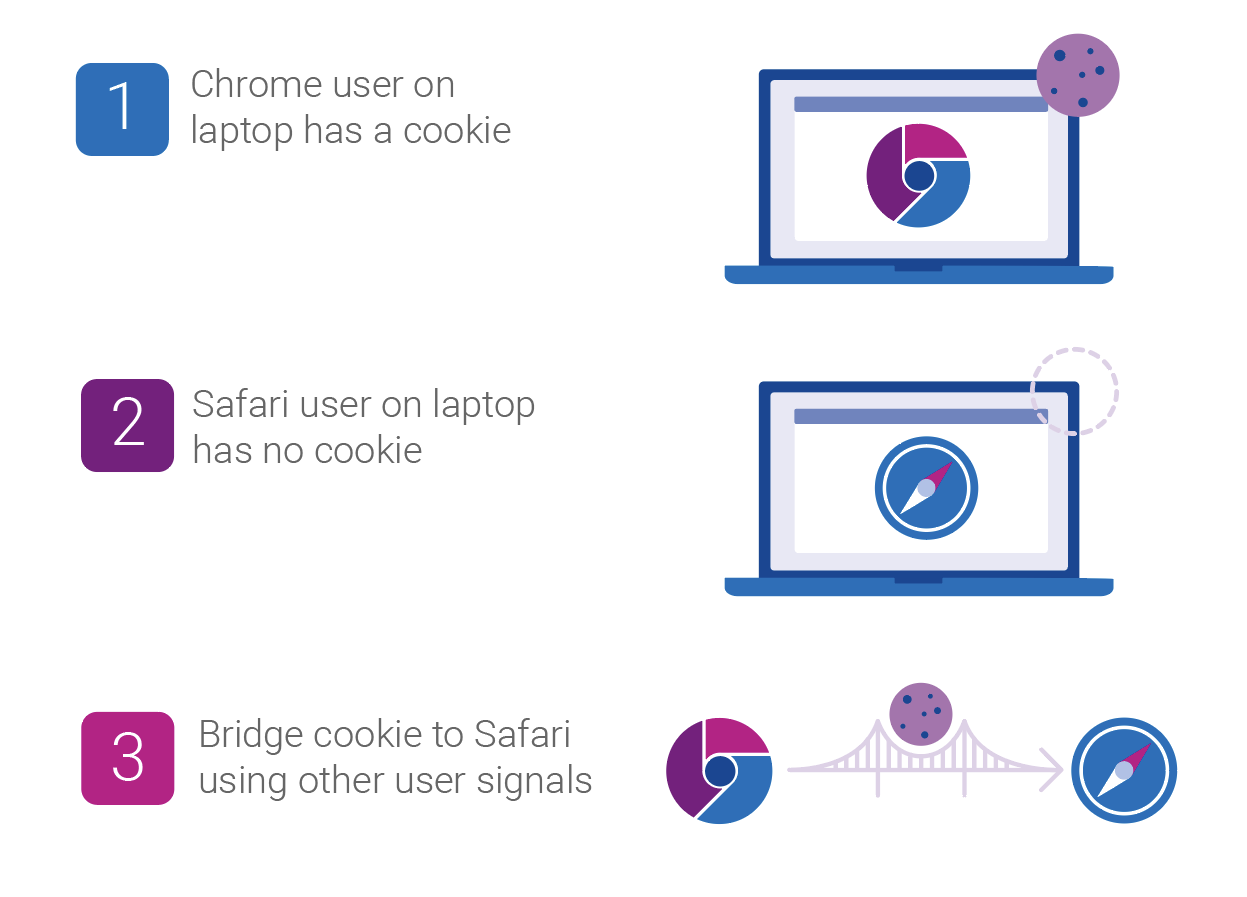
Imagine you visit a popular sports website on your laptop using Chrome. Later, you use the same device to visit the same sports website, but this time, on Safari. By using identity resolution tools, a supply-side partner can infer that both visits are likely from the same user and communicate with them as such.
ID bridging is not inherently a bad thing. However, the practice has sparked debate, as buyers want full transparency into the use of a deterministic identifier versus an inferred one. This complicates measurement and frequency capping for the demand-side. Before OpenRTB 2.6, ID bridging led to misattribution as the demand-side could not attribute ad exposures, which had been served to a bridged ID, to a conversion, which had an ID different from the ad exposure.
OpenRTB 2.6 sets us up for a more transparent future
In 2010, the IAB, along with supply and demand-side partners, formed a consortium known as the Real-Time Bidding Project for companies interested in an open protocol for the automated trading of digital media. The OpenRTB specifications they produced became that protocol, adapting with the evolution of the industry.
The latest evolution, OpenRTB 2.6, sets out standards that strive to ensure transparency in real-time bidding, mandating how the supply-side should use certain fields to more transparently provide data when inferring users’ identities.
What’s new in OpenRTB 2.6?
Here are the technical specifications for the industry to be more transparent when inferring users’ identities:
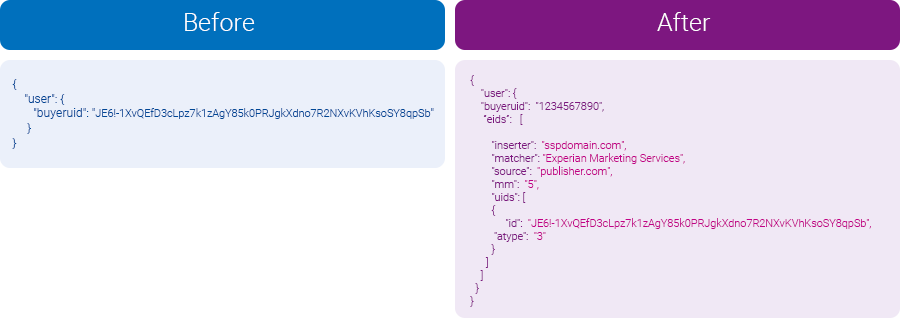
- Primary ID field: This existing field now can only contain the “buyeruid,” an identifier mutually recognized and agreed upon by both buyer and seller for a given environment. For web environments, the default is a cookie ID, while for app activity, it is a mobile advertising ID (MAID), passed directly from an application downloaded on a device. This approach ensures demand-side partners understand the ID’s source.
- Enhanced identifier (EID) field: The EID field, designated for alternative IDs, now accommodates all other IDs. The EID field now has additional parameters that provide buyers transparency into how the ID was created and sourced, which you can see in the visual below:
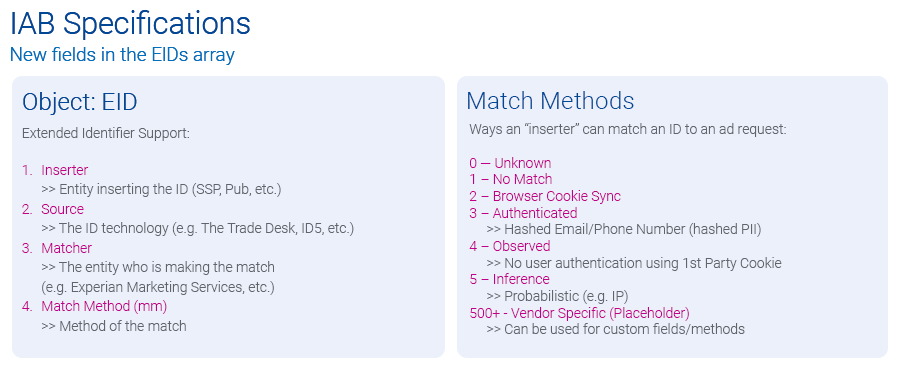
Using the above framework, a publisher who wants to send a cross-environment identifier that likely belongs to the same user would declare the ID as “mm=5,” while listing the potential third-party identity resolution partner under the “matcher” field, which the visual below depicts. This additional metadata gives the demand-side the insights they need to evaluate the reliability of each ID.
“These updates to OpenRTB add essential clarity about where user and device IDs come from, helping buyers see exactly how an ID was created and who put it into the bidstream. It’s a big step toward greater transparency and trust in the ecosystem. We’re excited to see companies already adopting these updates and can’t wait to see the industry fully embrace them by 2025.”
Hillary Slattery, Sr. Director, Programmatic, Product Management, IAB Tech Lab
Experian will continue supporting transparency
As authenticated signals decrease due to cookie deprecation and other consumer privacy measures, we will continue to see a rise in inferred identifiers. Experian’s industry-leading Digital Graph has long supported both authenticated and inferred identifiers, providing the ecosystem with connections that are accurate, scalable, and addressable. Experian will continue to support the industry with its identity resolution products and is supportive of the IAB’s efforts to bring transparency to the industry around the usage of identity signals.
Supply and demand-side benefits of adopting the new parameters in OpenRTB 2.6
- Partner collaboration: Clarity between what can be in the Primary ID field versus the EID field provides clear standards and transparency between buyers and sellers.
- Identity resolution: The supply side has an industry-approved way to bring in inferred IDs while the demand side can evaluate these IDs, expanding addressability.
- Reducing risk: With accurate metadata available in the EID field, demand-side partners can evaluate who is doing the match and make informed decisions on whether they want to act on that ID.
Next steps for the supply and demand-sides to consider
For supply-side and demand-side partners looking to utilize OpenRTB 2.6 to its full potential, here are some recommended steps:
For the supply-side:
- Follow IAB Specs and provide feedback: Ensure you understand and are following transparent practices. Ask questions on how to correctly implement the specifications.
- Vet identity partners: Choose partners who deliver the most trusted and accurate identifiers in the market.
- Be proactive: Have conversations with your partners to discuss how you plan to follow the latest specs, which identity partners you work with, and explain how you plan to provide additional signals to help buyers make better decisions.
We are beginning to see SSPs adopt this new protocol, including Sonobi and Yieldmo.
“The OpenRTB 2.6 specifications are a critical step forward in ensuring transparency and trust in programmatic advertising. By aligning with these standards, we empower our partners with the tools needed to navigate a cookieless future and drive measurable results.”
Michael Connolly, CEO, Sonobi
These additions to the OpenRTB protocol further imbue bidding transactions with transparency which will foster greater trust between partners. Moreover, the data now available is not only actionable, but auditable should a problem arise. Buyers can choose, or not, to trust an identifier based on the inserter, the provider and the method used to derive the ID. While debates within the IAB Tech Lab were spirited at times, they ultimately drove a collaborative process that shaped a solution designed to work effectively across the ecosystem.”
Mark McEachran, SVP of Product Management, Yieldmo
For the demand side:
- Evaluation: Use the EID metadata to assess all the IDs in the EID field, looking closely at the identity vendors’ reliability. Select partners who meet high standards of data clarity and accuracy.
- Collaboration: Establish open communication with supply-side partners and tech partners to ensure they follow the best practices in line with OpenRTB 2.6 guidelines and that there’s a shared understanding of the mutually agreed upon identifiers.
- Provide feedback: As OpenRTB 2.6 adoption grows, consistent feedback from demand-side partners will help the IAB refine these standards.
Moving forward with reliable data and data transparency
As the AdTech industry moves toward a cookieless reality, OpenRTB 2.6 signifies a substantial step toward a sustainable, transparent programmatic ecosystem. With proactive adoption by supply- and demand-side partners, the future of programmatic advertising will be driven by trust and transparency.
Experian, our partners, and our clients know the benefits of our Digital Graph and its support of both authenticated and inferred signals. We believe that if the supply-side abides by the OpenRTB 2.6 specifications and the demand-side uses and analyzes this data, the programmatic exchange will operate more fairly and deliver more reach.
Latest posts

Autotrader leverages The Tapad Device GraphTM to achieve higher performance and reach new audiences across all devices New York, NY – September 6, 2017 – Tapad, the leader in cross-device marketing technology and now a part of Experian, today revealed findings from a campaign conducted with Autotrader which connects with more actual car buyers than any other third-party listing site.* Autotrader’s premium audience, combined with the Tapad Device GraphTM, delivered significant audience extension across desktop, mobile, and tablet to drive awareness and maximize both reach and delivery across screens. To help analyze shopping behaviors across multiple devices, the global automotive brand for this campaign turned to Autotrader and Tapad, who created a cross-device pre-roll video strategy with a focus on viewability, concentrating on potential customers already searching for vehicles. By using a one-to-one connection, instead of look-alike modeling, Tapad also ensured that the automotive brand discovered only new consumers across all of their devices. This approach discovered a new potential audience of more than 14 million consumers, eliminated communication waste and the risk of duplicates, increased overall performance, and ensured more of their campaign dollars reached meaningful audiences. Overall, this case study represents a leap forward in terms of audience-based targeting and the highly-sought after multi-touch attribution modeling. “We really enjoy working with the team at Tapad to help execute our Audience Extension campaigns”, said Lynne Green, product manager at Autotrader. “Their ability to meet the demands of an ever-changing industry, as well as their dependable customer service has allowed us to confidently deliver against our unique in-market automotive audience and provide our clients ongoing messaging opportunities to our audience beyond Autotrader.com.” “How identity relates to conversion behavior is a complex part of any advertising campaign,” said Jeff Kelosky, RVP and head of global automotive at Tapad. “After identifying auto consumer’s behavioral patterns and device usage while shopping for vehicles, we knew we could successfully help Autotrader and its automotive brand clients maximize campaign viewability and drive results.” To learn more about using Audience Extension with Autotrader, click here. For more about the Tapad Device GraphTM, or to request a demo, visit https://www.experian.com/marketing/consumer-sync Contact us today!
With campaigns applied to seven major holding companies, Tapad continues to see healthy adoption with The Trade Desk clients NEW YORK, NY – August 23, 2017 – Tapad, now a part of Experian, the leader in cross-device marketing technology, today announced its ongoing momentum with The Trade Desk, Inc. (Nasdaq: TTD), a global technology platform for buyers of advertising. Tapad is providing cross-device segments from the groundbreaking Tapad Device GraphTM through The Trade Desk’s platform. Since 2015, Tapad has seen steady growth in the use of its cross-device data across The Trade Desk platform. This forward progress continues, as 1H2017 saw important milestones for Tapad. Seven major private and independent holding companies now apply Tapad’s data to their campaigns, in addition to more than 1,500 unique brands. Tapad’s proprietary Device GraphTM connects billions of devices, providing unified and insightful data for brands, agencies, and marketers across the globe. Several of these clients, representing varying industries from financial, to auto, CPG and retail, apply Tapad’s data across a number of key tactics and strategies, including: first party CRM extension, third party audience extension, cross-device retargeting, cross-device frequency management, and more. Clients in these verticals continue to rely on Tapad’s cross-device data, as Tapad saw the amount of usage by financial and retail clients grow by four times over the past year, and double for automotive and CPG clients. “We are pleased to offer our clients access to Tapad’s device graph”, said David Danziger, VP of Data Partnerships, The Trade Desk. “Their cross-device identification capabilities have been a powerful addition to our omnichannel platform.” “This integration is a shining example of the amplifying effect of two of the best platforms working together,” said Chris Feo, SVP of Global Partnerships at Tapad. "Clients leveraging Tapad's Device Graph in The Trade Desk platform have the potential to see higher returns and reach with access to substantial cross-device data, as well as a very effective media platform." Contact us today!
Tapad Device Graph™ and Sojern’s mobile offering unify travel intent signals; achieve amplification rate of more than 600 percent NEW YORK, June 15, 2017 — Tapad, a part of Experian, the leader in cross-device marketing technology, is partnering with Sojern, travel’s direct demand engine, to provide marketers with an even stronger understanding of travelers as they research and shop across multiple devices. Combined with its 350 million global traveler profiles and billions of predictive purchase intent signals, Sojern utilizes the Tapad Device Graph™ to resolve the complex travel consumer journey, target travelers more precisely, and derive more actionable insights for its travel clientele. According to Sojern’s research, travelers visit hundreds of websites preceding their trip purchase, with some consumers reaching upwards of 450 touchpoints prior to booking. Sojern’s partnership with Tapad will help unify these touchpoints across devices, enabling travel brands to more effectively nurture and engage potential buyers during the purchase process, regardless of which device they use. “Sojern’s been focused on travel for over a decade, helping brands activate predictive purchase signals and leverage our traveler profiles into effective performance marketing campaigns,” said Mat Harris, Sojern’s VP of Product, Enterprise Solutions. “The cross-device insights we gain from the Tapad Device Graph provide a valuable tool for our customers to reach travelers across devices in real-time and at scale, on the right device.” Prior to selecting Tapad as its cross-device partner, Sojern surveyed several probabilistic and deterministic cross-device vendors and performed an extensive global test. The test was an examination of scale, match rate and several other factors, which enabled Sojern to learn as much as possible about each vendor. After examining the final test results, Sojern selected Tapad based on its excellent test performance, tried-and-true experience in the market and complimentary business model. To date, Sojern has already seen an amplification rate of more than 600 percent as a result of the integration, meaning that the Tapad Device Graph is connecting an average of six or more device and browser IDs for every one existing Sojern ID. “Not only is Sojern a compatible partner for our singular Device Graph capabilities, but they are also an incredible data partner to help expand our work in the travel industry,” said Pierre Martensson, SVP and GM of Tapad’s global data division. “Working with the team at Sojern allows us to solve a true challenge within the travel industry today: creating a unified view of customers so travel brands can better understand and access their key audiences at every point along their path to purchase.” Contact us today!