The stakes are high when it comes to advertising during football’s biggest games as the cost of advertising continues to rise, with the average 30-second TV ad during the 2023-24 Sunday Night Football season priced at $882K. With record viewership at the College Football Playoff and the Super Bowl drawing in 123.7 million average viewers, the largest TV audience on record, it’s no surprise that brands are willing to pay those prices since football games are prime time for reaching engaged audiences. In fact, an estimated 51% of viewers search for an ad they saw during the game, underscoring the potential of second-screen engagement to amplify campaign impact. Whether you advertise on TV during these games or not, brands are exploring how they can use football season to drive a deeper connection to their audience. To do this, brands need data driven strategies.
In this blog post, we’ll reveal audience segments designed for you to craft tailored marketing strategies that resonate with football fans in the stands and on the couch. You can find the complete audience segment name in the appendix.
Make a game-winning play with Experian Audiences
With playoff season fast approaching, it’s the perfect time to go on the offensive and target football fans. Utilize Experian’s syndicated audiences to ensure your marketing messages resonate with fans when they’re the most engaged.
- Experian’s 2,400+ syndicated audiences are available directly on over 30 leading television, social, and programmatic advertising platforms.
- Reach consumers based on who they are, where they live, and what they do using data ranked #1 in accuracy by Truthset.
- Run omnichannel campaigns based on a reliable understanding of households, people, digital identifiers, and marketing attributes.
Four football audience categories to add to your advertising lineup
Football fans come in all shapes, sizes, and viewing habits. From dedicated supporters to casual viewers, targeting the right audience can make or break your campaign.
Here are four football audience categories you can target:
- Sports enthusiasts
- College football fans
- 21+ audiences
- TV viewers
Let’s huddle up and break down the audience segments within each category. Whether it’s tailgating, tuning in, or cheering from the stands, these insights will get your campaign into the end zone.
Sports enthusiasts

Whether they’re following their favorite teams, attending games in person, or watching professional sports events on TV, football fans are deeply engaged, making them an ideal target for advertisers looking to score big.
Here are five audiences to target:
- NFL Enthusiasts
- Football (FLA/Fair Lending Friendly)1
- Sports Enthusiasts
- NFL Stadium Visitors
- Professionals Sports Event
College football fans
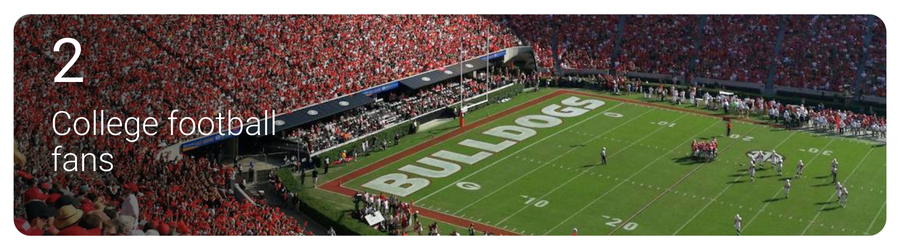
College football fans bring unmatched passion and loyalty, with bowl games during the 2023 season drawing on average of 4.6 million viewers across 40 total games—a 5% increase year-over-year. From students to alumni, these fans represent an invaluable opportunity for advertisers to connect with a deeply invested audience.
Here are four audiences to target to connect with passionate college football fans:
- College Football Stadium Visitors
- College Football Bowls
- College Students
- College Sports Venues
21+ audiences
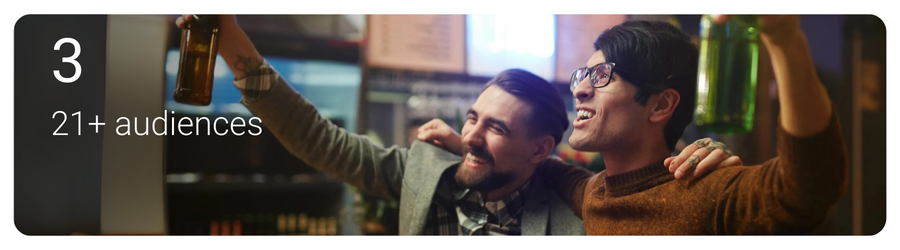
With 84% of U.S adults reporting that they drink alcohol while watching football on TV, targeting 21+ audiences during game season is a winning play. Whether they’re cracking open a cold one at a tailgate, hosting a game-day party, or relaxing on the couch, these audiences represent a key audience for brands looking to tap into football culture.
Here are four audiences that you can target this post season:
- Imported Light Beer Enthusiasts
- Domestic/Imported Beer
- High-end Spirit Drinkers
- Discretionary spend: Alcohol and wine $331 – $726
These audiences can help you serve up campaigns that pour directly into the heart of football fandom.
TV viewers
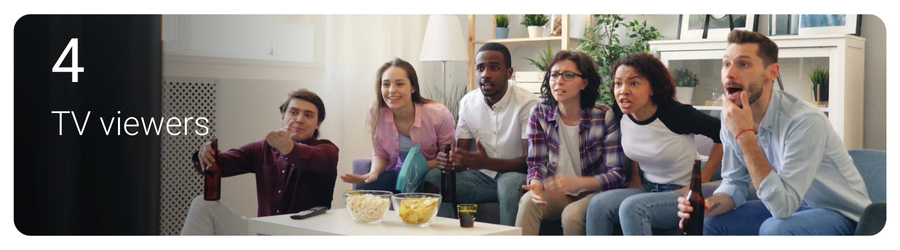
Football games attract some of the most engaged and diverse TV audiences, with 85% of sports fans preferring to watch live sports on TV rather than in-person. Notably, for the first time, viewers aged 18 to 49 spent the majority of their sports viewing time (54%) via streaming. This shift highlights the immense opportunity for advertisers to connect with highly attentive viewers tuned into every play.
Here are seven audiences that you can use to create a game-winning strategy to reach engaged TV watching football fans:
- Cable Satellite or Streaming Network Subscribers
- Streaming Video: High Spenders
- Cord Cutters
- Cable and Streaming TV Service Subscribers
- Paid TV High Spenders
- Screen Size – Large
- Co-Watchers
Whether they’re catching the action on a large TV screen or streaming from their phone, these audiences will help you craft campaigns that deliver results with highly engaged viewers.
Score big with Experian this postseason
As some of football’s biggest games approach, it’s time to huddle up and connect with consumers who live for the thrill of the game.Whether they’re tuning in to cheer for their favorite teams, tailgating with friends, or enjoying the game-day experience from home, Experian Marketing Data provides the playbook to score big with targeting, enrichment, and activation. With Experian’s data-driven insights, you can turn every opportunity into a game-winning play!
You can activate our syndicated audiences on-the-shelf of most major platforms. For a full list of Experian’s syndicated audiences and activation destinations, download our syndicated audiences guide.
Explore our other seasonal audiences that you can activate today.
1 “Fair Lending Friendly” indicates data fields that Experian has made available without use of certain demographic attributes that may increase the likelihood of discriminatory practices prohibited by the Fair Housing Act (“FHA”) and Equal Credit Opportunity Act (“ECOA”). These excluded attributes include, but may not be limited to, race, color, religion, national origin, sex, marital status, age, disability, handicap, family status, ancestry, sexual orientation, unfavorable military discharge, and gender. Experian’s provision of Fair Lending Friendly indicators does not constitute legal advice or otherwise assures your compliance with the FHA, ECOA, or any other applicable laws. Clients should seek legal advice with respect to your use of data in connection with lending decisions or application and compliance with applicable laws.
Appendix
Sports enthusiasts
- Lifestyle and Interests (Affinity) > Activities and Entertainment > NFL Enthusiasts
- Lifestyle and Interests (Affinity) > Sports and Recreation > Sports Enthusiast
- Mobile Location Models > Visits > NFL Stadium Visitors
- Lifestyle and Interests (Affinity) > Sports > Football (FLA / Fair Lending Friendly)2 Travel Intent > Activities > Professional Sports Event
College sports fans
- Mobile Location Models > Visits > University Stadium College Football Visitor
- Lifestyle and Interests (Affinity) > Sports > College Football Bowls
- Mobile Location Models > Visits > College Students
- Mobile Location Models > Visits > College Sport Venues
21+ audiences
- Lifestyle and Interests (Affinity) > Activities and Entertainment > Imported Light Beer Enthusiasts
- Lifestyle and Interests (Affinity) > In-Market > Domestic/Imported Beer
- Lifestyle and Interests (Affinity) > Retail > High-end Spirit Drinkers
- Financial – Analytics IQ > Discretionary Spend > Alcohol and Wine: $331-$726
TV viewers
- Television (TV) > Household/Family Viewing > Cable Satellite or Streaming Network Subscribers
- Retail Shoppers: Purchase Based > Entertainment > Streaming/Video/Audio/CTV/Cable TV: Streaming Video: High Spenders
- Television (TV) > Household/Family Viewing > Cord Cutters
- Television (TV) > Household/Family Viewing > Cable and Streaming Service Subscribers
- Television (TV) > TV Enthusiasts > Paid TV High Spenders
- Television (TV) > Viewing Device Type > Screen Size – Large
- Television (TV) > Household/Family Viewing > Co-Watchers
Latest posts

With the busy holiday marketing season in full swing, Experian Marketing Services has released its online retail round-up for the week ending Dec. 8.
Twenty years ago this week, the first mobile text message, or SMS, was sent by British engineer Neil Papworth. Today, Americans are texting more than ever and among young adults, many of whom were not yet born when the first message was sent, texting is almost as common a mobile activity as talking. And why wouldn’t it be? According to the latest Simmons National Consumer Study, 48% of adults ages 18-to-24 say that a conversation via text message is just as meaningful as a telephone call. A similar share of adults ages 25-to-34 feel the same way. Regardless of age, texting is still, technically, the second most common activity that Americans engage in on their cell phone after talking. During a typical week, 95% of mobile adults talk on their mobile phone, while 59% text. Among adults ages 18-to-24, however, 89% talk on their phone and 85% text. Despite the increasing availability of mobile chat or instant message applications, texting remains the dominant means for exchanging short messages. Only 8% of all mobile adults use their phone to IM or chat. The fastest thumbs To get a more in-depth understanding of the texting habits of adults today, we leveraged data from the Simmons Connect mobile panel of 1,485 U.S. smartphone owners. Hands down, young adults text more than any age other age group. During a typical month, in fact, smartphone-owners ages 18-to-24 send 2,022 mobile text messages and receive another 1,831 for a combined total of 3,852 texts sent and received. With every age bracket we move up, the number of mobile texts drops by roughly 40%. For instance, smartphone owners ages 25-to-34 send, on average, 1,110 text messages a month and receive another 1,130 for a combined total of 2,240 messages. We are also able to leverage the Simmons Connect smartphone panel to understand mobile calling behaviors. The data shows that while young adults hold the record for the most text messages sent and received, they actually make and receive few calls, by comparison. During a typical month, smartphone owners ages 18-to-24 make 119 calls on their mobile phone and answer another 64 calls. Adults ages 35-to-44 make and receive the most calls on their mobile phones in a given month. (Call counts do not include inbound and outbound calls that go unanswered.) Text around the clock Unlike television and radio, which have peak hours for reaching consumers, mobile text messages reach Americans throughout the day, providing advertisers with a medium to connect with consumers any time they want or need. No surprise, young adults are the most likely to send and receive mobile text messages throughout the day. The smartphone panel data shows that during every hour between 8:00 A.M. and midnight, more than half of young smartphone owners are both sending and receiving mobile text messages. Even when most of us are asleep, young adults’ smartphones continue buzzing from inbound texts. In fact, 37% of 18-to-24 year-old smartphone owners receive texts at 4:00 in the morning. By comparison, just 20% of smartphone-owners ages 25-to-34 years-old receive texts at this late (or early) hour as do 17% of those 35-to-44, 15% of those 45-to-54 and 10% of those ages 55 and older. Better to send or to receive? During overnight hours, the share of young smartphone owners who send texts surpasses the share who receives them. However, by 8:00 A.M., the difference between those two figures narrows to the point that they are nearly equal. In fact, from noon until 11:00 P.M., young adults are more likely to send mobile text messages than they are to receive them. Call or text? While texting is still a secondary use of mobile phones after calling, that’s not the case all day, especially among young adults. In fact, while smartphone owners ages 18-to-24 are more likely to make an outbound call than they are to send a text from their phone between 7:00 A.M. and 10:00 P.M., they are more likely to send a text between 11:00 P.M. and 6:00 A.M., during hours when they might understandably wake the recipient. That should help us all sleep a little better.
Black Friday online traffic increased 7% in 2012 versus 2011 as the top 500 retail sites received more than 193.8 million total US visits. So far this Holiday week of online traffic to the top retail sites is up 10% on average. Online retail traffic was up 1% on Black Friday compared to Thanksgiving Day 2012 traffic this year. Amazon.com remained the top visited retail site on Black Friday while Walmart was the second most visited retail site. BestBuy moved up to the 3rd most visited site while Target was the 4th most visited site. JC Penney moved up from being the 8th most visited retail site on Thanksgiving Day to the 5th most visited on Black Friday. Among the top 5 sites, JC Penney saw the biggest day-over-day growth at 26%. Looking at the top 20 retail sites on Black Friday, the Apple Store site saw the biggest day-over-day growth at 99%. Check back for CyberMonday insight and a weekly recap of this week. Learn more about the author, Matt Tatham