Loading...

Score a touchdown with Experian’s football audience playbook

Published: January 7, 2025 by Lucy Simmonds

Huddle up: Target football's biggest fans with Experian Audiences

The stakes are high when it comes to advertising during football’s biggest games as the cost of advertising continues to rise, with the average 30-second TV ad during the 2023-24 Sunday Night Football season priced at $882K. With record viewership at the College Football Playoff and the Super Bowl drawing in 123.7 million average viewers, the largest TV audience on record, it’s no surprise that brands are willing to pay those prices since football games are prime time for reaching engaged audiences. In fact, an estimated 51% of viewers search for an ad they saw during the game, underscoring the potential of second-screen engagement to amplify campaign impact. Whether you advertise on TV during these games or not, brands are exploring how they can use football season to drive a deeper connection to their audience. To do this, brands need data driven strategies.

In this blog post, we’ll reveal audience segments designed for you to craft tailored marketing strategies that resonate with football fans in the stands and on the couch. You can find the complete audience segment name in the appendix.

Make a game-winning play with Experian Audiences

With playoff season fast approaching, it’s the perfect time to go on the offensive and target football fans. Utilize Experian’s syndicated audiences to ensure your marketing messages resonate with fans when they’re the most engaged.

  • Experian’s 2,400+ syndicated audiences are available directly on over 30 leading television, social, and programmatic advertising platforms.
  • Reach consumers based on who they are, where they live, and what they do using data ranked #1 in accuracy by Truthset.
  • Run omnichannel campaigns based on a reliable understanding of households, people, digital identifiers, and marketing attributes.

Four football audience categories to add to your advertising lineup

Football fans come in all shapes, sizes, and viewing habits. From dedicated supporters to casual viewers, targeting the right audience can make or break your campaign.

Here are four football audience categories you can target:

  • Sports enthusiasts
  • College football fans
  • 21+ audiences
  • TV viewers

Let’s huddle up and break down the audience segments within each category. Whether it’s tailgating, tuning in, or cheering from the stands, these insights will get your campaign into the end zone.

Sports enthusiasts

Sports enthusiasts

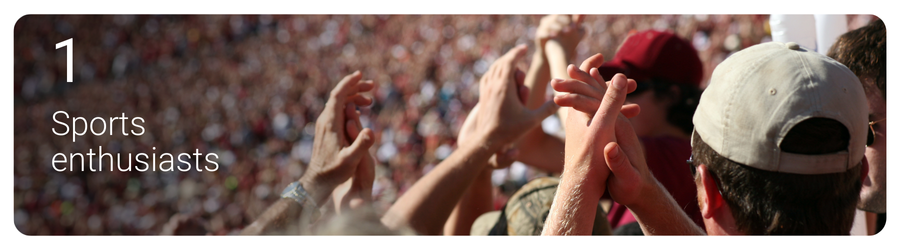
Whether they’re following their favorite teams, attending games in person, or watching professional sports events on TV, football fans are deeply engaged, making them an ideal target for advertisers looking to score big.

Here are five audiences to target:

  1. NFL Enthusiasts
  2. Football (FLA/Fair Lending Friendly)1
  3. Sports Enthusiasts
  4. NFL Stadium Visitors
  5. Professionals Sports Event

College football fans

College football fans

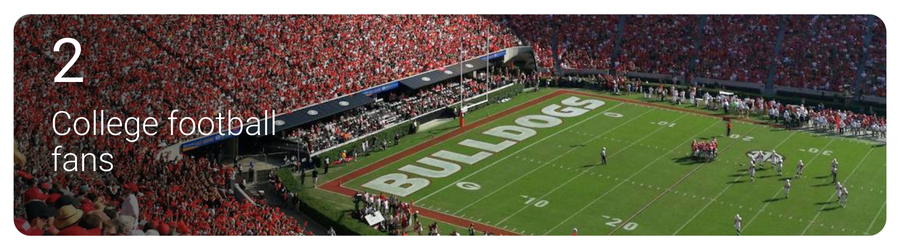
College football fans bring unmatched passion and loyalty, with bowl games during the 2023 season drawing on average of 4.6 million viewers across 40 total games—a 5% increase year-over-year. From students to alumni, these fans represent an invaluable opportunity for advertisers to connect with a deeply invested audience.

Here are four audiences to target to connect with passionate college football fans:

  1. College Football Stadium Visitors
  2. College Football Bowls
  3. College Students
  4. College Sports Venues

21+ audiences

21+ audiences

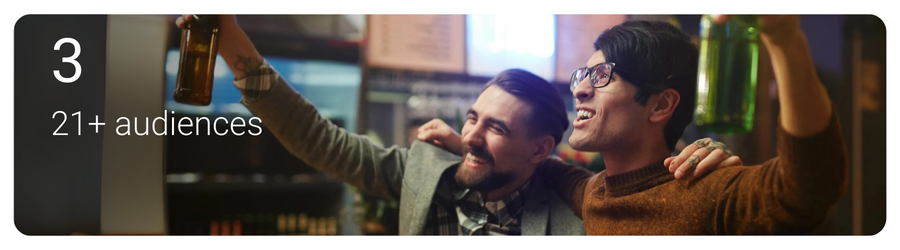
With 84% of U.S adults reporting that they drink alcohol while watching football on TV, targeting 21+ audiences during game season is a winning play. Whether they’re cracking open a cold one at a tailgate, hosting a game-day party, or relaxing on the couch, these audiences represent a key audience for brands looking to tap into football culture.

Here are four audiences that you can target this post season:

  1. Imported Light Beer Enthusiasts
  2. Domestic/Imported Beer
  3. High-end Spirit Drinkers
  4. Discretionary spend: Alcohol and wine $331 – $726

These audiences can help you serve up campaigns that pour directly into the heart of football fandom.

TV viewers

TV viewers

Football games attract some of the most engaged and diverse TV audiences, with 85% of sports fans preferring to watch live sports on TV rather than in-person. Notably, for the first time, viewers aged 18 to 49 spent the majority of their sports viewing time (54%) via streaming. This shift highlights the immense opportunity for advertisers to connect with highly attentive viewers tuned into every play.

Here are seven audiences that you can use to create a game-winning strategy to reach engaged TV watching football fans:

  1. Cable Satellite or Streaming Network Subscribers
  2. Streaming Video: High Spenders
  3. Cord Cutters
  4. Cable and Streaming TV Service Subscribers
  5. Paid TV High Spenders
  6. Screen Size – Large
  7. Co-Watchers

Whether they’re catching the action on a large TV screen or streaming from their phone, these audiences will help you craft campaigns that deliver results with highly engaged viewers.

Score big with Experian this postseason

As some of football’s biggest games approach, it’s time to huddle up and connect with consumers who live for the thrill of the game.Whether they’re tuning in to cheer for their favorite teams, tailgating with friends, or enjoying the game-day experience from home, Experian Marketing Data provides the playbook to score big with targeting, enrichment, and activation. With Experian’s data-driven insights, you can turn every opportunity into a game-winning play!

You can activate our syndicated audiences on-the-shelf of most major platforms. For a full list of Experian’s syndicated audiences and activation destinations, download our syndicated audiences guide.

Explore our other seasonal audiences that you can activate today.

1Fair Lending Friendly” indicates data fields that Experian has made available without use of certain demographic attributes that may increase the likelihood of discriminatory practices prohibited by the Fair Housing Act (“FHA”) and Equal Credit Opportunity Act (“ECOA”). These excluded attributes include, but may not be limited to, race, color, religion, national origin, sex, marital status, age, disability, handicap, family status, ancestry, sexual orientation, unfavorable military discharge, and gender. Experian’s provision of Fair Lending Friendly indicators does not constitute legal advice or otherwise assures your compliance with the FHA, ECOA, or any other applicable laws. Clients should seek legal advice with respect to your use of data in connection with lending decisions or application and compliance with applicable laws.


Appendix

Sports enthusiasts

  • Lifestyle and Interests (Affinity) > Activities and Entertainment > NFL Enthusiasts
  • Lifestyle and Interests (Affinity) > Sports and Recreation > Sports Enthusiast
  • Mobile Location Models > Visits > NFL Stadium Visitors
  • Lifestyle and Interests (Affinity) > Sports > Football (FLA / Fair Lending Friendly)2 Travel Intent > Activities > Professional Sports Event

College sports fans

  • Mobile Location Models > Visits > University Stadium College Football Visitor
  • Lifestyle and Interests (Affinity) > Sports > College Football Bowls
  • Mobile Location Models > Visits > College Students
  • Mobile Location Models > Visits > College Sport Venues

21+ audiences

  • Lifestyle and Interests (Affinity) > Activities and Entertainment > Imported Light Beer Enthusiasts
  • Lifestyle and Interests (Affinity) > In-Market > Domestic/Imported Beer
  • Lifestyle and Interests (Affinity) > Retail > High-end Spirit Drinkers
  • Financial – Analytics IQ > Discretionary Spend > Alcohol and Wine: $331-$726

TV viewers

  • Television (TV) > Household/Family Viewing > Cable Satellite or Streaming Network Subscribers
  • Retail Shoppers: Purchase Based > Entertainment > Streaming/Video/Audio/CTV/Cable TV: Streaming Video: High Spenders
  • Television (TV) > Household/Family Viewing > Cord Cutters
  • Television (TV) > Household/Family Viewing > Cable and Streaming Service Subscribers
  • Television (TV) > TV Enthusiasts > Paid TV High Spenders
  • Television (TV) > Viewing Device Type > Screen Size – Large
  • Television (TV) > Household/Family Viewing > Co-Watchers

Latest posts

Loading…
The Marketing Bowl: Packers vs. Steelers

Two storied franchises will collide in this year’s Super Bowl, the Green Bay Packers and the Pittsburgh Steelers. Sports fans from both markets are huge supporters of their football teams, but a look into their behavior and attitudes reveals passions beyond a one-dimensional Cheesehead or Towel Twirler. Considering the vast preferences, marketers recognize the need to define characteristics that truly distinguish their target audience. To provide those insights, we conducted a detailed market analysis using a wide variety of data sources including research information from Experian Simmons, Hitwise, and the Mosaic Consumer Lifestyle segmentation solution, which defines the predominant household types for each area (as featured in yesterday’s post: Cheeseheads vs. Terrible Towels). Today, we delve further into the hearts and houses of Green Bay and Pittsburgh area residents. GREEN BAY FANS PACK THEM IN FOR TAILGATING Green Bay area residents are more passionate about tailgating compared to their rivals in Pittsburgh. Among those who identify themselves as NFL football fans, Green Bay fans are 1.45 times more likely than Pittsburgh fans to have participated in a tailgate party within the past 12 months. They are also better equipped to tailgate due to a higher ownership rate for midsize SUVs, and both light duty and full size pickups (Road & Track magazine top-rated picks for tailgating), compared to Pittsburgh fans. STELLA AND STEELERS GO TOGETHER With every tailgate comes a beverage of choice, and in today’s analysis we’ve found that Bud Light and Budweiser are the light/low calorie and regular domestic brands of beer favored the most by both Green Bay and Pittsburgh fans. However, Pittsburgh fans are 1.56 times more likely than Green Bay fans to down a few of premium brand, Stella Artois. Notably, along with its best selling brands, Anheuser-Busch plans to devote a portion of its multi-million dollar ad spend to this Belgian import. FANTASIZING ABOUT FOOTBALL While all that tailgating is going on, Green Bay fans might also be boasting about their latest fantasy sports selections. They are 1.34 times more likely to say that they participate in a fantasy sports league compared to Pittsburgh fans. That’s not to say that Pittsburgh fans don’t enjoy their fantasy sports, indexing above the national average for visiting fantasy sports and football websites. PLAYING IN THE GREAT OUTDOORS Packers and Steelers fans enjoy being out in the elements, so chances are you’ll probably never see a dome over either Lambeau or Heinz Field. The most popular Green Bay football fan activities, with a higher participation rate compared to Pittsburgh fans, are: golfing, camping, state fairs, hunting, power boating and motorcycling. In the Pittsburgh area, with its impressive network of recreational trails, residents are 1.23 times more likely to in-line/roller skate and are 1.36 times more likely to play hockey, compared to Green Bay. Off land analysis shows that despite Green Bay residents’ close proximity to Lake Michigan and a multitude of water sport opportunities, Pittsburgh fans are more likely to spend time on the water, namely: canoeing, kayaking, sailing, and fly fishing. THROWING DEEP VERSUS HANDING OFF Each year Super Bowl advertisers try to reach their audiences across broadly defined demographics with little ability to measure the direct impact of their super-sized investments. It’s the equivalent of throwing a “Hail Mary” and hoping the receiver will leap above the clutter of defenders and catch the ball. Direct marketers, however, are using the behavioral and attitudinal data we’ve shared here to deliver their messages to a precisely targeted sub-audience. For marketers who want to be relevant and target accurately, this capability is the playmaker that scores a game winning touchdown every time. Click here for the full article Blog post author: Bill Schneider, VP, Experian Marketing Services. We’d love to hear your stories and how you’ve used lifestyle data. Please leave your comments or feedback below.

Feb 03,2011 by

Americans Spend 2 Hours, 12 Minutes Per Month on Twitter.com

According to weekly trend data from Experian Simmons DataStreamSM, the number of U.S. adults paying a monthly visit to microblogging site Twitter.com has fallen during the past year by 14%. As of November 29, 2010, 8.25 million adults had made at least one visit to Twitter.com during the previous 30 days, down from 9.54 million adults who had visited the site in the 30 days prior to November 30, 2009. Does this mean the ultimate “fail whale” is lurking just over the horizon for Twitter? Not just yet. Among those who visit Twitter.com, Simmons DataStream shows that the average number of visits per month rose a relative 37% in the last year. Twitter.com visits in late November 2010, in fact, reached an average of 10.0 visits per month, up from just 7.3 visits per month the year prior. As visit frequency increased, however, the duration of the average Twitter.com session declined, suggesting visitors today are seeking more frequent quick hits, rather than spending longer periods of time reading through posts. According to Experian Hitwise, the average amount of time Twitter.com visitors spend on the site during a typical session fell to 13 minutes, 12 seconds on November 27, 2010, down from an average of 15 minutes, 12 seconds spent on the site each session on November 28, 2009. That said, Americans are still spending more time on Twitter.com than ever before. According to Experian Simmons estimates, Americans spent an estimated 2 hours and 12 minutes tweeting and reading tweets on Twitter.com in November 2010, up from 1 hour and 51 minutes spent on the site during November 2009. Swim on, fail whale, swim on. To tweet this blog post, click on the green “retweet” button at the top of this item. For more information on Simmons DataStream weekly reporting of nearly 40,000 consumer variables, visit our website.

Jan 25,2011 by

The Top Drinking Cities in the U.S.

As we ring in the New Year this week, Americans will be tossing back a few adult beverages in celebration. While alcohol consumption certainly increases around holidays and other times of celebration, many Americans imbibe year-round. So where across this great land of ours are you most likely to find adults willing and able to raise a glass (or two) and where are you most likely to be surrounded by teetotalers? Experian Simmons has the answer. Leveraging data from our SimmonsLOCAL study, we examined the drinking patterns of adults of legal drinking age in the 106 Designated Market Areas (DMAs) with populations of at least 500,000 adults age 21 and older.  We then ranked those markets by the number of alcoholic beverages consumed by the average adult during a typical month. The chart below lists the DMAs that consume the most alcoholic beverages per capita in a typical month. First place goes to Boston, where the average adult of legal drinking age regularly kicks back 14.4 drinks a month. (Celebrations in Beantown are probably already underway.) Rank DMA Average drinks per month 1 Boston 14.4 2 Austin 13.8 3 Providence-New Bedford 13.4 4 Madison 13.2 4 Hartford & New Haven 13.2 6 Philadelphia 13.1 7 Chicago 13 8 Denver 12.9 9 Tallahassee-Thomasville 12.8 9 Milwaukee 12.8 11 Minneapolis-St. Paul 12.6 11 West Palm Beach-Ft. Pierce 12.6 11 Seattle-Tacoma 12.6 11 Tucson (Sierra Vista) 12.6 15 Green Bay-Appleton 12.5 16 San Diego 12.4 16 Baltimore 12.4 16 Washington, DC 12.4 16 Albany-Schenectady-Troy 12.4 20 New Orleans 12.3 20 St. Louis 12.3 20 Colorado Springs-Pueblo 12.3 23 Burlington-Plattsburgh 12.2 23 Syracuse 12.2 23 Norfolk-Portsmouth-Newport News 12.2 23 Spokane 12.2 23 Portland-Auburn 12.2 Source: Experian Simmons Adult residents of the markets listed below surely know how to have a good time-it's just unlikely to include a cocktail. The chart below lists the DMAs that consume the fewest alcoholic beverages per capita in a typical month. Residents of Chattanooga consume only 6 alcoholic beverages per month, on average, making it the least imbibing market-and probably the one that feels the best the morning after a big gathering. Rank DMA Average drinks per month 106 Chattanooga 6 105 Salt Lake City 7.2 105 Florence-Myrtle Beach 7.2 105 Charleston-Huntington 7.2 105 Tri-Cities, TN-VA 7.2 101 Knoxville 7.4 100 Lexington 7.9 99 Birmingham 8 98 Huntsville-Decatur 8.5 97 Nashville 8.9 97 Evansville 8.9 95 Paducah-Cape Girardeau-Harrisburg-Mt Vernon 9.1 94 Springfield, MO 9.2 94 Tulsa 9.2 94 Greenville-New Bern-Washington 9.2 91 Memphis 9.3 90 Greenville-Spartanburg-Asheville-Anderson 9.4 90 Jackson, MS 9.4 90 Wichita-Hutchinson Plus 9.4 86 Little Rock-Pine Bluff 9.5 86 Louisville 9.5 86 Ft. Smith-Fayetteville-Springdale-Rogers 9.5 83 Fresno-Visalia 9.6 82 Greensboro-High Point-Winston Salem 9.7 82 Roanoke-Lynchburg 9.7 Source: Experian Simmons For more information on SimmonsLOCAL's vivid reporting of consumer behaviors, attitudes, lifestyles and media consumption in 209 Designated Market Areas down to the ZIP code level, visit our website.

Dec 29,2010 by

Subscribe to our newsletter

Enter your name and email for the latest updates

This site is protected by reCAPTCHA and the Google Privacy Policy and Terms of Service apply.

About Experian Marketing Services

At Experian Marketing Services, we use data and insights to help brands have more meaningful interactions with people. As leaders in the evolution of the advertising landscape, Experian Marketing Services can help you identify your customers and the right potential customers, uncover the most appropriate communication channels, develop messages that resonate, and measure the effectiveness of marketing activities and campaigns.

Visit our website

Subscribe to our newsletter

Stay up to date on the latest industry news and receive expert tips from our marketing experts.
Subscribe now!