The stakes are high when it comes to advertising during football’s biggest games as the cost of advertising continues to rise, with the average 30-second TV ad during the 2023-24 Sunday Night Football season priced at $882K. With record viewership at the College Football Playoff and the Super Bowl drawing in 123.7 million average viewers, the largest TV audience on record, it’s no surprise that brands are willing to pay those prices since football games are prime time for reaching engaged audiences. In fact, an estimated 51% of viewers search for an ad they saw during the game, underscoring the potential of second-screen engagement to amplify campaign impact. Whether you advertise on TV during these games or not, brands are exploring how they can use football season to drive a deeper connection to their audience. To do this, brands need data driven strategies.
In this blog post, we’ll reveal audience segments designed for you to craft tailored marketing strategies that resonate with football fans in the stands and on the couch. You can find the complete audience segment name in the appendix.
Make a game-winning play with Experian Audiences
With playoff season fast approaching, it’s the perfect time to go on the offensive and target football fans. Utilize Experian’s syndicated audiences to ensure your marketing messages resonate with fans when they’re the most engaged.
- Experian’s 2,400+ syndicated audiences are available directly on over 30 leading television, social, and programmatic advertising platforms.
- Reach consumers based on who they are, where they live, and what they do using data ranked #1 in accuracy by Truthset.
- Run omnichannel campaigns based on a reliable understanding of households, people, digital identifiers, and marketing attributes.
Four football audience categories to add to your advertising lineup
Football fans come in all shapes, sizes, and viewing habits. From dedicated supporters to casual viewers, targeting the right audience can make or break your campaign.
Here are four football audience categories you can target:
- Sports enthusiasts
- College football fans
- 21+ audiences
- TV viewers
Let’s huddle up and break down the audience segments within each category. Whether it’s tailgating, tuning in, or cheering from the stands, these insights will get your campaign into the end zone.
Sports enthusiasts
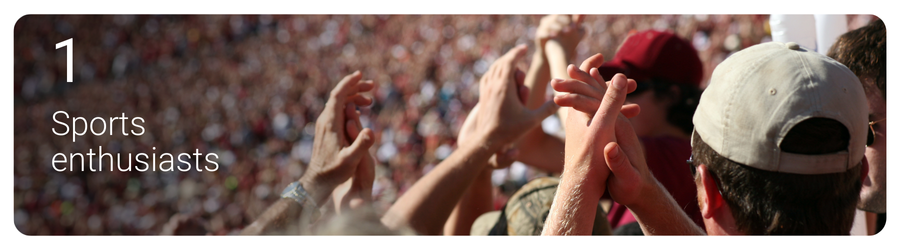
Whether they’re following their favorite teams, attending games in person, or watching professional sports events on TV, football fans are deeply engaged, making them an ideal target for advertisers looking to score big.
Here are five audiences to target:
- NFL Enthusiasts
- Football (FLA/Fair Lending Friendly)1
- Sports Enthusiasts
- NFL Stadium Visitors
- Professionals Sports Event
College football fans
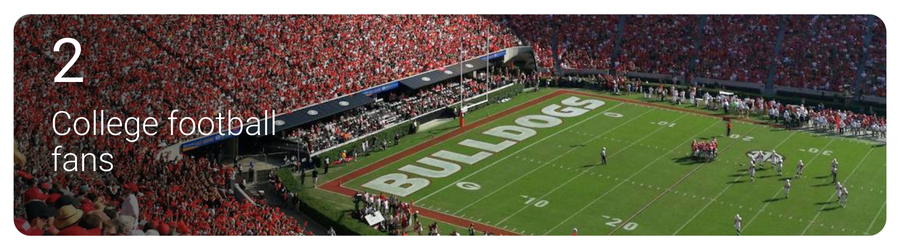
College football fans bring unmatched passion and loyalty, with bowl games during the 2023 season drawing on average of 4.6 million viewers across 40 total games—a 5% increase year-over-year. From students to alumni, these fans represent an invaluable opportunity for advertisers to connect with a deeply invested audience.
Here are four audiences to target to connect with passionate college football fans:
- College Football Stadium Visitors
- College Football Bowls
- College Students
- College Sports Venues
21+ audiences
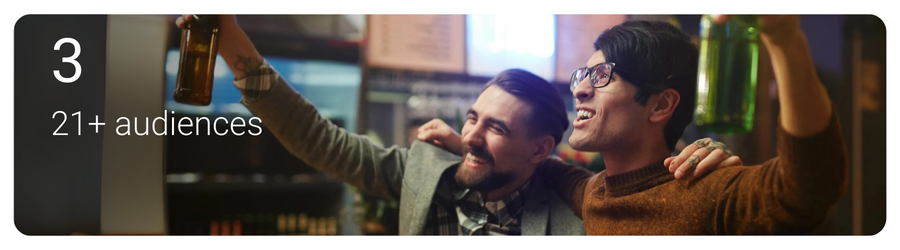
With 84% of U.S adults reporting that they drink alcohol while watching football on TV, targeting 21+ audiences during game season is a winning play. Whether they’re cracking open a cold one at a tailgate, hosting a game-day party, or relaxing on the couch, these audiences represent a key audience for brands looking to tap into football culture.
Here are four audiences that you can target this post season:
- Imported Light Beer Enthusiasts
- Domestic/Imported Beer
- High-end Spirit Drinkers
- Discretionary spend: Alcohol and wine $331 – $726
These audiences can help you serve up campaigns that pour directly into the heart of football fandom.
TV viewers

Football games attract some of the most engaged and diverse TV audiences, with 85% of sports fans preferring to watch live sports on TV rather than in-person. Notably, for the first time, viewers aged 18 to 49 spent the majority of their sports viewing time (54%) via streaming. This shift highlights the immense opportunity for advertisers to connect with highly attentive viewers tuned into every play.
Here are seven audiences that you can use to create a game-winning strategy to reach engaged TV watching football fans:
- Cable Satellite or Streaming Network Subscribers
- Streaming Video: High Spenders
- Cord Cutters
- Cable and Streaming TV Service Subscribers
- Paid TV High Spenders
- Screen Size – Large
- Co-Watchers
Whether they’re catching the action on a large TV screen or streaming from their phone, these audiences will help you craft campaigns that deliver results with highly engaged viewers.
Score big with Experian this postseason
As some of football’s biggest games approach, it’s time to huddle up and connect with consumers who live for the thrill of the game.Whether they’re tuning in to cheer for their favorite teams, tailgating with friends, or enjoying the game-day experience from home, Experian Marketing Data provides the playbook to score big with targeting, enrichment, and activation. With Experian’s data-driven insights, you can turn every opportunity into a game-winning play!
You can activate our syndicated audiences on-the-shelf of most major platforms. For a full list of Experian’s syndicated audiences and activation destinations, download our syndicated audiences guide.
Explore our other seasonal audiences that you can activate today.
1 “Fair Lending Friendly” indicates data fields that Experian has made available without use of certain demographic attributes that may increase the likelihood of discriminatory practices prohibited by the Fair Housing Act (“FHA”) and Equal Credit Opportunity Act (“ECOA”). These excluded attributes include, but may not be limited to, race, color, religion, national origin, sex, marital status, age, disability, handicap, family status, ancestry, sexual orientation, unfavorable military discharge, and gender. Experian’s provision of Fair Lending Friendly indicators does not constitute legal advice or otherwise assures your compliance with the FHA, ECOA, or any other applicable laws. Clients should seek legal advice with respect to your use of data in connection with lending decisions or application and compliance with applicable laws.
Appendix
Sports enthusiasts
- Lifestyle and Interests (Affinity) > Activities and Entertainment > NFL Enthusiasts
- Lifestyle and Interests (Affinity) > Sports and Recreation > Sports Enthusiast
- Mobile Location Models > Visits > NFL Stadium Visitors
- Lifestyle and Interests (Affinity) > Sports > Football (FLA / Fair Lending Friendly)2 Travel Intent > Activities > Professional Sports Event
College sports fans
- Mobile Location Models > Visits > University Stadium College Football Visitor
- Lifestyle and Interests (Affinity) > Sports > College Football Bowls
- Mobile Location Models > Visits > College Students
- Mobile Location Models > Visits > College Sport Venues
21+ audiences
- Lifestyle and Interests (Affinity) > Activities and Entertainment > Imported Light Beer Enthusiasts
- Lifestyle and Interests (Affinity) > In-Market > Domestic/Imported Beer
- Lifestyle and Interests (Affinity) > Retail > High-end Spirit Drinkers
- Financial – Analytics IQ > Discretionary Spend > Alcohol and Wine: $331-$726
TV viewers
- Television (TV) > Household/Family Viewing > Cable Satellite or Streaming Network Subscribers
- Retail Shoppers: Purchase Based > Entertainment > Streaming/Video/Audio/CTV/Cable TV: Streaming Video: High Spenders
- Television (TV) > Household/Family Viewing > Cord Cutters
- Television (TV) > Household/Family Viewing > Cable and Streaming Service Subscribers
- Television (TV) > TV Enthusiasts > Paid TV High Spenders
- Television (TV) > Viewing Device Type > Screen Size – Large
- Television (TV) > Household/Family Viewing > Co-Watchers
Latest posts

The Simmons Multi-Media Engagement Study is a unique syndicated research program that measures – across multiple dimensions – the relationship between media vehicles and their audiences. This strategic tool provides measures of the cognitive and emotional engagement consumers have with major media properties, which includes broadcast, cable, and syndicated television, major magazines, and Internet sites. The Fall 2009 release of the Simmons Multi-Media Engagement Study utilizes a patented behavioral integration model to map the engagement levels of nearly 800 media vehicle users back to the respondents in the Experian Simmons National Consumer Study, allowing the analysis of media engagement to be filtered by consumer behaviors including users of over 8,000 brands in over 460 product categories. The following slides will demonstrate some powerful examples leveraging the Spring 2009 MME study. Among all U.S. adults, Consumer Reports magazine is the most Trustworthy media vehicle. In fact, 6 of the top 10 Trustworthy media vehicles are print magazines. The other top vehicles include 3 websites and 1 cable television network. When broken down by gender, there are 4 vehicles that remain consistent across the gender breaks, although their rank orders do change. Among media properties that index at 110 or higher for new car intenders*, we can determine which are best for communicating a message of trust. Below are the top vehicles ranked by the percent of new car intenders saying “I trust this to tell the truth.” When ranking print magazines by Ad Attention/Receptivity – the dimension that measures how likely consumers are to notice and pay attention to ads as well as buy advertised products – we find that the top of the list is dominated by niche publications, whose audiences are focused and whose ads are typically targeted. In a similar vein, those magazines that focus on a mass-market audience tend to have the lowest Ad Attention/Receptivity scores. Looking at the statement, “I get valuable information from the ads in this magazine,” we can see some interesting differences between consumers by region. For instance, while American Baby is tops in 3 of the 4 census regions, it is fourth in the Midwest. Smart Money magazine makes the list only in the Northeast and House Beautiful only in the West. Likewise, Family Handyman appears in both the Midwest and South, but not in the Northeast or West. Among print magazines that index at 110 or higher for readers planning to retire in the next year, we can determine which magazines would be ideal for placing ads promoting plans and hobbies for their future free time. The following magazines rank top for future retirees who say “This magazine has ads for things I care about.” The Personal Time Out dimension helps identify vehicles that people like to relax with and to spend their free time using. While there are similarities across users of all ages, these top websites for each age group show that younger users prefer social media and entertainment-oriented sites, while more mature users lean towards lifestyle sites when they just want to kick back. Of the Facebook.com users who say, “I like to kick back and wind down with Facebook.com,” we can look at what retailers they are most likely to shop compared to other online adults. Facebook.com users who like to kick back and wind down on the site are 172% more likely to shop at Express and 130% more likely to shop at Victoria’s Secret or Banana Republic. Should these retailers advertise on Facebook, they could benefit by including messages of escape and time-out. When it comes to word of mouth, synergy is a powerful tool. While 69% of all viewers of The Oprah Winfrey Show say, “This program gives me something to talk about,” this number increases to 81% among those viewers who either read O, The Oprah Magazine or visit Oprah.com. Incredibly, when looking at Oprah viewers who visit her website and also read her magazine, fully 96% say The Oprah Winfrey Show gives them something to talk about, an increase of 39% over all program viewers.
African Americans represent 11% of the U.S. adult population and, as a group, constitute the nation’s largest racial minority market. African Americans are also more optimistic about their financial situation than the general population, and with good reason. According to the Selig Center for Economic Growth, African American buying power reached $913 billion in 2008, up from $590 billion in 2000. By 2013, African American buying power will reach an astonishing $1.2 trillion, meaning that almost nine cents out of every dollar spent in the United States will come from African American consumers. In celebration of Black History Month, Experian Simmons examines the attitudes, behaviors and media consumption of our country’s African American consumers using data from Simmons DataStreamSM, the Simmons National Consumer Study, New Media Study, Multi-Media Engagement Study and Experian MicromarketerG3 as well as findings from our friends at Experian Hitwise. When it comes to attitudes towards personal financial outlook, African Americans are more likely than the average American adult to say that in the next 12 months they will be better off financially. As of December 28th, 2009, 36% of African Americans said they would be better off financially in the next 12 months, compared with 31% of all adults who felt the same. African Americans are trend setters. Below are the top indexing statements on apparel, auto, food and social interaction among African American adults compared to the total adult population. Index relative to total adult population in parentheses. House Beautiful magazine is a great publication for reaching African Americans who respond to print ads. Readers of House Beautiful, for instance, are 37% more likely to be African American and House Beautiful scores 83% higher than the average magazine among African American readers who say they are likely to buy product or services advertised in the magazine. Where in the United States is the best place to find African American consumers with household incomes of $100,000 or more? Hinesville-Fort Stewart, Georgia is tops followed by Fresno and Stockton, California. African American consumers are more likely than the average online adult to use a wide range of emerging technologies and media. For instance, online African American consumers are 20% more likely than average to watch movies online, 19% more likely to listen to Internet radio and 18% more likely to use social tags or bookmarks. Below are the top sites ranked by the percentage of visits coming from the top African American Mosaic lifestyle segments. The list is dominated by social networking sites.
Coffee drinkers in America Coffee plays such an integral part of every day life in America that it may be safe to say that coffee helps the United States go round. In fact, fully 60% of all U.S. households use either whole or ground coffee beans at home. Experian Simmons extensively reviewed the American coffee drinker for this report which features detailed insights into the coffee-drinking American. In addition, we compare the patrons of Dunkin’ Donuts and Starbucks, the leading players in the battle for brew. Coffee in the Home The average U.S. household that uses whole or ground coffee consumes 4.2 cups per day. In total that’s about 280.5 million cups of coffee consumed at home by Americans each day or about 102 billion cups per year. Among households that use coffee, 89% stock regular coffee and 46% stock decaf.* Among households that use coffee, 84% use pre-ground coffee and 26% use whole bean coffee at least some of the time.* Instant Flavored Coffee Over a quarter of households (27%) stock instant coffee. Sixteen percent of households use instant flavored coffee. The most commonly used flavors among instant flavored coffee drinkers are: Older Americans More Likely to Drink Coffee Fifty-seven percent of adults ages 18-24 live in households that use coffee, but 25 to 34 year olds are the least likely to stock coffee in their cupboards with only 54% reporting they use whole or ground bean coffee at home. Coffee Use Increases with Household Income Seventy percent of Americans who report annual household incomes of $150,000+ drink coffee compared with 54% of those with household income less than $25,000. Dunkin' Donuts Vs. Starbucks Dunkin' Donuts 11% of American adults go to DD Between 9.15.08 and 9.15.09 the share of DD customers who go there 6+ times a month is up 11%* DD consumers are 41% more likely than the average adult to be registered Independents and 9% less likely to be registered Republicans Starbucks 13% of American adults go to Starbucks Between 9.15.08 and 9.15.09 the share of Starbucks customers who go there 6+ times a month is down 22% Starbucks consumers are 11% more likely to be registered Independents and 11% more likely to be registered Republicans Coffee Drinkers Are Coffee Drinkers A majority of coffee-drinking Americans are loyal to their franchise. However, there are a considerable number of Dunkin’ Donuts and Starbucks consumers who jump between coffee houses. How Often Americans Order Their Coffee The majority of both Dunkin’ Donuts and Starbucks customers visit each chain between one and five times in a typical month. Learn more about Simmons consumer research and studies.