
This holiday shopping season, marketers will look to take advantage of the surge in spending across channels like connected TV (CTV), programmatic, and mobile. Despite challenges such as privacy regulations and Google’s new cookie deprecation plan, this moment presents a unique opportunity for marketers to reshape their traditional approaches to consumer engagement and capitalize on these changes.
As we approach the holiday season, understanding how consumers spend, where they shop, and how their shopping habits are changing are key components to consider when crafting your holiday advertising campaigns. Our 2024 Holiday spending trends and insights report utilizes our expertise in data and insights to highlight emerging consumer behaviors and spending patterns. In our report, we share what these trends mean for marketers and how Experian can help, so you can refine your messaging and target the right audience through the best channels.
In this blog post, we cover three insights from our report. Watch our video for a recap below.
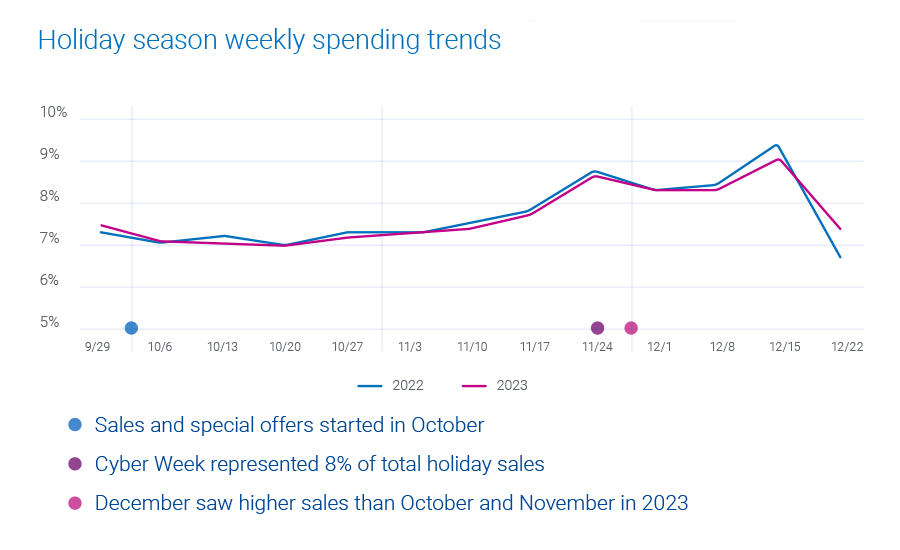
1. Consumers are shopping evenly throughout the holiday season
35% of holiday shopping was done in December, peaking at 9% of total holiday sales the week before Christmas. Cyber Week, the five-day period between Thanksgiving and Cyber Monday, and the week before Christmas brought the highest weekly sales for the past two holiday seasons.
What this means for marketers
Prepare for an extended promotional period. Schedule your marketing campaigns and sales initiatives to maximize impact during the extended season, focusing on the peaks of Cyber Week and the week before Christmas.
How Experian can help you target these shoppers
Experian’s data, ranked #1 in accuracy by Truthset, offers advertisers the ability to reach people based on demographic, geographic, and behavioral attributes (e.g. websites visited and purchase history). Our audiences are available on-the-shelf of most major platforms, making it easy for you to activate and target holiday shoppers.
We recently released 19 new holiday-focused audience segments. Here are a few you can activate:
- Black Friday Shoppers
- Cyber Monday Shoppers
- Big Box/Club Store Shoppers
- Luxury Gift Shoppers
- Discount Holiday Shoppers
- Holiday Airline Travel
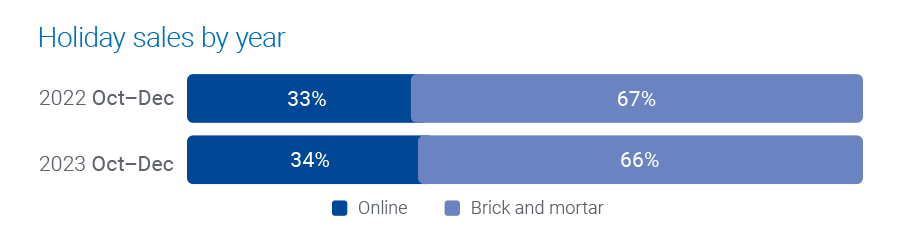
2. Online shopping is leveling out
Online holiday spending continues to remain around a third of all holiday shopping spending.
We are starting to see online shopping slow and level out – people are going back in-store. The high amount of online shopping we saw during the pandemic is starting to return to pre-pandemic behaviors.
Consumers are spending more in-store at department and discount stores but are shopping online for office/electronics/games, mass retailers, and apparel.
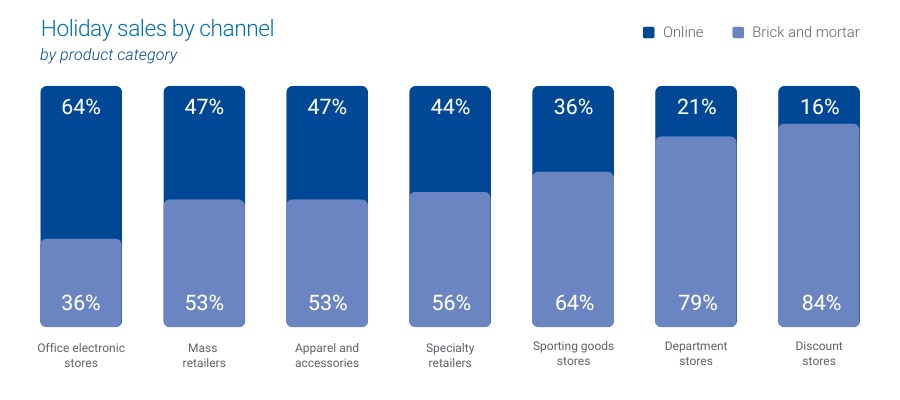
- 84% of holiday shopping was done in-store for discount stores.
- 79% of holiday shopping was done in-store for department stores.
- 64% of holiday shopping was done online for office, electronics, and games stores.
What this means for marketers
Digital and physical experiences work together. Retailers should have a multi-channel plan to reach consumers, tailoring their approach to their target audience and product and creating engaging in-store experiences to drive visitors.
How Experian can help you target and measure across channels
We connect online and offline data to enable precise targeting and measurement of marketing efforts across multiple channels. Read our case study with Cuebiq to learn how they used our Activity Feed solution to deliver in-store lift analyses to their clients.
3. CTV is the top channel to reach consumers
Over two-thirds of the U.S. population now use CTV, and the average time spent among adults is expected to surpass two hours per day in 2024. CTV offers a creative ad experience similar to its linear counterpart but provides more sophisticated targeting and analytics capabilities.
What this means for marketers
As CTV viewing continues to dominate, the importance of cross-device targeting and measurement increases.
How Experian can help you reach shoppers across devices
Later this year, we’ll add support for IPv6 in our Digital Graph as well as phone-based UID2s. This is in addition to our current coverage of IPv4 and email-based UID2s. As a result, all IP signals and UID2s will be resolved back to Experian’s household and individual profiles and their associated devices, which means marketers and platforms can better understand the full customer journey and reach people across their devices.
Download our 2024 Holiday spending trends and insights report
This holiday season is about more than just transactions – it’s about cultivating meaningful connections with your audience. Download our 2024 Holiday spending trends and insights report to access all of our predictions for this year’s holiday season.
When you work with Experian for your holiday shopping campaigns, you’re getting:
- Accurate consumer insights: Better understand your customers’ behavioral and demographic attributes with our #1 ranked data covering the full U.S. population.
- Signal-agnostic identity solutions: Our deep understanding of people in the offline and digital worlds provides you a persistent linkage of personally identifiable information (PII) data and digital IDs, ensuring you accurate cross-device targeting, addressability and measurement.
- Secure connectivity: Bring data and identity to life in a way that meets your needs by securely sharing data between partners, utilizing the integrations we have across the ecosystem, and using our marketing data in flexible ways.
Make the most of this holiday shopping season with Experian. Contact us today to get started.
Latest posts

As partnership deals mount, aggressive hiring underway for unified cross-screen technology leaders NEW YORK, July 19, 2016 /PRNewswire/ — Tapad, the leader in cross-device marketing technology and now a part of Experian, has announced plans for aggressive expansion in the Asia Pacific (APAC) region. This move capitalizes on Tapad's exceptional performance for brands and marketing technology companies in North America and Europe. With it's proprietary Tapad Device Graph™, the company will enable global, regional and local clients and partners to understand, monetize and measure marketing to users across screens. The Tapad Device Graph is recognized as the most accurate, scalable cross-screen solution in the market today. The decision to expand into APAC was based on increased demand from global, as well as local, brands and clients, many of which have a strong market presence throughout the region. In addition to expanding its roster of world-class data partners, plans include building a world-class team in Singapore. Over the next few months, Tapad APAC will also establish local entities in additional markets. To accelerate its ramp-up, Tapad APAC is actively recruiting in many areas, ranging from skilled and experienced solutions engineers to seasoned sales and marketing professionals. "Tapad is thrilled to be answering the call for cross-device excellence in APAC," said Pierre Martensson, GM of Tapad APAC. "Our Device Graph is adding millions of devices daily and achieves unmatched levels of scale and accuracy while protecting consumer privacy. This meets a critical need in the region." Tapad appointed Martensson as General Manager of Tapad APAC in May, kicking off expansion in the region. Martensson comes to Tapad with nearly a decade of operations experience throughout APAC, having transformed, developed and grown global organizations. To learn more about partnership and employment opportunities available with Tapad in APAC, visit www.experian.com/careers. Contact us today!
Combined technology gives marketers an enhanced view of the customer for improved planning, targeting and optimization NEW YORK, July 12, 2016/PR Newswire/ - Tapad, the leader in cross-device marketing technology and now a part of Experian, today announced a partnership with Conversion Logic, the martech industry's most accurate unified marketing attribution provider. Conversion Logic will incorporate unified cross-screen data from Tapad's Device Graph™ to identify related devices and media exposures to enhance reporting on the path to conversion. By connecting Conversion Logic's proprietary Ensemble Method, which combines numerous state-of-the-art machine learning algorithms, tuned for each customer use-case for the most accurate results, with Tapad's unified, cross-device technology, marketers will benefit from a highly scientific approach to assessing advertising effectiveness with full, comprehensive customer insights. Linking these technologies will increase marketers' real-time ability to optimize brands' marketing channel spend and creative at a more granular level. During the past six months, Tapad has rapidly grown its data business, doubling the number of companies integrating the Device Graph™ into their platforms and growing the annualized revenue run rate by 210%. Tapad's highly scalable, cross-device data has been confirmed by Nielsen to be very precise. Tapad augments platforms' and publishers' tech stacks with additional scale and relevancy, granting advertisers amplified targeting and analysis options. The growth of the Device GraphTM has allowed Tapad to provide a growing network that benefits all partners with more efficient, effective consumer engagement. "Combining highly accurate data from Tapad with our own user ID technology and understanding how devices may be related at an individual level provides additional visibility into the path to conversion," said Alison Lohse, COO and co-founder of Conversion Logic. "The more we know about the customer journey, the more effective, efficient and customized marketers can be with marketing efforts. With Tapad, we have achieved a unified customer view that helps us piece together the purchase journey while preserving proven accuracy." "Conversion Logic's Ensemble Method delivers singularly customized and precise results that are not just accurate, but actionable," said Dave Fall, COO of Tapad. "The combination of powerful technology and a user-friendly interface, plus Tapad's ability to only consider relevant and scalable components in the marketplace, creates a more concentrated and beneficial environment for both its partners and clients." Contact us today!
B2B marketers can now deliver the right message to the right user at the right time across devices and channels NEW YORK, NY–(Marketwired – Jun 1, 2016) – Madison Logic, one of the world's fastest growing companies dedicated to solving the digital needs of B2B marketers, is partnering with Tapad, the leading provider of unified and now a part of Experian, cross-screen marketing technology solutions. Now business-to-business (B2B) marketers can power targeted advertising and content syndication programs across all channels, including smartphones, computers and tablets. The increasing shift in content consumption across mobile devices makes cross-device identification and attribution a top priority for B2B marketers. The Madison Logic and Tapad partnership gives B2B marketers unprecedented reach and scale with the ability to run always-on, cross-device, account-based marketing programs targeting decision makers who are actively researching similar products and services. "Screens are everywhere and so is the B2B buyer," said Vin Turk, SVP of Audience Development for Madison Logic. "This partnership allows marketers to harness the power of Madison Logic's intent data and combine it with Tapad's cross-device solutions to connect with the most-likely-to-convert prospects with hyper-relevant content wherever and whenever they're doing their research." "Relevance is essential to the success of B2B marketers, particularly now, when breaking through the clutter is difficult," said Dave Fall, COO of Tapad. "This partnership with Madison Logic allows marketers to leverage their existing customers while identifying and reaching new audiences with messaging tailored to every device." For more information about Madison Logic's account-based marketing platform, please visit https://www.madisonlogic.com/account-based-marketing/. For more information about Tapad's cross-platform advertising solutions, please visit https://www.experian.com/marketing/consumer-sync. Contact us today!