
At Experian, we understand the critical role that audience targeting plays in the success of marketing campaigns. That’s why we’re excited to share this curated list, aimed at helping agencies and media buyers plan their campaigns and effectively reach their audiences with precision and confidence.
Here’s a look at the Experian audiences that were the most popular in Q2 2023. Which ones will you add to your Q2 campaign planning?
Our top 10 audiences for Q2
Fitness enthusiast
Lifestyle and Interests (Affinity) > Health & Fitness > Fitness Enthusiast
In-store high spender on baby products
Retail Shoppers: Purchase Based > Shopping Behavior > Baby Products: In Store High Spenders
Has a bachelor’s degree
Demographics > Education > Bachelor Degree
In-market for an SUV and CUV
Autos, Cars and Trucks > In Market-Body Styles > SUV and CUV
In-market for a mid-size truck
Autos, Cars and Trucks > In Market-Body Styles > Mid-Size Truck
Homeowner
Demographics > Homeowners/Renters > Homeowner
In-market for a small, mid-size SUV
Autos, Cars and Trucks > In Market-Body Styles > Small Mid-Size SUV
In-market for a full-size truck
Autos, Cars and Trucks > In Market-Body Styles > Full-Size Trucks
In-market for a full-size SUV
Autos, Cars and Trucks > In Market-Body Styles > Full-Size SUVs
Household income level
Demographics > Household Income (HHI) > $75,000+
Our top 5 audiences by vertical
Which audience segments were the most popular by advertiser vertical?
Advanced TV
Household income level
Demographics > Household Income (HHI) > $75,000-$99,999
Interested in dogs
Lifestyle and Interests (Affinity) > Pets > Dogs (FLA / Fair Lending Friendly)1
Homeowner
Demographics > Homeowner/Renter > Homeowner
Household income level
Demographics > Household Income (HHI) > $100,000-$124,999
Interested in arts and entertainment
Lifestyle and Interests (Affinity) > Art and Entertainment > Visual Art and Design (FLA / Fair Lending Friendly)
Agency
Dog owner
Lifestyle And Interests (Affinity) > Pets > Dog Owners
Cat owner
Lifestyle And Interests (Affinity) > Pets > Cat Owners
Active investor
Lifestyle And Interests (Affinity) > Investors > Active Investor
Mutual fund investor
Lifestyle And Interests (Affinity) > Investors > Mutual Fund Investor
In-market for a full-size SUV
Autos, Cars and Trucks > In Market-Body Styles > Full-Size SUVs
Auto
In-market for a new car
Autos, Cars and Trucks > In Market-New/Used > New Car
In-market for a used car
Autos, Cars and Trucks > In Market-New/Used > Buyer Used
In-market for a Honda
Autos, Cars And Trucks > In Market-Make And Models > Honda
In-market for an auto loan
Financial FLA Friendly > In Market Auto Loan
In-market for an auto lease
Financial FLA Friendly > In Market Auto Lease
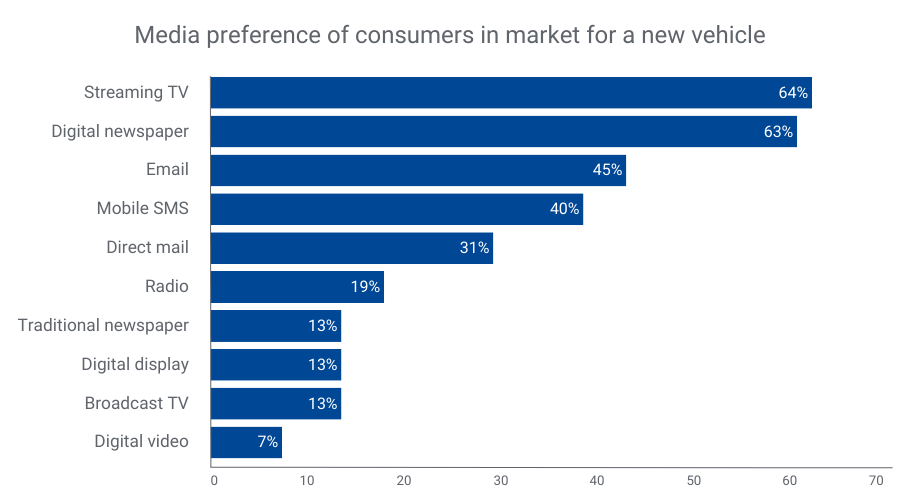
Did you know?
Consumers looking to buy a new vehicle prefer streaming TV, digital newspapers, and email for communication2. By merging our TrueTouchTM engagement channel audiences with our Auto in-market audiences, you can effectively target these consumers through their preferred channels. TrueTouch facilitates personalized advertising campaigns by predicting consumer preferences, ensuring messaging styles align with the right channels and calls to action.
By understanding what types of media people prefer, you can match the best way to talk to them with what to offer, using the right channels for personalized ads. No consumer is the same – and you need to engage with them on their terms to successfully market to them.
Financial
Active in the military
Lifestyle And Interests (Affinity) > Occupation > Military – Active
In-market for a credit union loan
Financial FLA Friendly > In Market Credit Union Loan
40-49 years old
Demographics > Ages > 40-49
30-39 years old
Demographics > Ages > 30-39
Small business owner
Consumer Behaviors > Occupation: Small Business Owners
Health
25-29 years old
Demographics > Ages > 25-29
30-34 years old
Demographics > Ages > 30-34
Weight conscious
Lifestyle and Interests (Affinity) > Health & Fitness > Weight Conscious
Moms interested in fitness
Lifestyle and Interests (Affinity) > Moms, Parents, Families > Fitness Mothers
High spenders at vitamin/supplement stores
Retail Shoppers: Purchase Based > Health and Fitness > Vitamins/Supplements: Vitamins/Supplements
Retail & CPG
Dog owners
Lifestyle And Interests (Affinity) > Pets > Dog Owners
Cat owners
Lifestyle And Interests (Affinity) > Pets > Cat Owners
Fitness enthusiast
Lifestyle and Interests (Affinity) > Health & Fitness > Fitness Enthusiast
Interested in healthy living
Lifestyle and Interests (Affinity) > Health & Fitness > Healthy Living
High spenders at vitamin/supplement stores
Retail Shoppers: Purchase Based > Health and Fitness > Vitamins/Supplements: Vitamins/Supplements
Activate the right audiences with Experian
When you choose Experian’s syndicated audiences, you gain access to over 2,400 audiences that span across 15 verticals and categories. These audiences are directly available for activation on over 30 platforms and can be sent to over 200 media platforms. Experian is ranked #1 for data accuracy (as validated by Truthset) and Experian Marketing Data is the foundation for successful targeting, enrichment, and activation.
For a full list of Experian’s syndicated audiences and activation destinations, download our syndicated audiences guide. Need a custom audience? We can help you build and activate an Experian audience on the platform of your choice.
Check out other seasonal audiences you can activate today.
Footnotes
- Fair Lending Act Friendly audiences: “Fair Lending Friendly” indicates data fields that Experian has made available without use of certain demographic attributes that may increase the likelihood of discriminatory practices prohibited by the Fair Housing Act (“FHA”) and Equal Credit Opportunity Act (“ECOA”). These excluded attributes include, but may not be limited to, race, color, religion, national origin, sex, marital status, age, disability, handicap, family status, ancestry, sexual orientation, unfavorable military discharge, and gender. Experian’s provision of Fair Lending Friendly indicators does not constitute legal advice or otherwise assure your compliance with the FHA, ECOA, or any other applicable laws. Clients should seek legal advice with respect to your use of data in connection with lending decisions or application and compliance with applicable laws.
- Experian looked at our Auto and TrueTouch audience data to understand media preference trends over the past year.
Latest posts

It’s been over a year since Google announced they’d be deprecating the third-party cookie and in that time there’s been a major focus on two types of cookieless identity solutions. Identity vendors and marketers are strategizing which of these two future solutions best fits their needs so they can achieve privacy-safe scale once third-party cookies are no longer available for use on Chrome. Let’s break down these solutions and the considerations marketers need to take into account when deciding what partners to move forward with in the future of identity resolution. Authenticated Traffic Solutions Authenticated traffic solutions (ATS) are a type of digital identification that asks the end-user to identify themselves via personal information, most commonly email address. Often, you’ll see self-authentication at the point of entry to a website that asks you to create an account or login immediately to access the content you are seeking. E-commerce sites use authentication to keep track of consumer purchases and inform advertising decisions for that customer; and publishers use it to tailor featured content, or, more importantly for this discussion, leverage it within the ad ecosystem for targeting. While authentication can provide very valuable user data for audience segmenting and targeting, it can be limited in scale for a single publisher to leverage and monetize on their own. That’s why some identity vendors have worked to integrate themselves within as many publisher authentication modules as possible, so that they can create an aggregate of scale for the ad ecosystem to tap into. But, even this isn’t going to deliver the reach marketers truly thirst for. Alternatively, Facebook has the scale for authenticated traffic, but they keep their data inside a walled garden, so the utility of those authenticated users is only valuable within the Facebook ecosystem. So how can authenticated traffic solutions increase scale to broaden the scope of identifiers they can collect and leverage? Hint: a few of the biggest players have already figured it out. It’s the single sign-on. Google is probably the largest purveyor of a single-sign on solution that can directly impact advertising capabilities. Can you think of a site you visit that doesn’t offer a sign-in with your existing Google account? It’s a short list. Google has integrated themselves into so many applications and publishers that “Login with Gmail” is just second nature (you pictured the Gmail logo when you read that, didn’t you?). Now, if you’re about to purchase something you found off an Instagram ad, or perhaps a retailer you buy from regularly, you’ve probably noticed options to proceed with your checkout via “Amazon pay” or “Apple pay”. These are also single-sign ons. You’re authenticating yourself through Amazon or Apple to that retailer in exchange for A- the safety and security that Amazon or Apple provide for your financial information and B- skipping the annoying process of manually entering personal information over and over again at point of sale. It’s starting to sound like there’s a lot of authenticated data out there isn’t it? Well, that’s true, but again, Amazon and Apple are walled gardens. Amazon is working diligently to build out their own ecosystem to leverage their content and retail channel data for a holistic offering. And Apple keeps user data very close to the chest, constantly limiting its utility for themselves and advertisers. So what is identity resolution doing about it? The Trade Desk announced their solution; Unified ID 2.0, which promises to leverage email authenticated identity for a truly scaled solution for publishers via Javascript through Prebid. By handing over UID2.0 to an independent unbiased organization like Prebid, The Trade Desk is creating instant scale and trust in their solution. Unauthenticated Traffic Solutions Unlike ATS, unauthenticated traffic solutions do not rely on a log-in to identify a user, but they also don’t rely on third-party cookies. Instead, unauthenticated solutions (UATS) leverage their existing streams of real-time data through Javascript on publisher sites or an SDK (software development kit used by apps). The type of information UATS solutions can collect via Javascript or SDK vary, but it can include IP address, user agent and device level info. But being able to read this information at the point of entry to a website does not make a quality identifier. The best unauthenticated solutions will have the ability to set or ingest this information into a unique ID through an infrastructure with incredibly fast speed that can process trillions of anonymous data signals across multiple channels and devices. And even more so, be able to interpret those signals into a profile using machine learning– all at the moment a user enters a domain. It sounds complicated because it is, but it also has a lot of potential. The identity space cannot rest solely on authenticated traffic solutions, because, as you can see, it could limit ownership and operability to just a few power players/walled gardens. This doesn’t help the larger ecosystem monetize and personalize ad inventory. The right unauthenticated solution, however, can unify cross-device individuals and households at scale, because they’re integrated on the broadest number of publishers/SDKs across platforms, have the best algorithms to build confident connections between identifiers, and are universally transactable across the most common sell and demand side platforms. Think of it as the perfect partner- speaking a common language that everyone in the ecosystem understands and acts on. Today more than twenty cookieless identifiers are available in market for the ad ecosystem, and Google hasn’t even announced a date of deprecation. It’s important to be on the lookout for differentiators like scale and precision. Most importantly, choosing a truly cross-device partner will be key, especially as more digital devices and IDs grow in adoption, like CTV has this past year. Taking advantage of both What we will come to find, once the third-party cookie is obsolete, is that choosing just one of these solution types, or partners, will be a disadvantage. The more the industry comes together to collaborate on solutions, the more apparent it is that both of them have value, and thus employing both solutions will give marketers the best opportunities. Tapad, now part of Experian, recently announced the launch of Switchboard; a module within our identity solution; The Tapad Graph, to create this agnostic interoperability for identifiers of all types, and choice and control for the ad tech vendors and marketers who want them. By instantly creating the ability to partner with multiple solutions, Tapad + Experian is ensuring that all use cases for the third-party cookie live on in our cookieless future. Get started with The Tapad Graph For personalized consultation on the value and benefits of The Tapad Graph for your business, email Sales@tapad.com today!
Tapad launches global privacy-safe solution to provide continuity in the absence of third-party cookies Switchboard, a module within The Tapad Graph, will connect emerging cookieless identifiers to traditional IDs, creating a more holistic view of the consumer and driving value exchange within the advertising ecosystem Tapad, part of Experian, a global leader in cross-device digital identity resolution, and a part of Experian, announced today the launch of Switchboard, a first-of-its-kind solution to help navigate the evolving cookieless landscape. Switchboard, a module within The Tapad Graph, will operate as a global, privacy-safe solution to provide continuity in the absence of third-party cookies by connecting new cookieless identifiers to traditional digital IDs for a comprehensive view of consumers and their digital touchpoints. Switchboard will enable interoperability across the growing number of these digital identifiers and the value exchange between publishers, content creators and consumers. Leading digital identity solutions partnering with Tapad, part of Experian at the launch of Switchboard include Unified ID 2.0, ID5, Lotame Panorama ID, BritePool, Retargetly IDx and Audigent Halo ID. Tapad, part of Experian plans to expand support to additional identity solutions on an ongoing basis. In addition to these identity solutions, early partners across the ecosystem include The Trade Desk, Amobee, Martin, ShareThis, Eyeota and Catalina. “This diverse group of launch partners and testing customers will prove that Switchboard is an important tenet for the future of identity resolution. We’re excited to be proactive in our approach to give marketers time to adapt new solutions and test their function in tandem with the third-party cookie, while continuing to give our customers flexibility and control,” said Mark Connon, General Manager of Tapad, part of Experian. “Facilitating access and usage of 1st party identifiers is crucial to help marketers prepare for the cookieless future. Thanks to Switchboard, ID5's cookieless IDs will be available to a wider audience of brands and agencies and enable them to run effective, data-driven campaigns beyond the third-party cookie,” said Mathieu Roche Co-founder & CEO of ID5. Switchboard provides value across the marketing and advertising ecosystem as the need for the ability to support multiple cookieless ID’s across ad tech increases throughout 2021. With a decade of expertise creating digital identity resolution products, Tapad, part of Experian is poised to solve this challenge through innovation and quality, privacy-safe data-driven solutions. “Interoperability is paramount for brand marketers, agencies, publishers and platforms if we want to support an open and free Internet and break free of the stranglehold of walled gardens,” said Pierre Diennet, Global Partnerships at Lotame. ”Lotame Panorama ID’s participation in Switchboard reflects our steadfast commitment to collaborating across and within the industry and providing value to all of its players.” “As advertisers continue to contemplate the future of identity, Amobee is proud to partner with Tapad, part of Experian on this next-generation solution to provide a comprehensive view of consumers,” says Bryan Everett, Senior Vice President of Global Business Development at Amobee. “With the imminent loss of cookies, advertisers must think creatively in order to respectfully engage consumers in a privacy-compliant way and Switchboard can play an important role in addressing their respective identity needs.” Tapad, part of Experian is welcoming identity solutions and Tapad Graph customer participation in Switchboard throughout 2021. Stayed tuned for more updates and information on Switchboard in the coming months. Get started with The Tapad Graph For personalized consultation on the value and benefits of The Tapad Graph for your business, email Sales@tapad.com today!
Adapt with Tapad, a part of Experian Leading browsers have made public announcements and technical deployments to reduce the digital advertising accessibility of third-party cookies for data collection, storage, and sharing due to growing privacy concerns. As a result, there has been growing momentum to find an alternative via cookieless IDs, with the intent to create a replacement that helps ensure continuity across the ecosystem. At Tapad we’ve chosen to approach the market with a solution that provides agnostic interoperability for these cookieless identifiers, so that marketers can continue to work with the identity providers of their choice while maintaining the most holistic view of consumers across digital touchpoints. Introducing switchboard Switchboard is a module within The Tapad Graph that leverages our core capabilities across machine learning and identity management to provide a connection between traditional digital identifiers and the new wave of cookieless IDs that will be utilized in the future. Customers of Tapad can take advantage of its broad ecosystem of identifiers to drive targeting and frequency capping strategies and enable detailed measurement and attribution post-deprecation of the third-party cookie. Our goal is to accelerate the adoption, scale, and utility of cookieless IDs with the release of the Switchboard module within The Tapad Graph, while maintaining an agnostic approach to the market. Switchboard for identity solutions In the evolving landscape agencies and marketers will need to invest, test, and analyze the best combination of cookieless ID partners to meet their objectives. The Switchboard module will increase the utility and value of the cookieless ID space in conjunction with other addressable IDs, by providing a layer of connectivity that will be natively missing with the deprecation of third-party cookies. Identity solutions at launch: Switchboard for graph customers For existing Tapad customers who leverage the Switchboard module in The Tapad Graph, it will provide a seamless way to facilitate interoperability while resolving identity back to a Household or Individual. By providing this translation layer, Tapad will take on the responsibility of encryption and decryption protocols where applicable, which will deliver added functionality to our customers. Tapad + Experian partners at launch: Use cases Resolve existing first-party data with new cookieless solutions through The Tapad Graph to minimize data loss Frequency cap at the Individual and Household level via Cookieless and traditional ID Reach consumers at scale across all touchpoints and IDs Build a more inclusive and holistic view of the consumer journey Run accurate and scalable measurement before and after the formal deprecation of third-party cookies in Chrome Map online data into offline activities Hear why industry leaders are adapting with Tapad + Experian As advertisers continue to contemplate the future of identity, Amobee is proud to partner with Tapad, a part of Experian, on this next-generation solution to provide a comprehensive view of consumers. With the imminent loss of cookies, advertisers must think creatively in order to respectfully engage consumers in a privacy-compliant way and Switchboard can play an important role in addressing their respective identity needs. — Bryan Everett | Senior Vice President of Global Business Development | Amobee Connecting offline and online shopper activity in a privacy-compliant way is fundamental to marketing effectiveness and determining return on ad-spend. That’s why we’re excited to be a launch partner for Tapad + Experian's Switchboard offering; it provides a unified solution for supporting the variety of proprietary and anonymous user ID standards required by advertising demand-side platforms today. — Brian Dunphy | SVP Digital Business and Strategic Partnerships | Catalina As the industry evolves, Tapad + Experian's Switchboard presents a privacy-safe solution that allows for the continued activation of data and an alternative to advertising within walled garden environments. We look forward to collaborating with Tapad and the industry as we collectively transition to support cookieless identity. — Don Lee |SVP of Global Platform Partnerships | Eyeota We are excited to participate in this proactive solution to the sunset of third-party cookies. Switchboard’s agnostic interoperability, with BritePool and other ID providers, will create high-value for marketers as they transition to the era of cookieless web advertising. — David J. Moore | CEO | BritePool Interoperability is paramount for brand marketers, agencies, publishers and platforms if we want to support an open and free Internet and break free of the stranglehold of walled gardens. Lotame Panorama ID’s participation in Switchboard reflects our steadfast commitment to collaborating across and within the industry and providing value to all of its players. — Pierre Diennet | Global Partnerships | Lotame At this pivotal moment in the industry, we are excited to be partnering with Tapad, a part of Experian on their cookieless initiative and making Retargetly IDx available into the Switchboard solution, providing global brands, platforms and publishers with a compliant, cookieless ID solution for the Latin American market; enabling them to target, reach and measure users at scale through the region. — Daniel Czaplinski | CEO and Co-Founder | Retargetly With Audigent’s Halo ID, we’re architecting a cookieless future where clients and partners have confidence in the actionability and interoperability of exclusive 1st party audiences, originated from some of the world’s leading publishers and creators. We see collaboration as being critical to a collective understanding of identity and Tapad, a part of Experian as a trusted partner with solutions such as Switchboard to support continuity for marketers’ addressability. — Drew Stein | CEO and Founder | Audigent Facilitating access and usage of 1st party identifiers is crucial to help marketers prepare for the cookieless future. Thanks to Switchboard, ID5’s cookie-less IDs will be available to a wider audience of brands and agencies and enable them to run effective, data-driven campaigns beyond the third-party cookie. — Mathieu Roche | CEO and Co-Founder | ID5 Addressing the current identity challenge requires transparency and collaboration. We are pleased to align ShareThis data with Tapad + Experian’s growing ecosystem. ShareThis data helps marketers evolve beyond the cookie to complete the picture. Tapad + Experian’s Switchboard offering will support ShareThis’s deep connections to clients and technology platforms, preserving and growing the accessibility of our data. — Michael Gorman | SVP Product and Business Development | ShareThis Get started with The Tapad Graph For personalized consultation on the value and benefits of The Tapad Graph for your business, email Sales@tapad.com today!