
At Experian, we understand the critical role that audience targeting plays in the success of marketing campaigns. That’s why we’re excited to share this curated list, aimed at helping agencies and media buyers plan their campaigns and effectively reach their audiences with precision and confidence.
Here’s a look at the Experian audiences that were the most popular in Q2 2023. Which ones will you add to your Q2 campaign planning?
Our top 10 audiences for Q2
Fitness enthusiast
Lifestyle and Interests (Affinity) > Health & Fitness > Fitness Enthusiast
In-store high spender on baby products
Retail Shoppers: Purchase Based > Shopping Behavior > Baby Products: In Store High Spenders
Has a bachelor’s degree
Demographics > Education > Bachelor Degree
In-market for an SUV and CUV
Autos, Cars and Trucks > In Market-Body Styles > SUV and CUV
In-market for a mid-size truck
Autos, Cars and Trucks > In Market-Body Styles > Mid-Size Truck
Homeowner
Demographics > Homeowners/Renters > Homeowner
In-market for a small, mid-size SUV
Autos, Cars and Trucks > In Market-Body Styles > Small Mid-Size SUV
In-market for a full-size truck
Autos, Cars and Trucks > In Market-Body Styles > Full-Size Trucks
In-market for a full-size SUV
Autos, Cars and Trucks > In Market-Body Styles > Full-Size SUVs
Household income level
Demographics > Household Income (HHI) > $75,000+
Our top 5 audiences by vertical
Which audience segments were the most popular by advertiser vertical?
Advanced TV
Household income level
Demographics > Household Income (HHI) > $75,000-$99,999
Interested in dogs
Lifestyle and Interests (Affinity) > Pets > Dogs (FLA / Fair Lending Friendly)1
Homeowner
Demographics > Homeowner/Renter > Homeowner
Household income level
Demographics > Household Income (HHI) > $100,000-$124,999
Interested in arts and entertainment
Lifestyle and Interests (Affinity) > Art and Entertainment > Visual Art and Design (FLA / Fair Lending Friendly)
Agency
Dog owner
Lifestyle And Interests (Affinity) > Pets > Dog Owners
Cat owner
Lifestyle And Interests (Affinity) > Pets > Cat Owners
Active investor
Lifestyle And Interests (Affinity) > Investors > Active Investor
Mutual fund investor
Lifestyle And Interests (Affinity) > Investors > Mutual Fund Investor
In-market for a full-size SUV
Autos, Cars and Trucks > In Market-Body Styles > Full-Size SUVs
Auto
In-market for a new car
Autos, Cars and Trucks > In Market-New/Used > New Car
In-market for a used car
Autos, Cars and Trucks > In Market-New/Used > Buyer Used
In-market for a Honda
Autos, Cars And Trucks > In Market-Make And Models > Honda
In-market for an auto loan
Financial FLA Friendly > In Market Auto Loan
In-market for an auto lease
Financial FLA Friendly > In Market Auto Lease
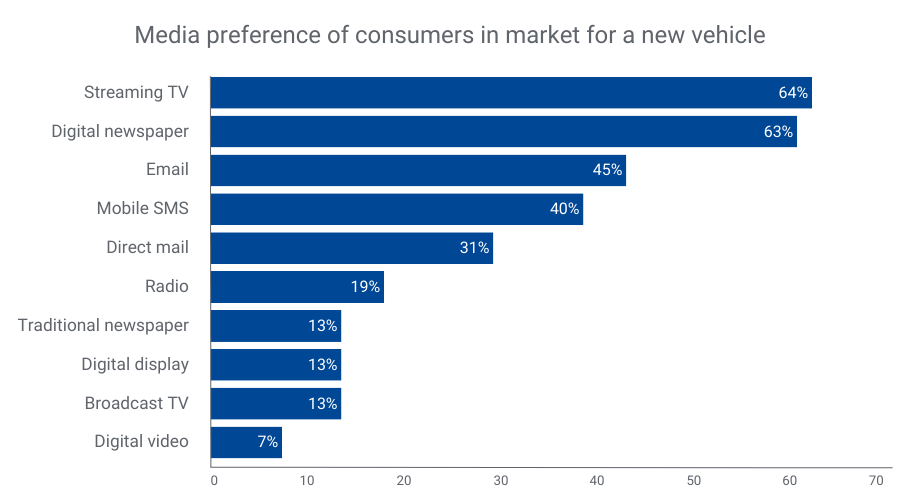
Did you know?
Consumers looking to buy a new vehicle prefer streaming TV, digital newspapers, and email for communication2. By merging our TrueTouchTM engagement channel audiences with our Auto in-market audiences, you can effectively target these consumers through their preferred channels. TrueTouch facilitates personalized advertising campaigns by predicting consumer preferences, ensuring messaging styles align with the right channels and calls to action.
By understanding what types of media people prefer, you can match the best way to talk to them with what to offer, using the right channels for personalized ads. No consumer is the same – and you need to engage with them on their terms to successfully market to them.
Financial
Active in the military
Lifestyle And Interests (Affinity) > Occupation > Military – Active
In-market for a credit union loan
Financial FLA Friendly > In Market Credit Union Loan
40-49 years old
Demographics > Ages > 40-49
30-39 years old
Demographics > Ages > 30-39
Small business owner
Consumer Behaviors > Occupation: Small Business Owners
Health
25-29 years old
Demographics > Ages > 25-29
30-34 years old
Demographics > Ages > 30-34
Weight conscious
Lifestyle and Interests (Affinity) > Health & Fitness > Weight Conscious
Moms interested in fitness
Lifestyle and Interests (Affinity) > Moms, Parents, Families > Fitness Mothers
High spenders at vitamin/supplement stores
Retail Shoppers: Purchase Based > Health and Fitness > Vitamins/Supplements: Vitamins/Supplements
Retail & CPG
Dog owners
Lifestyle And Interests (Affinity) > Pets > Dog Owners
Cat owners
Lifestyle And Interests (Affinity) > Pets > Cat Owners
Fitness enthusiast
Lifestyle and Interests (Affinity) > Health & Fitness > Fitness Enthusiast
Interested in healthy living
Lifestyle and Interests (Affinity) > Health & Fitness > Healthy Living
High spenders at vitamin/supplement stores
Retail Shoppers: Purchase Based > Health and Fitness > Vitamins/Supplements: Vitamins/Supplements
Activate the right audiences with Experian
When you choose Experian’s syndicated audiences, you gain access to over 2,400 audiences that span across 15 verticals and categories. These audiences are directly available for activation on over 30 platforms and can be sent to over 200 media platforms. Experian is ranked #1 for data accuracy (as validated by Truthset) and Experian Marketing Data is the foundation for successful targeting, enrichment, and activation.
For a full list of Experian’s syndicated audiences and activation destinations, download our syndicated audiences guide. Need a custom audience? We can help you build and activate an Experian audience on the platform of your choice.
Check out other seasonal audiences you can activate today.
Footnotes
- Fair Lending Act Friendly audiences: “Fair Lending Friendly” indicates data fields that Experian has made available without use of certain demographic attributes that may increase the likelihood of discriminatory practices prohibited by the Fair Housing Act (“FHA”) and Equal Credit Opportunity Act (“ECOA”). These excluded attributes include, but may not be limited to, race, color, religion, national origin, sex, marital status, age, disability, handicap, family status, ancestry, sexual orientation, unfavorable military discharge, and gender. Experian’s provision of Fair Lending Friendly indicators does not constitute legal advice or otherwise assure your compliance with the FHA, ECOA, or any other applicable laws. Clients should seek legal advice with respect to your use of data in connection with lending decisions or application and compliance with applicable laws.
- Experian looked at our Auto and TrueTouch audience data to understand media preference trends over the past year.
Latest posts

London – 24 November, 2017 – Tapad, part of Experian, is the leader in cross-device marketing technology and continues to broaden its reach across EMEA. The business today reported a 20 percent growth in the scope of its regional device graph, a data set used by organisations to map consumers to their devices, enabling better, more personalised cross-device marketing. This news complements Tapad’s recent expansion of its UK team with the hire of experienced solutions engineer, Davide Rosamilia. As the demand for cross-device technology solutions continues to grow around the globe, coupled with the emergence of regulations such as Europe’s General Data Protection Regulation (GDPR), Tapad is committed to offering suppliers the greatest level of insight without compromising consumer privacy. Since Tapad started licensing its proprietary Tapad Device GraphTM just over a year ago, demand for the company’s technology has experienced significant growth. New supply partnerships and proactive data sourcing have also meant an increase in devices across key markets, which contribute to the overall 20 percent growth of the EMEA device graph, including a 44 percent increase in the U.K., 47 percent in France, and 85 percent in Germany. “We’re continuing to invest heavily in growing our regional device graph, allowing us to better meet the needs of EMEA marketers as they strive to reach individuals with greater precision in some of the most tightly regulated marketplaces worldwide,” said Tom Rolph, VP EMEA, Tapad. “This year, we have also welcomed 10 new data suppliers whom we’ve helped to increase cross-device amplification, attribution and audience extension, helping to further set us apart in the marketplace and successfully expand our EMEA presence.” Available around the world, the Device Graph provides access to Tapad’s globally compliant and privacy-safe datasets across EMEA, APAC and the U.S., and offers deeper knowledge of consumer preferences, purchase intent, and conversion behaviors. “Tapad has shown a unique ability to adapt to the nuances of the local EMEA market and display impressive growth without sacrificing dedication to privacy,” said Alistair Hill, CEO and Co-founder at On Device Research. “When we started vetting technology vendors, we needed to be sure that we selected a partner that could offer compliant and privacy-safe datasets to operate within our stringent data standards. Tapad’s probabilistic solution offered us greater scale, greater device reach, and increased engagement without compromising on privacy.” For information more about the Tapad Device Graph™, or to request a demo, contact us today. Get started with us
The Tapad Device Graph™ Will Expand Sizmek’s Cross-Device Reach and Improve the Efficiency and Precision of Digital Advertising NEW YORK, November 16, 2017 — Tapad, part of Experian and a leader in cross-device marketing technology, today announced a new global partnership with Sizmek, the largest independent buy-side advertising platform delivering impressions that inspire. By integrating the Tapad Device Graph™, Sizmek will enhance its AI-powered predictive capabilities to deliver accurate, cross-device messaging at global scale in a privacy-safe environment. Combined with Sizmek’s existing data enablement, creative optimization and media execution capabilities, the proprietary Tapad Device Graph improves the efficiency and precision of digital advertising by accurately matching people and devices. This enables advertisers to get a clear view of individual customer journeys, achieve scale without compromising on efficiency, and uncover new opportunities for conversion. Sizmek’s customers will have access to Tapad’s globally compliant and privacy-safe datasets across the Americas, EMEA, and APAC. With deeper knowledge of consumer preferences, purchase intent and conversion behaviors, Sizmek and its customers are able to enhance advertising strategies including cross-device audience identification and more. “Tapad is known for their strong cross-device capabilities, and their offering is an excellent addition to our growing program for best-of-breed data and measurement partners" says Mike Caprio, Sizmek’s Chief Growth Officer. “For our customers, this partnership will add further people-based marketing precision and reach to our comprehensive offerings around creative optimization, data enablement and media execution." “Sizmek’s adoption of industry-leading AI and machine learning campaigns will be a great complement for the Device Graph,” said Chris Feo, SVP, strategy & global partnerships at Tapad. “Our ability to create smaller, more customized segments in conjunction with Sizmek’s AI modeling will deliver efficiency, effectiveness and increased ROI for marketers worldwide.” This partnership comes at a time of a massive shift in the marketing technology industry. Companies like Tapad and Telenor, as well as Rocket Fuel and Sizmek, are joining forces to adopt those technologies that are most efficient and accurate at reaching consumers at scale in a personalized and non-intrusive way. The combination of Tapad and Sizmek’s offerings will provide international marketers with exceptional resources to lead a more cost effective and results driven campaign. For information more about the Tapad Device Graph™, contact us today. Get started with us

The Tapad Device Graph™ increases Throtle’s amplification by 475 percent. NEW YORK, Nov. 1, 2017 /PRNewswire/ — Tapad, now a part of Experian, the leader in cross-device marketing technology, today announced a partnership with Throtle, a leading data onboarding company. The Tapad Device Graph™ will enhance Throtle's best-in-class onboarding capabilities by providing accurate and privacy-safe cross-device reach as well as precise audiences at scale. In partnership with Tapad, Throtle will deterministically link its services to a corroborated individual with hundreds of targeting attributes. This linkage allows Throtle to offer true cross-device identity management and identity resolution services to accompany its robust onboarding capabilities. Throtle will also work with Tapad to validate its device graph, building larger, more comprehensive audience segments. To date, the Tapad Device Graph™ has connected 61 percent of Throtle IDs to related ones in the graph, with an average amplification rate of 475 percent for Throtle's IDs, or 4.8 new IDs per each of Throtle's. Throtle has also seen its overall match rates involving Tapad's identity insights rise an average of 15 percent since the inception of the partnership. More specifically, Tapad's mobile advertising IDs (MAIDs) have increased Throtle's in-app identity inventory by 35 percent. "Tapad has proven to be a trusted source for cross-device matching and has a tremendous reputation in the advertising and marketing technology industries for delivering superior precision and scale with the utmost dedication to privacy," says Paul Chachko, CEO, Throtle. "Since we first began our test phase, and continuing through to this day, Tapad has met and exceeded our expectations for what a partner should be." With Tapad's strong commitment to precision and accuracy, Throtle was confident that this partnership would prove to be the right choice for the strategic expansion of its platform. Not only does Tapad deliver in-depth insights, parsing deterministic from probabilistic linkages, but its pool of device-level touchpoints enables Throtle to increase scale without seeing a decline in precision. "Accuracy and precision are core characteristics of our proprietary Device Graph," explains Chris Feo, SVP, Strategy & Global Partnerships, Tapad. "When Throtle approached our team, we knew we would be the right partner to assist their leading onboarding technology. We're excited to work with Throtle to achieve cross-device reach, audience scale and precise deterministic and probabilistic linkages for its clients." For more information about the Tapad Device Graph™, or to request a demo, visit https://www.experian.com/marketing/consumer-sync About TapadTapad Inc. is a marketing technology company renowned for its breakthrough, unified, cross-device solutions. The company's signature Tapad Device Graph™ connects millions of consumers across billions of devices. The world's largest brands and most effective marketers entrust Tapad to provide an accurate, privacy-conscious, and unified approach to connecting with consumers across screens. In 2015, Tapad began licensing the Tapad Device Graph™ and swiftly became the established gold-standard throughout the ad tech ecosystem. Tapad is based in New York and has offices in Boston, Chicago, Dallas, Detroit, London, Los Angeles, Miami, Oslo, San Francisco, Singapore, and Tokyo. Tapad's numerous awards include: Forbes' Most Promising Companies, Deloitte's Technology Fast 500, Crain's Fast 50, TMCnet Tech Culture Award, and Global Startup Award's "Startup Founder of the Year". In 2016, Tapad was acquired by the Telenor Group, one of the world's largest mobile operators. About ThrotleThrotle is a data onboarding company focused on deterministic matching and identity resolution, empowering brands with true individual-based marketing. Our data centric onboarding approach guarantees the highest level of accuracy, scale, and responsiveness for our clients. For more information on Throtle, please visit, throtle.io. Contact us today!