At Experian, we understand the critical role that audience targeting plays in the success of marketing campaigns. That’s why we’re excited to share this curated list, aimed at helping agencies and media buyers plan their campaigns and effectively reach their audiences with precision and confidence.
Here’s a look at the Experian audiences that were the most popular in Q2 2023. Which ones will you add to your Q2 campaign planning?
Our top 10 audiences for Q2
Fitness enthusiast
Lifestyle and Interests (Affinity) > Health & Fitness > Fitness Enthusiast
In-store high spender on baby products
Retail Shoppers: Purchase Based > Shopping Behavior > Baby Products: In Store High Spenders
Has a bachelor’s degree
Demographics > Education > Bachelor Degree
In-market for an SUV and CUV
Autos, Cars and Trucks > In Market-Body Styles > SUV and CUV
In-market for a mid-size truck
Autos, Cars and Trucks > In Market-Body Styles > Mid-Size Truck
Homeowner
Demographics > Homeowners/Renters > Homeowner
In-market for a small, mid-size SUV
Autos, Cars and Trucks > In Market-Body Styles > Small Mid-Size SUV
In-market for a full-size truck
Autos, Cars and Trucks > In Market-Body Styles > Full-Size Trucks
In-market for a full-size SUV
Autos, Cars and Trucks > In Market-Body Styles > Full-Size SUVs
Household income level
Demographics > Household Income (HHI) > $75,000+
Our top 5 audiences by vertical
Which audience segments were the most popular by advertiser vertical?
Advanced TV
Household income level
Demographics > Household Income (HHI) > $75,000-$99,999
Interested in dogs
Lifestyle and Interests (Affinity) > Pets > Dogs (FLA / Fair Lending Friendly)1
Homeowner
Demographics > Homeowner/Renter > Homeowner
Household income level
Demographics > Household Income (HHI) > $100,000-$124,999
Interested in arts and entertainment
Lifestyle and Interests (Affinity) > Art and Entertainment > Visual Art and Design (FLA / Fair Lending Friendly)
Agency
Dog owner
Lifestyle And Interests (Affinity) > Pets > Dog Owners
Cat owner
Lifestyle And Interests (Affinity) > Pets > Cat Owners
Active investor
Lifestyle And Interests (Affinity) > Investors > Active Investor
Mutual fund investor
Lifestyle And Interests (Affinity) > Investors > Mutual Fund Investor
In-market for a full-size SUV
Autos, Cars and Trucks > In Market-Body Styles > Full-Size SUVs
Auto
In-market for a new car
Autos, Cars and Trucks > In Market-New/Used > New Car
In-market for a used car
Autos, Cars and Trucks > In Market-New/Used > Buyer Used
In-market for a Honda
Autos, Cars And Trucks > In Market-Make And Models > Honda
In-market for an auto loan
Financial FLA Friendly > In Market Auto Loan
In-market for an auto lease
Financial FLA Friendly > In Market Auto Lease
Did you know?
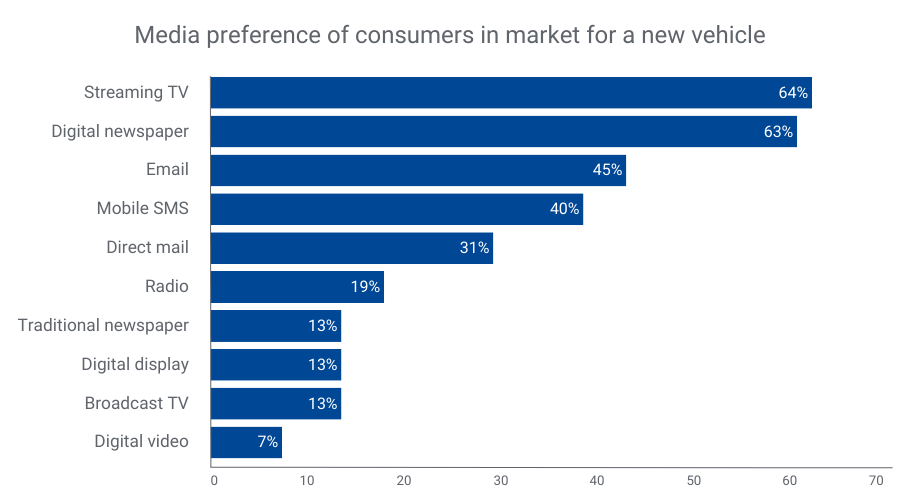
Consumers looking to buy a new vehicle prefer streaming TV, digital newspapers, and email for communication2. By merging our TrueTouchTM engagement channel audiences with our Auto in-market audiences, you can effectively target these consumers through their preferred channels. TrueTouch facilitates personalized advertising campaigns by predicting consumer preferences, ensuring messaging styles align with the right channels and calls to action.
By understanding what types of media people prefer, you can match the best way to talk to them with what to offer, using the right channels for personalized ads. No consumer is the same – and you need to engage with them on their terms to successfully market to them.
Financial
Active in the military
Lifestyle And Interests (Affinity) > Occupation > Military – Active
In-market for a credit union loan
Financial FLA Friendly > In Market Credit Union Loan
40-49 years old
Demographics > Ages > 40-49
30-39 years old
Demographics > Ages > 30-39
Small business owner
Consumer Behaviors > Occupation: Small Business Owners
Health
25-29 years old
Demographics > Ages > 25-29
30-34 years old
Demographics > Ages > 30-34
Weight conscious
Lifestyle and Interests (Affinity) > Health & Fitness > Weight Conscious
Moms interested in fitness
Lifestyle and Interests (Affinity) > Moms, Parents, Families > Fitness Mothers
High spenders at vitamin/supplement stores
Retail Shoppers: Purchase Based > Health and Fitness > Vitamins/Supplements: Vitamins/Supplements
Retail & CPG
Dog owners
Lifestyle And Interests (Affinity) > Pets > Dog Owners
Cat owners
Lifestyle And Interests (Affinity) > Pets > Cat Owners
Fitness enthusiast
Lifestyle and Interests (Affinity) > Health & Fitness > Fitness Enthusiast
Interested in healthy living
Lifestyle and Interests (Affinity) > Health & Fitness > Healthy Living
High spenders at vitamin/supplement stores
Retail Shoppers: Purchase Based > Health and Fitness > Vitamins/Supplements: Vitamins/Supplements
Activate the right audiences with Experian
When you choose Experian’s syndicated audiences, you gain access to over 2,400 audiences that span across 15 verticals and categories. These audiences are directly available for activation on over 30 platforms and can be sent to over 200 media platforms. Experian is ranked #1 for data accuracy (as validated by Truthset) and Experian Marketing Data is the foundation for successful targeting, enrichment, and activation.
For a full list of Experian’s syndicated audiences and activation destinations, download our syndicated audiences guide. Need a custom audience? We can help you build and activate an Experian audience on the platform of your choice.
Check out other seasonal audiences you can activate today.
Footnotes
- Fair Lending Act Friendly audiences: “Fair Lending Friendly” indicates data fields that Experian has made available without use of certain demographic attributes that may increase the likelihood of discriminatory practices prohibited by the Fair Housing Act (“FHA”) and Equal Credit Opportunity Act (“ECOA”). These excluded attributes include, but may not be limited to, race, color, religion, national origin, sex, marital status, age, disability, handicap, family status, ancestry, sexual orientation, unfavorable military discharge, and gender. Experian’s provision of Fair Lending Friendly indicators does not constitute legal advice or otherwise assure your compliance with the FHA, ECOA, or any other applicable laws. Clients should seek legal advice with respect to your use of data in connection with lending decisions or application and compliance with applicable laws.
- Experian looked at our Auto and TrueTouch audience data to understand media preference trends over the past year.
Latest posts

Cross-Screen Pioneer Explores the Power of Connected Cars as a Vehicle for Customer Engagement LAS VEGAS, NV — (October 26, 2016) –Kate O’Loughlin, GM of Media for Tapad, addressed the J.D. Power Automotive conference audience today in Las Vegas, NV. With more than 1,400 participants representing every facet of the automotive marketing profession, the conference has become the industry's leading marketing event. Bringing the unified, cross-screen perspective to the stage, O’Loughlin discussed the vital role of connected cars in the consumer engagement process. She is a founding member of Tapad which launched the world’s first cross-screen marketing technology in 2010. Tapad was acquired by the Telenor Group early in 2016. Key points from O’Loughlin’s J.D. Power 2016 address included: The marketers who deliver relevant and engaging content in a privacy-safe setting will be in the strongest position to navigate the proliferation of connected devices, including the connected points in cars. As automakers innovate the technology in cars, marketers need to be prepared for the size and diversity of data available for understanding consumers. It’s going to be increasingly difficult to wade through the data, so now is the time to build a solid framework for understanding the person behind the data. Marketers who evolve — and take a holistic approach — to their campaign measurements will achieve marked improvements in efficiency and an enhanced understanding of their core audiences. Actionable brand engagement metrics like Viewable Exposure Time (VET) will continue to overtake traditional advertising performance metrics. VET evaluates the optimal amount of time an ad is present on a screen to incite consumer action. In early testing by Tapad, campaigns that employ VET see conversion rate performance improvements from 13 to 60%. The consumer-centric technology solutions of the future need to be as scalable as they are affordable. Learn more about Tapads’ recommended Viewable Exposure Time metric contact us today! Contact us
NEW YORK, Sept. 28, 2016 /PRNewswire/ — Tapad, the leader in cross-device marketing technology, today announced a new metric for cross-device marketers, Viewable Exposure Time (VET). Viewable Exposure Time measures across screens and ad formats, identifying the optimal amount of time a consumer spends with an ad before they take action. The announcement coincides with Unify Tech '16, Tapad's third-annual cross-device summit during Advertising Week NY. Frequency caps are currently used to ensure that dollars aren't wasted on redundant ads. Viewable Exposure Time evolves the frequency capping approach to include accelerating a consumer's ad exposure rate up to the optimal time spent with the brand. VET is used in affinity, digital transaction and offline purchase models as a key indicator of marketing budget well-spent. Beta users of VET span every vertical, though interest is especially high from CPG, Automotive, Telecommunications and Retail. Viewable Exposure Time unifies and upgrades marketers' predictors of advertising success by leveraging cross-screen engagement across digital and television, with vendor-agnostic viewability scores for video, rich media and display. "Today's current measurement options, like click-through rate (CTR) and TV gross ratings points (GRP) tell an incomplete story," said Tapad GM of Media Kate O'Loughlin. "Tapad is focused on measuring what really matters to marketers – building an efficient connection with a customer. Innovation in metrics was long overdue." More than just a measurement tool, Tapad also provides clients with VET activation. Factoring in time spent with ads in viewable seconds and minutes, these analytics inform marketers about which audiences are underexposed, enabling them to adjust campaigns and deliver according to optimal viewable exposure time. This effectively increases conversion rates at the lowest cost. Contact us today

Strong Revenue Performance and Thriving Culture Contribute to Industry Recognition NEW YORK, Sept. 15, 2016 /PRNewswire/ — Tapad, the leader in cross-device marketing technology and now a part of Experian, was named a top company on Inc. Magazine’s list of the 5000 fastest-growing private companies in the U.S. In addition, Tapad won the TMCnet 2016 Tech Culture Award. The exclusive Inc. 5000 ranking highlights the fastest-growing privately-held* companies in America. These distinguished companies have achieved success in strategy, service and innovation. TMCnet recognizes talented tech professionals who are committed to building a culture that prioritizes employee growth, collaboration and engagement. Tapad continues to broaden their presence into new markets, having launched in APAC earlier this year, as well as continuing their European expansion. Tapad’s proprietary technology, The Device Graph™ is leveraged by more marketers and brands to understand digital engagement across devices. The company’s rapidly expanding client base includes numerous Fortune 500 company brands as well as all four major advertising holding companies in the U.S. “We have an exceptional team of innovative people who are all working very hard to achieve the kind of results these publications are recognizing,” said Tapad CEO and Founder, Are Traasdahl. “Given that, we have an even greater responsibility to our talent to create an environment that fosters innovation and nurtures open communication. Ultimately, this is how we will continue to reach our very ambitious goals of becoming the world’s leading unified marketing technology provider.” Tapad’s award-winning work culture is defined by its gold-standard benefits which include a six-month parental leave policy, unlimited vacation time, company-sponsored meals and office space designed to facilitate collaboration and open communication. Tapad’s highly talented team has also received multiple customer service awards in 2016. These awards include the iMedia ASPY awards for Best Customer Service and Best Mobile Partner as well as recognition from The Communicator Awards of Excellence in Interactive Media. *Prior to Tapad’s acquisition by Telenor in February 2016. Contact us today!