All posts by Guest Contributor

As new vehicle prices continue to rise, more consumers are turning to leasing as a cost-effective auto financing option. Findings from the most recent State of the Automotive Finance Market report show that the average lease payment for Q4 2015 was $412 (versus the average loan payment of $493). Not surprisingly, due to the fact that most consumers tend to finance vehicles based on monthly prices, leasing reached a record high, accounting for 33.6% of all new financing during the quarter. Lenders can design more effective strategies by using analytics to gain insight into the latest trends and to target the right customers for automotive leases and loans. >> Video: Auto Acquisition Strategies

What difference does $4.40 make? It can’t buy you much on its own, but it can make a world of difference when you’re handling the aftermath of a data breach or other cyberattack. That’s how much cyber insurance protection reduces the per-record cost of a data breach, according to the Ponemon Institute’s 2015 Cost of a Data Breach report. Whether you’re a small business owner with just a few hundred customers or a global corporation with records in the millions, the cost of being without cyber insurance in the wake of an incident can be extreme. When you consider the sheer number of records involved in recent mega-breaches — more than 78 million in the Anthem breach alone — the cost reduction can easily soar into hundreds of million dollars saved. And while smaller businesses may have fewer records to be breached, the impact of an attack can be even more devastating to them than to global entities when they experience a mega-breach. Yet less than one-third (32 percent) of businesses surveyed for Ponemon’s study reported having cyber insurance. The percentage was a bit better when the Risk Management Society (RIMS) asked 284 of its members about cyber insurance; 51 percent reported having stand-alone cyber insurance policies. Even fewer small businesses report having cyber insurance. Just 5 percent of small business owners surveyed by Endurance International Group said they carried cyber insurance, despite 81 percent believing cybersecurity is a concern for small business. Those who have cyber insurance clearly understand its value. RIMS members said they bought policies to: Reduce the risk of an incident damaging their company’s reputation (79 percent). Minimize the potential impact of business interruption (78 percent). Aid in data breach response and notification (73 percent). What’s more, of the RIMS members who didn’t have cyber insurance, 74 percent said they were considering buying it within the next 12–24 months. While small business owners also appear aware of the risk, they seem less cognizant of the benefits of cyber insurance and other cybersecurity measures. Endurance found that although 94 percent of small business owners said they do think about cybersecurity issues, and nearly a third have experienced an attack or an attempt, just 42 percent have invested in cybersecurity in the past year. A widely reported study by the National Cyber Security Alliance asserts that 60 percent of small businesses that experience a data breach go out of business within six months. Cyber insurance premiums vary widely and are largely tied to a company’s revenues and exposure. Policies typically aim to address risks commonly associated with a cyberattack, including: Liability for loss of confidential information that occurs through unauthorized access to a company’s computer systems. Data breach costs including notification of affected consumers, customer support and providing credit monitoring to affected customers. The costs of restoring, improving or replacing compromised technologies. Regulatory compliance costs. Business interruption expenses. Of course, like virtually any other type of insurance, cyber insurance policies can be customized to address the risks facing the individual policy holder. Many in the insurance industry feel that cyber insurance products have matured, evolving into a type of protection that businesses both large and small simply can’t afford to do without. When you consider the devastating risk of facing a cyberattack without insurance, that simple per-record cost savings of just $4.40 takes on a much deeper meaning. While more large companies are seeing the value of cyber insurance, small business owners need to begin incorporating this valuable type of protection into their overall cyber security plans. Learn more about our Data Breach solutions
Whether its new regulations and enforcement actions from the Consumer Financial Protection Bureau or emerging legislation in Congress, the public policy environment for consumer and commercial credit is dynamic and increasingly complex. If you are interested to learn more about how to navigate an increasingly choppy regulatory environment, consider joining a breakout session at Experian’s Vision 2016 Conference that I will be moderating. I’ll be joined by several experts and practitioners, including: John Bottega, Enterprise Data Management Conor French, Funding Circle Troy Dennis, TD Bank Don Taylor, President, Automated Collection Services During our session, you’ll learn about some of the most trying regulatory issues confronting the consumer and commercial credit ecosystem. Most importantly, the session will look at how to turn potential challenges into opportunities. This includes learning how to incorporate new alternative data sets into credit scoring models while still ensuring compliance with existing fair lending laws. We’ll also take a deep dive into some of the coming changes to debt collection practices as a result of the CFPB’s highly anticipated rulemaking. Finally, the panel will take a close look at the challenges of online marketplace lenders and some of the mounting regulations facing small business lenders. Learn more about Vision 2016 and how to register for the May conference.
A recent Experian study reveals that tax filing, document collection and refund processing are done online more often, yet only 6% of consumers file taxes on a computer with up-to-date antivirus software. 79% filed their most recent tax return online, up from 73% in 2011 18% scan and save their tax documents electronically, up from 6% in 2011 More than 75% of respondents have used EFT for tax refunds As electronic filing continues to grow, identity theft is likely to increase. While consumers should take steps to protect themselves, businesses also need to employ identity theft protection solutions to safeguard consumer information. >> Identify and prevent fraud

Device emulators — wolves in sheep’s clothing Despite all the fraud prevention systems and resources in the public and private sectors, online fraud continues to grow at an alarming rate, offering a low-risk, high-reward proposition for fraudsters. Unfortunately, the Web houses a number of easily accessible tools that criminals can use to perpetrate fraud and avoid detection. The device emulator is one of these tools. Simply put, a device emulator is one device that pretends to be another. What began as innovative technology to enable easy site testing for Web developers quickly evolved into a universally available tool that attackers can exploit to wreak havoc across all industry verticals. While it’s not new technology, there has been a significant increase in its use by criminals to deceive simple device identification and automated risk-management solutions to carry out fraudulent activities. Suspected device emulation (or spoofing) traffic historically has been difficult to identify because fraud solutions rely heavily on reputation databases or negative lists. Detecting and defeating these criminals in sheep’s clothing is possible, however. Leveraging Experian’s collective fraud intelligence and data modeling expertise, our fraud research team has isolated several device attributes that can identify the presence of an emulator being used to submit multiple transactions. Thanks to these latest FraudNet rule sets, financial institutions, ecommerce merchants, airlines, insurers and government entities alike now can uncloak and protect against many of these cybercriminals. Unfortunately, device emulators are just one of many tools available to criminals on the Dark Web. Join me at Vision 2016, where U.S. Secret Service and I will share more tales from the Dark Web. We will explore the scale of the global cybercrime problem, walk through the anatomy of a typical hack, explain how hackers exploit browser plug-ins, and describe how enhanced device intelligence and visibility across all channels can stop fraudsters in their tracks. Listen to Mike Gross as he shares a short overview of his Vision 2016 breakout session in this short video. Don’t miss this innovative Vision 2016 session! See you there.

In today’s interconnected world, reaching consumers should be as simple as sending a text or calling their cell phone. However, complying with the Telephone Consumer Protection Act (TCPA) can create an almost insurmountable mountain. While the law has been in place since 1991, TCPA litigation continues to be a considerable source of potential legal and compliance risk for companies communicating with consumers. There were 1,908 TCPA lawsuits in 2014, an increase of 30 percent over the previous year, and a 231 percent increase in the last four years. Is your business facing challenges in complying with TCPA? Do you want to learn more about the changing and challenging TCPA legal and regulatory framework? Are you looking for best practices on how to win the battle of right party contact? Then you should join us for a breakout session solely focused on TCPA at Experian’s Vision 2016 Conference. The panel features a number of subject matter experts who will be able to provide attendees with a look at this law and some of the best practices to manage risk and ensure compliance. Panelists include: Mary Anne Gorman, Experian Tony Hadley, Experian Tom Gilbertson, Venable LLC To learn more more about TCPA best practices, check out Experian’s annual Vision Conference in May.

According to Experian’s State of the Automotive Finance Market report, the average amount financed for a new vehicle in Q4 2015 was $29,551 — up $1,170 from 2014 and the highest amount on record since Experian began tracking auto loan amounts in 2008.

According to a recent Experian study, women handle money, debt and financial decisions better than men.

Whether it is an online marketplace lender offering to refinance the student loan debt of a recent college graduate or an online small-business lender providing an entrepreneur with a loan when no one else will, there is no doubt innovation in the online lending sector is changing how Americans gain access to credit. This expanding market segment takes great pride in using “next-generation” underwriting and credit scoring risk models. In particular, many online lenders are incorporating noncredit information such as income, education history (i.e., type of degree and college), professional licenses and consumer-supplied information in an effort to strike the right balance between properly assessing credit risk and serving consumers typically shunned by traditional lenders because of a thin credit history. Regulatory concerns The exponential growth of the online lending sector has caught the attention of regulators — such as the U.S. Treasury Department, the Federal Deposit Insurance Corporation, Congress and the California Business Development Office — who are interested in learning more about how online marketplace lenders are assessing the credit risk of consumers and small businesses. At least one official, Antonio Weiss, a counselor to the Treasury secretary, has publicly raised concerns about the use of so-called nontraditional data in the underwriting process, particularly data gleaned from social media accounts. Weiss said that “just because a credit decision is made by an algorithm, doesn’t mean it is fair,” citing the need for lenders to be aware of compliance with fair lending obligations when integrating nontraditional credit data. Innovative and “tried and true” are not mutually exclusive Some have suggested the only way to assuage regulatory concerns and control risk is by using tried-and-true legacy credit risk models. The fact is, however, online marketplace lenders can — and should — continue to push the envelope on innovative underwriting and business models, so long as these models properly gauge credit risk and ensure compliance with fair lending rules. It’s not a simple either-or scenario. Lenders always must ensure their scoring analytics are based upon predictive and accurate data. That’s why lenders historically have relied on credit history, which is based upon data consumers can dispute using their rights under the Fair Credit Reporting Act. Statistically sound and validated scores protect consumers from discrimination and lenders from disparate impact claims under the Equal Credit Opportunity Act. The Office of the Comptroller of the Currency guidance on model risk management is an example of regulators’ focus on holding responsible the entities they oversee for the validation, testing and accuracy of their models. Marketplace lenders who want to push the limit can look to credit scoring models now being used in the marketplace without negatively impacting credit quality or raising fair lending risk. For example, VantageScore® allows for the scoring of 30 million to 35 million more people who currently are unscoreable under legacy credit score models. The VantageScore® credit score does this by using a broader, deeper set of credit file data and more advanced modeling techniques. This allows the VantageScore® credit score model to capture unique consumer behaviors more accurately. In conclusion, online marketplace lenders should continue innovating with their own “secret sauce” and custom decisioning systems that may include a mix of noncredit factors. But they also can stay ahead of the curve by relying on innovative “tried-and-true” credit score models like the VantageScore® credit score model. These models incorporate the best of both worlds by leaning on innovative scoring analytics that are more inclusive, while providing marketplace lenders with assurances the decisioning is both statistically sound and compliant with fair lending laws. VantageScore® is a registered trademark of VantageScore Solutions, LLC.

When checking access accounts were first introduced, it wasn’t uncommon for banks to provide new customers “basic” transaction services in starter checking accounts. These services typically included an automatic teller machine (ATM) access card and the ability to withdraw cash at their local branch. As consumers developed a relationship and established financial trust with their bank, they eventually would get a checkbook, which allowed check-writing access. This took time and a consumer demonstrating both the willingness and ability to manage finances to the bank’s expectations. Establishing the financial relationship was a trust-building process. With the onset of general-purpose debit cards and a host of other digital money-movement capabilities, such as online banking, the majority of banks now offer just basic and preferred checking. A minimum acceptance standard leaves many consumers out of the financial transaction system, which is something that concerns regulatory bodies such as the Consumer Financial Protection Bureau (CFPB). Approval criteria vary across financial institutions, but a typical basic checking account has some form of overdraft feature enabled, and some consumers may not be able to afford these fees even if they elect to opt in for overdraft functionality. Nonetheless, banks still screen applicants to ensure prior accounts at other institutions were managed with no losses incurred by other banks. In today’s modern world, it is difficult to participate fully in our credit-driven society without a checking account at a recognized bank or credit union. The answer in many cases would be checking accounts for consumers that have either overdraft functionality assigned based on the consumer’s wish to opt in or overdraft access that matches that same consumer’s ability to pay. In early February, the CFPB passed new guidelines to increase access to basic check products. While a step towards making checking accounts available to all, the most recent actions still leave unresolved regulatory actions regarding what the CFPB refers to as “affordable” checking access. For instance, for those consumers without disposable income, the issue of fees for overdraft and nonsufficient funds is still an unresolved regulatory matter. In the most recent announcement, the CFPB took several actions related to its focus on increasing consumer access to checking transaction accounts with banks: Sending a letter to CEOs of the top 25 banks encouraging them to take steps to help consumers with affordable checking account access such as “no fee” and/or “no overdraft” checking accounts Providing several new resources to consumers such as a guide to “Low Risk Checking, Managing Checking and Consumer Guide to Checking Account Denial” Introducing the Consumer Protection Principles, which include a drive toward: Faster funds availability Improved consumer transparency into checking account fee structure, funds availability and security Tailoring products to reach a larger percentage of consumers Developing no-overdraft type checking products, which only a handful of large banking institutions had What lurks ahead for banks is the need to develop products that are designed to reach a larger population that includes under banked and unbanked consumers with troubled financial repayment history. Coupling this product development effort with the CFPB desire for no-overdraft-fee type products makes me wonder if we should look to account features from several decades ago, such as creating a 21st century version of the checking account with digital money-movement features that protects consumers’ privacy, but doesn’t put them in a position to rack up large amounts of overdraft fees they can’t afford to pay in the event they overdraw the checking account. Experian® suggests taking the following steps: Conduct a Business Review to ensure that your product offering includes the type of account the CFPB is advocating and your existing core banking platform can operationalize this account Align your checking account prospect and opening procedures to key segments to ensure more consumers are approved and right-sized to the appropriate checking product Enhance your business profitability by cross-selling credit products that fit the affordability and disposable income of various consumer segments you originate These steps will make your journey “back to the future” much less turbulent and ensure you don’t break the bank in your efforts to address CFPB’s well-intentioned focus on check access for consumers.

Millions of people around the world are wearing green to celebrate St. Patrick's Day today. Some interesting facts on the color: Green is associated with St. Patrick's Day because it is the color of spring, Ireland and the shamrock Green ink originally was used in U.S. currency to prevent counterfeiting and because of its resistance to chemical and physical changes The Chicago River is colored green for the St. Patrick's Day parade each year using 45 pounds of vegetable dye >> Gain insights and earn more green with the Market Intelligence Brief

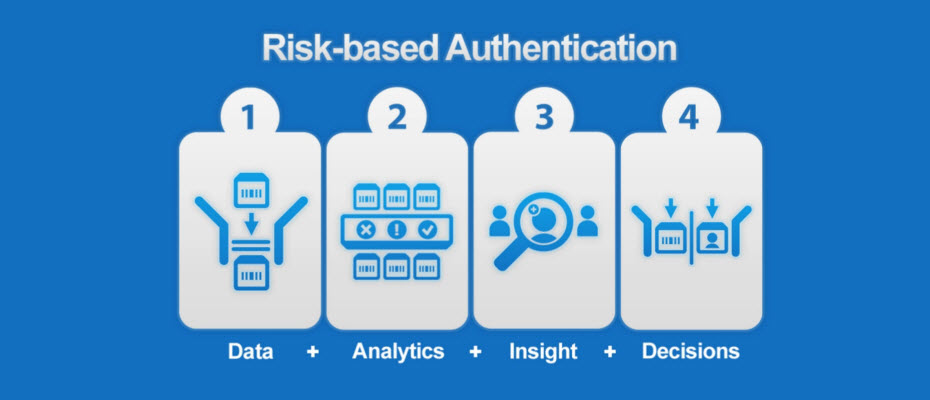
Identity management traditionally has been made up of creating rigid verification processes that are applied to any access scenario. But the market is evolving and requiring an enhanced Identity Relationship Management strategy and framework. Simply knowing who a person is at one point in time is not enough. The need exists to identify risks associated with the entire identity profile, including devices, and the context in which consumers interact with businesses, as well as to manage those risks throughout the consumer journey. The reasoning for this evolution in identity management is threefold: size and scope, flexible credentialing and adaptable verification. First, deploying a heavy identity and credentialing process across all access scenarios is unnecessarily costly for an organization. While stringent verification is necessary to protect highly sensitive information, it may not be cost-effective to protect less-valuable data with the same means. A user shouldn’t have to go through an extensive and, in some cases, invasive form of identity verification just to access basic information. Second, high-friction verification processes can impede users from accessing services. Consumers do not want to consistently answer multiple, intrusive questions in order to access basic information. Similarly, asking for personal information that already may have been compromised elsewhere limits the effectiveness of the process and the perceived strength in the protection. Finally, an inflexible verification process for all users will detract from a successful customer relationship. It is imperative to evolve your security interactions as confidence and routines are built. Otherwise, you risk severing trust and making your organization appear detached from consumer needs and preferences. This can be used across all types of organizations — from government agencies and online retailers to financial institutions. Identity Relationship Management has three unique functions delivered across the Customer Life Cycle: Identity proofing Authentication Identity management Join me at Vision 2016 for a deeper analysis of Identity Relationship Management and how clients can benefit from these new capabilities to manage risk throughout the Customer Life Cycle. I look forward to seeing you there!
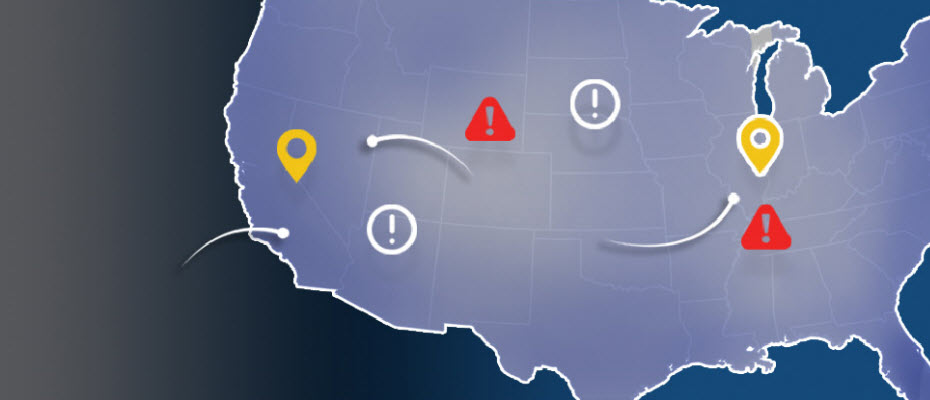
Top states for billing and shipping e-commerce fraud With more than 13 million fraud victims in 2015, assessing where fraud occurs is an important layer of verification for e-commerce. Experian® analyzed millions of e-commerce transactions from 2015 to identify fraud attack rates across the United States. With the switch to chip-enabled credit card transactions and possible growth of card-not-present fraud, online businesses should utilize advanced fraud solutions to monitor their riskiest locations and prevent losses. >> View the Experian map to see 2015 e-commerce attack rates for all states

Bankcard origination volumes reached $97.5 billion in Q4 2015, the highest level on record since Q3 2008 and an increase of 22% over the same quarter in 2014. The 60–89-days-past-due bankcard delinquency rate came in at .53% for Q4 2015 — significantly lower than the 1.22% delinquency rate back in Q3 2008. The increase in bankcard originations combined with lower delinquencies points to a positive credit environment. Lenders should stay abreast of the latest bankcard trends in order to adjust lending strategies and capitalize on areas of opportunity. >> Key steps to designing a profitable bankcard campaign
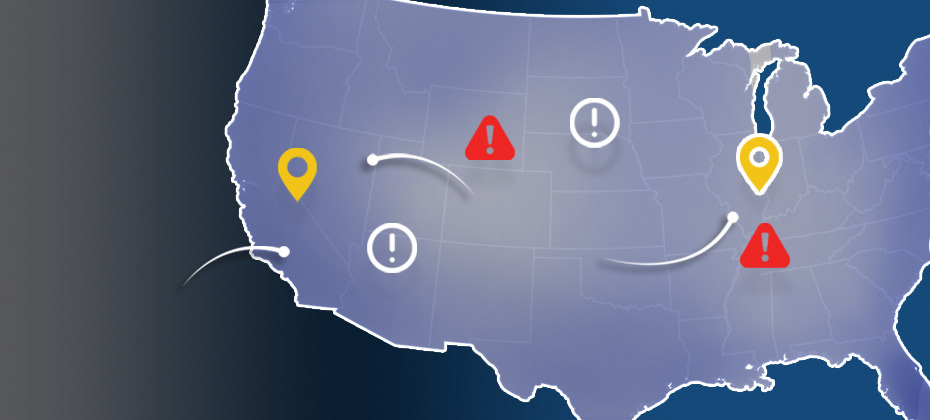
2015 data shows where billing and shipping e-commerce fraud attacks occur in the United States Experian e-commerce fraud attacks and rankings now available Does knowing where fraud takes place matter? With more than 13 million fraud victims in 2015,[1] assessing where fraud occurs is an important layer of verification when performing real-time risk assessments for e-commerce. Experian® analyzed millions of e-commerce transactions from 2015 data to identify fraud-attack rates across the United States for both shipping and billing locations. View the Experian map to see 2015 e-commerce attack rates for all states and download the top 100 ZIP CodeTMrankings. “Fraud follows the path of least resistance. With more shipping and billing options available to create a better customer experience, criminals attempt to exploit any added convenience,” said Adam Fingersh, Experian general manager and senior vice president of Fraud & Identity Solutions. “E-commerce fraud is not confined to larger cities since fraudsters can ship items anywhere. With the switch to chip enabled credit card transactions, and possible growth of card-not-present fraud, our fraud solutions help online businesses monitor their riskiest locations to prevent losses both in dollars and reputation in the near term.” For ease of interpretation, billing states are associated with fraud victims (the address of the purchaser) and shipping states are associated with fraudsters (the address where purchased goods are sent). According to the 2015 e-commerce attack rate data: Florida is the overall riskiest state for billing fraud, followed by Delaware; Washington, D.C.; Oregon and California. Delaware is the overall riskiest state for shipping fraud, followed by Oregon, Florida, California and Nevada. Eudora, Kan., has the overall riskiest billing ZIP Code (66025). The next two riskiest ZIPTM codes are located in Miami, Fla. (33178) and Boston, Mass. (02210). South El Monte, Calif., has the overall riskiest shipping ZIP Code (91733). The next four riskiest shipping ZIP codes are all located in Miami. Overall, five of the top 10 riskiest shipping ZIP codes are located in Miami. Defiance, Ohio, has the least risky shipping ZIP Code (43512). The majority of U.S. states are at or below the average attack rate threshold for both shipping and billing fraud, with only seven states — Florida, Oregon, Delaware, California, New York, Georgia and Nevada — and Puerto Rico ranking higher than average. This indicates that attackers are targeting consumers equally in the higher-risk states while leveraging addresses from both higher- and lower-risk states to ship and receive fraudulent merchandise. Many of the higher-risk states are located near a large port-of-entry city, including Miami; Portland, Ore.; and Washington, D.C., perhaps allowing criminals to move stolen goods more effectively. All three cities are ranked among the riskiest cities for both measures of fraud attacks. Neighboring proximity to higher-risk states does not appear to correlate to any additional risk — Pennsylvania and Rhode Island are ranked as two of the lower-risk states for both shipping and billing fraud. Other lower-risk states include Wyoming, South Dakota and West Virginia. Experian analyzed millions of e-commerce transactions to calculate the e-commerce attack rates using “bad transactions” in relation to the total number of transactions for the 2015 calendar year. View the Experian map to see 2015 e-commerce attack rates for all states and download the top 100 ZIP Code rankings. [1]According to the February 2016 Javelin study 2016 Identity Fraud: Fraud Hits an Inflection Point.