Credit Lending

Happy holidays! It’s the holiday season and a festive time of year. Colorful lights, comfort food and holiday songs – all of these things contribute to the celebratory atmosphere which causes many people to let their guards down and many businesses to focus more on service than on risk. Unfortunately, fraudsters and other criminals can make one of the busiest shopping times of the year, a miserable one for their victims. The nature of the stolen data has the potential to create long-term headaches for the organization and tens of millions of individuals. Unlike a retailer or financial breach, where stolen payment cards can be deactivated and new ones issued, the theft of permanent identity information is, well, not easily corrected. You can’t simply reissue Social Security numbers, birth dates, names and addresses. For individuals, we need to internalize this fact: our data has likely been breached, and we need to become vigilant and defend ourselves. Sign-up for a credit monitoring service to be alerted if your data or ID is being used in ways that indicate fraud. Include your children, as well. A child’s identity is far more valuable to a fraudster as they know it can be several years before their stolen identity is detected. The good news is, in addition to the credit bureau, many banks and auto clubs now offer this as a service to their customers. For organizations, the focus should be on two fronts: data protection and fraud prevention. Not just to prevent financial theft, but to preserve trust — trust between organizations and consumers, as well as widespread consumer trust. Organizations must strive to evolve data protection controls and fraud prevention skills to minimize the damage caused by stolen identity data. There are dozens of tools in the industry for identifying that a consumer is who they say they are – and these products are an important part of any anti-fraud strategy. These options may tell you that the combination of elements is the consumer, but do you know that it is the REAL consumer presenting them? The smart solution is to use a broad data set for not only identity verification, but also to check linkage and velocity of use. For example: Is the name linking to other addresses being presented in the past week? Is the phone number showing up to other addresses and names over the past 30 days? Has the SSN matched to other names over the past 90 days? Since yesterday the address matches to four phone numbers and two names – is this a problem? And it must be done in ways that reinforce the trust between consumers and organizations, enhance the customer experience, and frustrate criminals. Click here to learn more about Experian’s products and services that can help. As we go walking in the winter wonderland, remember, the holiday season is a time for cheer… and vigilance!

Which part of the country has bragging rights when it comes to sporting the best consumer credit scores? Drum roll please … Honors go to the Midwest. In fact, eight of the 10 cities with the highest consumer credit scores heralded from Minnesota and Wisconsin. Mankato, Minn., earned the highest ranking with an average credit score of 708 and Greenwood, Miss., placed last with an average credit score of 622. Even better news is that the nation’s average credit score is up four points; 669 to 673 from last year and is only six points away from the 2007 average of 679, which is a promising sign as the economy continues to rebound. Experian’s annual study ranks American cities by credit score and reveals which cities are the best and worst at managing their credit, along with a glimpse at how the nation and each generation is faring. “All credit indicators suggest consumers are not as ‘credit stressed’ — credit card balances and average debt are up while utilization rates remained consistent at 30 percent,” said Michele Raneri, vice president of analytics and new business development at Experian. As for the generational victors, the Silents have an average 730, Boomers come in with 700, Gen X with 655 and Gen Y with 634. We’re also starting to see Gen Z emerge for the first time in the credit ranks with an average score of 631. Couple this news with other favorable economic indicators and it appears the country is humming along in a positive direction. The stock market reached record highs post-election. Bankcard originations and balances continue to grow, dominated by the prime borrower. And the housing market is healthy with boomerang borrowers re-emerging. An estimated 2.5 million Americans will see a foreclosure fall of their credit report between June 2016 and June 2017, creating a new pool of potential buyers with improved credit profiles. More than 12 percent who foreclosed back in the Great Recession have already boomeranged to become homeowners again, while 29 percent who experienced a short sale during that same time have also recently taken on a mortgage. “We are seeing the positive effects of economic recovery with the rise in income and low unemployment reflected in how Americans are managing their credit,” said Raneri. Which means all is good in the world of credit. Of course there is always room for improvement, but this year’s 7th annual state of credit reveals there is much to be thankful for in 2016.

2017 data breach landscape Experian Data Breach Resolution releases its fourth annual Data Breach Industry Forecast report with five key predictions What will the 2017 data breach landscape look like? While many companies have data breach preparedness on their radar, it takes constant vigilance to stay ahead of emerging threats and increasingly sophisticated cybercriminals. To learn more about what risks may lie ahead, Experian Data Breach Resolution released its fourth annual Data Breach Industry Forecast white paper. The industry predictions in the report are rooted in Experian's history helping companies navigate more than 17,000 breaches over the last decade and almost 4,000 breaches in 2016 alone. The anticipated issues include nation-state cyberattacks possibly moving from espionage to full-scale cyber conflicts and new attacks targeting the healthcare industry. "Preparing for a data breach has become much more complex over the last few years," said Michael Bruemmer, vice president at Experian Data Breach Resolution. "Organizations must keep an eye on the many new and constantly evolving threats and address these threats in their incident response plans. Our report sheds a light on a few areas that could be troublesome in 2017 and beyond." "Experian's annual Data Breach Forecast has proven to be great insight for cyber and risk management professionals, particularly in the healthcare sector as the industry adopts emerging technology at a record pace, creating an ever wider cyber-attack surface, adds Ann Patterson, senior vice president, Medical Identity Fraud Alliance (MIFA). "The consequences of a medical data breach are wide-ranging, with devastating effects across the board - from the breached entity to consumers who may experience medical ID fraud to the healthcare industry as a whole. There is no silver bullet for cybersecurity, however, making good use of trends and analysis to keep evolving our cyber protections along with forecasted threats is vital." "The 72 hour notice requirement to EU authorities under the GDPR is going to put U.S.-based organizations in a difficult situation, said Dominic Paluzzi, co-chair of the Data Privacy & Cybersecurity Practice at McDonald Hopkins. "The upcoming EU law may just have the effect of expediting breach notification globally, although 72 hour notice from discovery will be extremely difficult to comply with in many breaches. Organizations' incident response plans should certainly be updated to account for these new laws set to go in effect in 2017." Omer Tene, Vice President of Research and Education for International Association of Privacy Professionals, added "Clearly, the biggest challenge for businesses in 2017 will be preparing for the entry into force of the GDPR, a massive regulatory framework with implications for budget and staff, carrying stiff fines and penalties in an unprecedented amount. Against a backdrop of escalating cyber events, such as the recent attack on Internet backbone orchestrated through IoT devices, companies will need to train, educate and certify their staff to mitigate personal data risks." Download Whitepaper: Fourth Annual 2017 Data Breach Industry Forecast Learn more about the five industry predictions, and issues such as ransomware and international breach notice laws in our the complimentary white paper. Click here to learn more about our fraud products, find additional data breach resources, including webinars, white papers and videos.

How will the FinCEN revisions impact your business? (Part 2) I recently discussed the new FinCEN requirements to Customer Due Diligence. This time, I’d like to focus on the recent FinCEN advisory regarding “email-compromise fraud.” This new advisory sheds additional light on the dual threats of both Email Account Compromise impacting the general public and Business Email Compromise that targets businesses. FinCEN has rightly identified and communicated several high-risk conditions common to the perpetration of scams such as varied languages, slight alterations in email addresses, out-of-norm account and transaction information, and social engineering in the form of follow-up requests for additional transfers. In addition to introducing operational standards to detect such conditions, institutions also would benefit from these other tactics and focal points as they respond to email requests for financial transfers: Email validation and verification — use of third-party vendor services that can deliver a measurable level of confidence in the association of an email address to an actual, true identity. Multifactor authentication — use of dual-step or out-of-band verification of the requested transaction using alternate channels such as phone. Robust KYC/CIP at application and account opening to ensure that name, address, date of birth and Social Security number are verified and positively and consistently linked to a single identity, as well as augmented with phone and email verification and association for use in customer communications and multifactor authentications. Customer transactional monitoring in the form of establishing typical or normal transfer activity and thresholds for outlying variations of concern. Known and suspected fraud databases updated in real time or near real time for establishing blacklist emails to be segmented as high risk or declines upon receipt. Identity application and transactional link analysis to monitor for and detect the use of shared and manipulated email addresses across multiple transaction requests for disparate identities. Access to device intelligence and risk assessment to ensure consistent association of a true customer with one or more trusted devices and to detect variance in those trusted associations. Which of these 7 tactics are you using to stop email-compromise fraud?

In order to compete for consumers and to enable lender growth, creating operational efficiencies such as automated decisioning is a must. Unfortunately, somewhere along the way, automated decisioning unfairly earned a reputation for being difficult to implement, expensive and time consuming. But don’t let that discourage you from experiencing its benefits. Let’s take a look at the most popular myths about auto decisioning. Myth #1: Our system isn’t coded. If your system is already calling out for Experian credit reporting data, a very simple change in the inquiry logic will allow your system to access Decisioning as a ServiceSM. Myth #2: We don’t have enough IT resources. Decisioning is typically hosted and embedded within an existing software that most credit unions currently use – thus eliminating or minimizing the need for IT. A good system will allow configuration changes at any time by a business administrator and should not require assistance from a host of IT staff, so the demand on IT resources should decrease. Decisioning as a Service solutions are designed to be user friendly to shorten the learning curve and implementation time. Myth #3: It’s too expensive. Sure, there are highly customized products out there that come with hefty price tags, but there are also automated solutions available that suit your budget. Configuring a product to meet your needs and leaving off any extra bells and whistles that aren’t useful to your organization will help you stick to your allotted budget. Myth #4: Low ROI. Oh contraire…Clients can realize significant return-on-investment with automated decisioning by booking more accounts … 10 percent increase or more in booked accounts is typical. Even more, clients typically realize a 10 percent reduction in bad debt and manual review costs, respectively. Simply estimating the value of each of these things can help populate an ROI for the solution. Myth #5: The timeline to implement is too long. It’s true, automation can involve a lot of functions and tasks – especially if you take it on yourself. By calling out to a hosted environment, Experian’s Decisioning as a Service can take as few as six weeks to implement since it simply augments a current system and does not replace a large piece of software. Myth #6: Manual decisions give a better member experience. Actually, manual decisions are made by people with their own points of view, who have good days and bad days and let recent experiences affect new decisions. Automated decisioning returns a consistent response, every time. Regulators love this! Myth #7: We don’t use Experian data. Experian’s Decisioning as a Service is data agnostic and has the ability to call out to many third-party data sources and configure them to be used in decisioning. --- These myth busters make a great case for implementing automated decisioning in your loan origination system instead of a reason to avoid it. Learn more about Decisioning as a Service and how it can be leveraged to either augment or overhaul your current decisioning platforms.

Reinventing Identity for the Digital Age Electronic Signature & Records Association (ESRA) conference I recently had the opportunity to speak at the Electronic Signature & Records Association (ESRA) conference in Washington D.C. I was part of a fantastic panel delving into the topic, ‘Reinventing Identity for the Digital Age.’ While certainly hard to do in just an hour, we gave it a go and the dialogue was engaging, healthy in debate, and a conversation that will continue on for years to come. The entirety of the discussion could be summarized as: An attempt to directionally define a digital identity today The future of ownership and potential monetization of trusted identities And the management of identities as they reside behind credentials or the foundations of block chain Again, big questions deserving of big answers. What I will suggest, however, is a definition of a digital identity to debate, embrace, or even deride. Digital identities, at a minimum, should now be considered as a triad of 1) verified personally identifiable information, 2) the collective set of devices through which that identity transacts, and 3) the transactional (monetary or non-monetary) history of that identity. Understanding all three components of an identity can allow institutions to engage with their customers with a more holistic view that will enable the establishment of omni-channel communications and accounts, trusted access credentials, and customer vs. account-level risk assessment and decisioning. In tandem with advances in credentialing and transactional authorization such as biometrics, block chain, and e-signatures, focus should also remain on what we at Experian consider the three pillars of identity relationship management: Identity proofing (verification that the person is who they claim to be at a specific point in time) Authentication (ongoing verification of a person’s identity) Identity management (ongoing monitoring of a person’s identity) As stronger credentialing facilitates more trust and open functionality in non-face-to-face transactions, more risk is inherently added to those credentials. Therefore, it becomes vital that a single snapshot approach to traditionally transaction-based authentication is replaced with a notion of identity relationship management that drives more contextual authentication. The context thus expands to triangulate previous identity proofing results, current transactional characteristics (risk and reward), and any updated risk attributes associated with the identity that can be gleaned. The bottom line is that identity risk changes over time. Some identities become more trustworthy … some become less so. Better credentials and more secure transactional rails improve our experiences as consumers and better protect our personal information. They cannot, however, replace the need to know what’s going on with the real person who owns those credentials or transacts on those rails. Consumers will continue to become more owners of their digital identity as they grant access to it across multiple applications. Institutions are already engaged in strategies to monetize trusted and shareable identities across markets. Realizing the dynamic nature of identity risk, and implementing methods to measure that risk over time, will better enable those two initiatives. Click here to read more about Identity Relationship Management.

How will the FinCEN revisions impact your business? (Part 1) Some recently published FinCEN revisions and advisories are causing a stir. First, let’s look at revisions to Customer Due Diligence that require compliance by May 2018. Under the updated requirements for Customer Due Diligence, covered financial institutions must expand programs, including Customer Identification Programs (CIP), to include Beneficial Owners of Legal Entity customers. Under the new rule, financial institutions must collect and verify identity information (name, address, date of birth, Social Security number or passport number for foreign individuals): For each Natural Person with at least 25% ownership in the Legal entity and For an individual with significant responsibility for managing or controlling the business — for example, a chief executive officer, a chief financial officer, a chief operating officer, a managing member, a general partner, a president, a vice president or a treasurer The U.S. Treasury estimates that illicit proceeds generated in the United States alone total $400 billion annually. These requirements are intended to prevent anonymous access to financial systems through shielded or minority ownership. While the effort to stem the tide of illicit proceeds is laudable, the impact to business may be significant. Most organizations will need to audit their data collection practices, and many will need to make changes to either data collection or workflow processes to ensure compliance. While quite simple and straightforward on paper, the standardization of additional CIP policies and procedures tend to create substantive impact to the customer experience as well as operational resource allocations and utilization. Covered financial institutions should already be discussing with their current or prospective fraud risk and identity management vendors to ensure that: There is a clear path to altering both data collection and verification of these additional identity elements. Clear and accurate benchmarking around expected verification rates is available ahead of the compliance date to allow for operational workflow design to accommodate both ‘verifications’ and ‘referrals stemming from lack of full verification.’ Service providers are granting access to best-in-class data assets and search & match logic related to identity element verification and risk assessment, along with multi-layered options to reconcile those initial verification ‘fails.’ Full business reviews and strategy design sessions are underway or being scheduled to align and document overall objectives of the program, benchmarking of leading industry practices, current and future state gaps, near- and long-term initiatives and a prioritized roadmap, a viable business case toward additional investment in services and resources, and a plan of execution. Will this impact your business? Will you need to make any changes? Click here to read part two - FinCEN and email-compromise fraud.
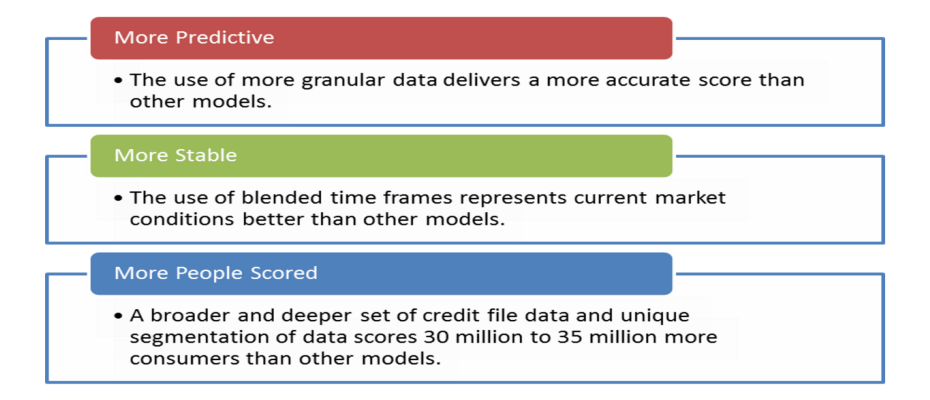
Lenders are looking for ways to accurately score more consumers and grow their applicant pool without increasing risk. And it looks like more and more are turning to the VantageScore® credit score to help achieve their goals. So, who’s using the VantageScore® credit score? 9 of the top 10 financial institutions. 18 of the top 25 credit card issuers. 21 of the top 25 credit unions. VantageScore leverages the collective experience of the industry’s leading experts on credit data, modeling and analytics to provide a more consistent and highly predictive credit score. >>Want to know more?

For members of the U.S. military, relocating often, returning home following a lengthy deployment and living with uncertainty isn’t easy. It can take an emotional and financial toll, and many are unprepared for their economic reality after they separate from the military. As we honor those who have served our country this Veterans Day, we are highlighting some of the special financial benefits and safeguards available to help veterans. Housing Help One of the best benefits offered to service members is the Veteran’s Administration (VA) home-loan program. Loan rates are competitive, and the VA guarantees up to 25 percent of the payment on the loan, making it one of the only ways available to buy a home with no down payment and no private mortgage insurance. Debt Relief Having a VA loan qualifies military members for a Military Debt Consolidation Loan (MDCL) that can help with overcoming financial difficulties. The MDCL is similar to a debt consolidation loan: take out one loan to pay off all unsecured debts, such as credit cards, medical bills and payday loans, and make a single payment to one lender. The advantage of a MDCL? Paying a lower interest rate and closing costs than civilians and far less interest than paying the same bills with credit cards. These refinancing loans can be spread out over 10, 15 and sometimes 30 years. Education Benefits The GI Bill is arguably the best benefit for veterans and members of the armed forces. It helps service members pay for higher education for themselves and their dependents, and is one of the top reasons people enlist. Eligible service members receive up to 36 months of education benefits, based on the type of training, length of service, college fund availability and whether he or she contributed to a buy-up program while on active duty. Benefits last up to 10 years, but the time limit may be extended. Saving & Investing Money According to the Department of Defense’s annual Demographics Report, 87 percent of military families contribute to a retirement account. Service members who participated in the Thrift Savings Plan, however, are often unaware of their options after they separate from service, and many don’t realize the advantages of rolling their plans into an IRA or retirement plan of a new employer. Safeguarding Identity Everyone is a potential identity theft target, but military personnel and veterans are particularly vulnerable. Routinely reviewing a credit report is one way to detect a breach. The Attorney General's Office provides general information about what steps to take to recover from identify theft or fraud. Today is a great time to consider ways to support your veteran and active military consumers. They are deserving of our support and recognition not just today but continuously. Learn more about services for veterans and active military to understand the varying protections, and how financial institutions can best support military credit consumers and their families.
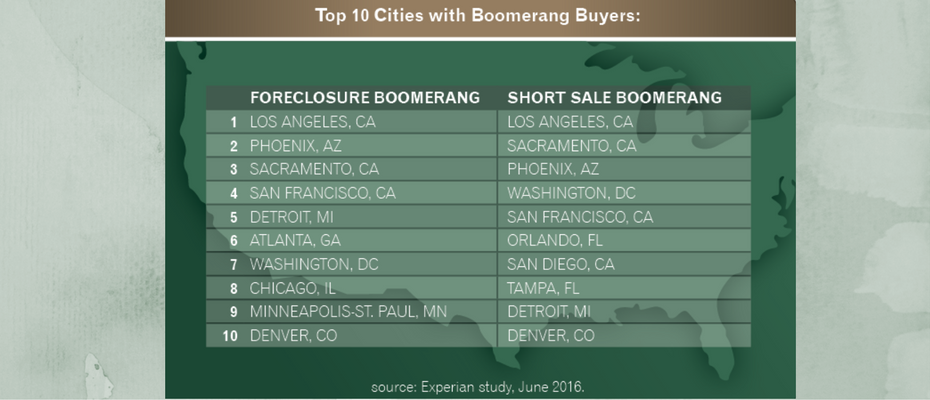
A recent Experian analysis shows that about 2.5 million consumers will have a foreclosure, short sale or bankruptcy fall off their credit report between June 2016 and June 2017 — with 68% of these consumers scoring in the near-prime or high credit segments. Additional highlights include: Nearly 29% of those who short-sold between 2007 and 2010 have opened a new mortgage. Delinquencies for this group are below the national average for bankcard and auto loan payments. More than 12% of those who foreclosed now have boomeranged (opened new mortgages). With millions of borrowers potentially re-entering the housing market, the trends are promising for both the mortgage seeker and the lender. Want to know more?

U.S. Communities national contract awarded to Experian to use their data and analytic solutions in order to enable state and local government agencies to help consumers and better serve their communities for the future.

Much has been written about Millennials over the past few years, and many continue to speculate on how this now largest living generation will live, age and ultimately change the world. Will they still aspire to achieve the “American Dream” of education, home and raising a family? Do they wish for something different? Or has the “Dream” simply been delayed with so many individuals saddled with record-high student loan debt? According to a recent study by Pew, for the first time in more than 130 years, adults ages 18 to 34 were slightly more likely to be living in their parents’ home than they were to be living with a spouse or partner in their own household. It’s no secret the median age of first marriage has risen steadily for decades. In fact, a growing share of young adults may be eschewing marriage altogether. Layer on the story that about half of young college graduates between the ages of 22 and 27 are said to be “underemployed”—working in a job that hasn’t historically required a college degree – and it’s clear if nothing else that the “American Dream” for many Millennials has been delayed. So what does this all mean for the world of homeownership? While some experts warn the homeownership rate will continue to decrease, others – like Freddie Mac – believe that sentiment is overly pessimistic. Freddie Mac Chief Economist Sean Becketti says, “The income and education gaps that are responsible for some of the differences may be narrowed or eliminated as the U.S. becomes a 'majority minority' country.” Mortgage interest rates are still near historic lows, but home prices are rising far faster than incomes, negating much of the savings from these low rates. Experian has taken the question a step further, diving into not just “Do Millennials want to buy homes” but “Can Millennials buy homes?” Using mortgage readiness underwriting criteria, the bureau took a large consumer sample and assessed Millennial mortgage readiness. Experian then worked with Freddie Mac to identify where these “ready” individuals had the best chance of finding homes. The two factors that had the strongest correlation on homeownership were income and being married. From a credit perspective, 33 percent of the sample had strong or moderate credit, while 50 percent had weak credit. While the 50 percent figure is startling, it is important to note 40 percent of that grouping consisted of individuals aged 18 to 26. They simply haven’t had enough time to build up their credit. Second, of the weak group, 31 percent were “near-moderate,” meaning their VantageScore® credit score is 601 to 660, so they are close to reaching a “ready” status. Overall, student debt and home price had a negative correlation on homeownership. In regards to regions, Millennials are most likely to live in places where they can make money, so urban hubs like Los Angeles, San Francisco, Chicago, Dallas, Houston, Boston, New York and DC currently serve as basecamp for this group. Still, when you factor in affordability, findings revealed the Greater New York, Houston and Miami areas would be good areas for sourcing Millennials who are mortgage ready and matching them to affordable inventory. Complete research findings can be accessed in the Experian-Freddie Mac co-hosted webinar, but overall signs indicate Millennials are increasingly becoming “mortgage ready” as they age, and will soon want to own their slice of the “American Dream.” Expect the Millennial homeownership rate of 34 percent to creep higher in the years to come. Brokers, lenders and realtors get ready.

In this age of content and increasing financial education available to all, most entities are familiar with credit bureaus, including Experian. They are known for housing enormous amounts of data, delivering credit scores and helping businesses decision on credit. On the consumer side, there are certainly myths about credit scores and the credit report. But myths exist among businesses as well, especially as it pertains to the topic of reporting credit data. How does it work? Who’s responsible? Does reporting matter if you’re a small lender? Let’s tackle three of the most common myths surrounding credit reporting and shine a light on how it really is essential in creating a healthy credit ecosystem. Myth No. 1: Reporting to one bureau is good enough. Well, reporting to one bureau is definitely better than reporting to none, but without reporting to all three bureaus, there could be gaps in a consumer’s profile. Why? When a lender pulls a consumer’s profile to evaluate it for extending additional credit, they ideally would like to see a borrower’s complete credit history. So, if one of their existing trades is not being reported to one bureau, and the lender makes a credit pull from a different bureau to use for evaluation purposes, no knowledge of that trade exists. In cases like these, credit grantors may offer credit to your customer, not knowing the customer already has an obligation to you. This may result in your customer getting over-extended and negatively impacting their ability to pay you. On the other side, in the cases of a thin-file consumer, not having that comprehensive snapshot of all trades could mean they continue to look “thin” to other lenders. The best thing you can do for a consumer is report to all three bureaus, making their profile as robust as it can be, so lenders have the insights they need to make informed credit offers and decisions. Some believe the bureaus are regional, meaning each covers a certain part of the country, but this is false. Each of the bureaus are national and lenders can report to any and all. Myth No. 2: Reporting credit data is hard. Yes, accurate and timely data reporting requires a few steps, but after you get familiar with Metro 2, the industry standard format for consumer data reporting, choose a strategy, and register for e-Oscar, the process is set. The key is to do some testing, and also ensure the data you pass is accurate. Myth No. 3: Reporting credit data is a responsibility for the big institutions –not smaller lenders and companies. For all lenders, credit bureau data is vitally important in making informed risk determinations for consumer and small business loans. Large financial institutions have been contributing to the ecosystem forever. Many smaller regional banks and credit unions have reported consistently as well. But just think how much stronger the consumer credit profile would be if all lenders, utility companies and telecom businesses reported? Then you would get a true, complete view into the credit universe, and consumers benefit by having the most comprehensive profile --- Bottom line is that when comprehensive data on consumer credit histories is readily available, it’s a good thing for consumers and lenders. And the truth is all businesses - big and small - can make this a reality.

Historically, the introduction of EMV chip technology has resulted in a significant drop in card-present fraud, but a spike in card-not-present (CNP) fraud. CNP fraud accounts for 60% to 70% of all card fraud in many countries and is increasing. Merchants and card issuers in the United States likely will see a rise in CNP fraud as EMV migration occurs — although it may be more gradual as issuers and merchants upgrade to chip-based cards. As fraud continues to evolve, so too should your fraud-prevention strategies. Make a commitment to stay abreast of the latest fraud trends and implement sophisticated, cross-channel fraud-prevention strategies. >>Protecting Growth Ambitions Against Rising Fraud Threats

Prescriptive solutions: Get the Rx for your right course of action By now, everyone is familiar with the phrase “big data” and what it means. As more and more data is generated, businesses need solutions to help analyze data, determine what it means and then assist in decisioning. In the past, solutions were limited to simply describing data by creating attributes for use in decisioning. Building on that, predictive analytics experts developed models to predict behavior, whether that was a risk model for repayment, a propensity model for opening a new account or a model for other purposes. The next evolution is prescriptive solutions, which go beyond describing or predicting behaviors. Prescriptive solutions can synthesize big data, analytics, business rules and strategies into an environment that provides businesses with an optimized workflow of suggested options to reach a final decision. Be prepared — developing prescriptive solutions is not simple. In order to fully harness the value of a prescriptive solution, you must include a series of minimum capabilities: Flexibility — The solution must provide users the ability to make quick changes to strategies to adjust to market forces, allowing an organization to pivot at will to grow the business. A system that lacks agility (for instance, one that relies heavily on IT resources) will not be able to realize the full value, as its recommendations will fall behind current market needs. Expertise — Deep knowledge and a detailed understanding of complex business objectives are necessary to link overall business goals to tactical strategies and decisions made about customers. Analytics — Both descriptive and predictive analytics will play a role here. For instance, the use of a layered score approach in decisioning — what we call dimensional decisioning — can provide significant insight into a target market or customer segment. Data — It is assumed that most businesses have more data than they know what to do with. While largely true, many organizations do not have the ability to access and manage that data for use in decision-making. Data quality is only important if you can actually make full use of it. Let’s elaborate on this last point. Although not intuitive, the data you use in the decision-making process should be the limiting factor for your decisions. By that, I mean that if you get the systems, analytics and strategy components of the equation right, your limitation in making decisions should be data-driven, and not a result of another part of the decision process. If your prescriptive environment is limited by gaps in flexibility, expertise or analytic capabilities, you are not going to be able to extract maximum value from your data. With greater ability to leverage your data — what I call “prescriptive capacity” — you will have the ability to take full advantage of the data you do have. Taking big data from its source through to the execution of a decision is where prescriptive solutions are most valuable. Ultimately, for a business to lead the market and gain a competitive advantage over its competitors — those that have not been able to translate data into meaningful decisions for their business — it takes a combination of the right capabilities and a deep understanding of how to optimize the ecosystem of big data, analytics, business rules and strategies to achieve success.