Customer Targeting & Segmentation

It’s December, and if you’re like most credit union leaders, your strategic plan is distributed, and the 2020 budget is approved. Before you know it, you and your team will be off and running to pursue the New Year’s goals. Another thing most of us have in common is a strategic membership growth priority. New members are needed to help us take loan and deposit growth to the next level. Specifically, who are you looking for? It’s surprising how many credit union leaders have a difficult time clarifying their ideal member(s). They usually come up short after they have called out younger borrowers, active checking account users, prime credit, middle income, homeowners, etc. The reality is in today’s competitive market, these general audiences are not definitive enough. Many then go to market with a limited universe that is too generic to be highly effective. Savvy marketers have a much deeper understanding of who they are reaching and why. First, they have clearly defined the ideal member i.e. product profitability, relationship profitability, referrals, how they access the credit union, etc. Second, they use data, analytics and demographic segmenting to refine their search further to reveal the ideal member. They leverage information to understand what drives the potential members decision making. They understand that every potential member does not live the same type of life. They segment markets into groups to understand their shared values and life experiences. These segments include geographic, demographic, financial behavior, and motivation that includes psychographics and social values. Thus, armed with this information, they align the consumer’s needs with the credit union’s products, purpose and strategic goals. This clarity allows them to invest their marketing dollars for the best possible result. Most credit unions would identify “younger borrowers” as a desired member, so we’ve laid out two examples of just how different this member can look. Ambitious Singles – is a demographic segment comprised of younger cutting-edge singles living in mid-scale, metro areas that balance work and leisure lifestyles. Annual Median income $75k - $100K Highly educated First time home buyers Professionals, upwardly mobile Channel preferences for engaging with brands (and their offers) is while watching or streaming TV, listening to their favorite radio apps or while browsing the web on their phones. They are also quite email receptive (but subject lines must be compelling) Families Matter Most – This segment is comprised of young middle-class families in scenic suburbs, leading family focused lives. Annual Median income $75K - $99K Have children 4-6 yrs. old Educated Homeowners Child-related purchases Credit revolver and auto borrowers (larger vehicles) Go online for banking, telecommuting and shopping Both segments represent younger borrowers with similar incomes, but they have different loan needs, lifestyle priorities and preferences for engaging with a marketing offer. These are just two examples of the segmentation data that is available from Experian. The segmentation solution provides a framework to help credit unions identify the optimal customer investment strategy for each member segment. This framework helps the credit union optimize their marketing between differentiating segments. For some segments the investment may be directed toward finding the ideal member. Others may be made to find depositors. While many credit unions don’t have infinite marketing budgets or analytical resources, segmentation help marketers more efficiently and effectively pursue the best member or develop member personas to better resonate with existing members. The feedback we have heard from credit union leaders is that the solution is the best segmentation tool they have seen. Learn more about it here. What your team is up against Today, credit unions face national competitors that are using state-of-the-art data analytics, first-rate technology and in-depth market segmentation to promote very attractive offers to win new members, deposits, checking accounts and loans. Their offers have a look, feel, message and offer that are relevant to the person receiving the offer. Here are a few recent “offer” examples that we have heard of that should give you pause: Fintech companies, like the Lending Club offering auto loan refinances (the offer provides an estimate of refinance interest savings). The ad we saw had an estimated monthly payment of $80. PayPal Cashback Mastercard® – with a $300 early use cash bonus and 3% cash back on purchases. High limit personal loans that take minutes to apply and to be funded. Banks acting alone or in partnership with a fintech to offer online checking accounts with new account opening bonuses ranging from $300-$600. and of course, Quicken® Mortgage promoting low rates and fast and seamless origination. These are just a few recent examples from thousands of offers that are reaching your ideal member. Besides offering great rates, cash back, low fees and seamless service – these offers are guided by robust data analytics and consumer segmentation to reach and engage a well-defined, ideal consumer. Why it matters The 2020 race is on. Hopefully your team has clarity of the member(s) they want to reach, access to robust data analytics, in depth consumer insights, reliable credit resources and marketing tools they will need to compete in the toughest financial market any of us have likely ever seen. If you’re afraid that you can’t afford the right tools when it comes to marketing, consider what the dealer fee is for purchasing an indirect auto loan. What if the 2% or more fee was reallocated to finding organic loan growth with consumers you’re more likely to build a relationship with? Or consider the cost of consistently marketing to the wrong consumer segments with the wrong message, at the wrong time and in the wrong channels. What if you could increase your market engagement rate from 5% to 10%? Perhaps the best strategic question is can you afford NOT to have the best tools that support future membership growth? If you don’t win your ideal member, somebody else will. Learn More About Scott Butterfield, CUDE, CCUE Principal, Your Credit Union Partner Scott Butterfield is a trusted advisor to the leaders of more than 170 credit unions located throughout the United States. A respected veteran of the CU Movement, he understands the challenges and opportunities facing credit unions today. Scott believes that credit unions matter, and that consumers and small businesses need credit unions to now more than ever.

Article written by Melanie Smith, Senior Copywriter, Experian Clarity Services, Inc. It’s been almost a decade since the Great Recession in the United States ended, but consumers continue to feel its effects. During the recession, millions of Americans lost their jobs, retirement savings decreased, real estate reduced in value and credit scores plummeted. Consumers that found themselves impacted by the financial crisis often turned to alternative financial services (AFS). Since the end of the recession, customer loyalty and retention has been a focus for lenders, given that there are more options than ever before for AFS borrowers. To determine what this looks like in the current climate, we examined today’s non-prime consumers, what their traditional scores look like and if they are migrating to traditional lending. What are alternative financial services (AFS)? Alternative financial services (AFS) is a term often used to describe the array of financial services offered by providers that operate outside of traditional financial institutions. In contrast to traditional banks and credit unions, alternative service providers often make it easier for consumers to apply and qualify for lines of credit but may charge higher interest rates and fees. More than 50% of new online AFS borrowers were first seen in 2018 To determine customer loyalty and fluidity, we looked extensively at the borrowing behavior of AFS consumers in the online marketplace. We found half of all online borrowers were new to the space as of 2018, which could be happening for a few different reasons. Over the last five years, there has been a growing preference to the online space over storefront. For example, in our trends report from 2018, we found that 17% of new online customers migrated from the storefront single pay channel in 2017, with more than one-third of these borrowers from 2013 and 2014 moving to online overall. There was also an increase in AFS utilization by all generations in 2018. Additionally, customers who used AFS in previous years are now moving towards traditional credit sources. 2017 AFS borrowers are migrating to traditional credit As we examined the borrowing behavior of AFS consumers in relation to customer loyalty, we found less than half of consumers who used AFS in 2017 borrowed from an AFS lender again in 2018. Looking into this further, about 35% applied for a loan but did not move forward with securing the loan and nearly 24% had no AFS activity in 2018. We furthered our research to determine why these consumers dropped off. After analyzing the national credit database to see if any of these consumers were borrowing in the traditional credit space, we found that 34% of 2017 borrowers who had no AFS activity in 2018 used traditional credit services, meaning 7% of 2017 borrowers migrated to traditional lending in 2018. Traditional credit scores of non-prime borrowers are growing After discovering that 7% of 2017 online borrowers used traditional credit services in 2018 instead of AFS, we wanted to find out if there had also been an improvement in their credit scores. Historically, if someone is considered non-prime, they don’t have the same access to traditional credit services as their prime counterparts. A traditional credit score for non-prime consumers is less than 600. Using the VantageScore® credit score, we examined the credit scores of consumers who used and did not use AFS in 2018. We found about 23% of consumers who switched to traditional lending had a near-prime credit score, while only 8% of those who continued in the AFS space were classified as near-prime. Close to 10% of consumers who switched to traditional lending in 2018 were classified in the prime category. Considering it takes much longer to improve a traditional credit rating, it’s likely that some of these borrowers may have been directly impacted by the recession and improved their scores enough to utilize traditional credit sources again. Key takeaways AFS remains a viable option for consumers who do not use traditional credit or have a credit score that doesn’t allow them to utilize traditional credit services. New AFS borrowers continue to appear even though some borrowers from previous years have improved their credit scores enough to migrate to traditional credit services. Customers who are considered non-prime still use AFS, as well as some near-prime and prime customers, which indicates customer loyalty and retention in this space. For more information about customer loyalty and other recently identified trends, download our recent reports. State of Alternative Data 2019 Lending Report

Fintech is quickly changing. The word itself is synonymous with constant innovation, agile technology structures and being on the cusp of the future of finance. The rapid rate at which fintech challengers are becoming established, is in turn, allowing for greater consumer awareness and adoption of fintech platforms. It would be easy to assume that fintech adoption is predominately driven by millennials. However, according to a recent market trend analysis by Experian, adoption is happening across multiple generational segments. That said, it’s important to note the generational segments that represent the largest adoption rates and growth opportunities for fintechs. Here are a few key stats: Members of Gen Y (between 24-37 years old) account for 34.9% of all fintech personal loans, compared to just 24.9% for traditional financial institutions. A similar trend is seen for Gen Z (between 18-23 years old). This group accounts for 5% of all fintech personal loans as compared to 3.1% for traditional Let’s take a closer look at these generational segments… Gen Y represents approximately 19% of the U.S. population. These consumers, often referred to as “millennials,” can be described as digital-centric, raised on the web and luxury shoppers. In total, millennials spend about $600 billion a year. This group has shown a strong desire to improve their credit standing and are continuously increasing their credit utilization. Gen Z represents approximately 26% of the U.S. population. These consumers can be described as digital centric, raised on the social web and frugal. The Gen Z credit universe is growing, presenting a large opportunity to lenders, as the youngest Gen Zers become credit eligible and the oldest start to enter homeownership. What about the underbanked as a fintech opportunity? The CFPB estimates that up to 45 million people, or 24.2 million households, are “thin-filed” or underbanked, meaning they manage their finances through cash transactions and not through financial services such as checking and savings accounts, credit cards or loans. According to Angela Strange, a general partner at Andreessen Horowitz, traditional financial institutions have done a poor job at serving underbanked consumers affordable products. This has, in turn, created a trillion-dollar market opportunity for fintechs offering low-cost, high-tech financial services. Why does all this matter? Fintechs have a unique opportunity to engage, nurture and grow these market segments early on. As the fintech marketplace heats up and the overall economy begins to soften, diversifying revenue streams, building loyalty and tapping into new markets is a strategic move. But what are the best practices for fintechs looking to build trust, engage and retain these unique consumer groups? Join us for a live webinar on November 12 at 10:00 a.m. PST to hear Experian experts discuss financial inclusion trends shaping the fintech industry and tactical tips to create, convert and extend the value of your ideal customers. Register now

Retailers are already starting to display their Christmas decorations in stores and it’s only early November. Some might think they are putting the cart ahead of the horse, but as I see this happening, I’m reminded of the quote by the New York Yankee’s Yogi Berra who famously said, “It gets late early out there.” It may never be too early to get ready for the next big thing, especially when what’s coming might set the course for years to come. As 2019 comes to an end and we prepare for the excitement and challenges of a new decade, the same can be true for all of us working in the lending and credit space, especially when it comes to how we will approach the use of alternative data in the next decade. Over the last year, alternative data has been a hot topic of discussion. If you typed “alternative data and credit” into a Google search today, you would get more than 200 million results. That’s a lot of conversations, but while nearly everyone seems to be talking about alternative data, we may not have a clear view of how alternative data will be used in the credit economy. How we approach the use of alternative data in the coming decade is going to be one of the most important decisions the lending industry makes. Inaction is not an option, and the time for testing new approaches is starting to run out – as Yogi said, it’s getting late early. And here’s why: millennials. We already know that millennials tend to make up a significant percentage of consumers with so-called “thin-file” credit reports. They “grew up” during the Great Recession and that has had a profound impact on their financial behavior. Unlike their parents, they tend to have only one or two credit cards, they keep a majority of their savings in cash and, in general, they distrust financial institutions. However, they currently account for more than 21 percent of discretionary spend in the U.S. economy, and that percentage is going to expand exponentially in the coming decade. The recession fundamentally changed how lending happens, resulting in more regulation and a snowball effect of other economic challenges. As a result, millennials must work harder to catch up financially and are putting off major life milestones that past generations have historically done earlier in life, such as homeownership. They more often choose to rent and, while they pay their bills, rent and other factors such as utility and phone bill payments are traditionally not calculated in credit scores, ultimately leaving this generation thin-filed or worse, credit invisible. This is not a sustainable scenario as we enter the next decade. One of the biggest market dynamics we can expect to see over the next decade is consumer control. Consumers, especially millennials, want to be in the driver’s seat of their “credit journey” and play an active role in improving their financial situations. We are seeing a greater openness to providing data, which in turn enables lenders to make more informed decisions. This change is disrupting the status quo and bringing new, innovative solutions to the table. At Experian, we have been testing how advanced analytics and machine learning can help accelerate the use of alternative data in credit and lending decisions. And we continue to work to make the process of analyzing this data as simple as possible, making it available to all lenders in all verticals. To help credit invisible and thin-file consumers gain access to fair and affordable credit, we’ve recently announced Experian Lift, a new suite of credit score products that combines exclusive traditional credit, alternative credit and trended data assets to create a more holistic picture of consumer creditworthiness that will be available to lenders in early 2020. This new Experian credit score may improve access to credit for more than 40 million credit invisibles. There are more than 100 million consumers who are restricted by the traditional scoring methods used today. Experian Lift is another step in our commitment to helping improve financial health of consumers everywhere and empowers lenders to identify consumers who may otherwise be excluded from the traditional credit ecosystem. This isn’t just a trend in the United States. Brazil is using positive data to help drive financial inclusion, as are others around the world. As I said, it’s getting late early. Things are moving fast. Already we are seeing technology companies playing a bigger role in the push for alternative data – often powered by fintech startups. At the same time, there also has been a strong uptick in tech companies entering the banking space. Have you signed up for your Apple credit card yet? It will take all of 15 seconds to apply, and that’s expected to continue over the next decade. All of this is changing how the lending and credit industry must approach decision making, while also creating real-time frictionless experiences that empower the consumer. We saw this with the launch of Experian Boost earlier this year. The results speak for themselves: hundreds of thousands of previously thin-file consumers have seen their credit scores instantly increase. We have also empowered millions of consumers to get more control of their credit by using Experian Boost to contribute new, positive phone, cable and utility payment histories. Through Experian Boost, we’re empowering consumers to play an active role in building their credit histories. And, with Experian Lift, we’re empowering lenders to identify consumers who may otherwise be excluded from the traditional credit ecosystem. That’s game-changing. Disruptions like Experian Boost and newly announced Experian Lift are going to define the coming decade in credit and lending. Our industry needs to be ready because while it may seem early, it’s getting late.

It seems like artificial intelligence (AI) has been scaring the general public for years – think Terminator and SkyNet. It’s been a topic that’s all the more confounding and downright worrisome to financial institutions. But for the 30% of financial institutions that have successfully deployed AI into their operations, according to Deloitte, the results have been anything but intimidating. Not only are they seeing improved performance but also a more enhanced, positive customer experience and ultimately strong financial returns. For the 70% of financial institutions who haven’t started, are just beginning their journey or are in the middle of implementing AI into their operations, the task can be daunting. AI, machine learning, deep learning, neural networks—what do they all mean? How do they apply to you and how can they be useful to your business? It’s important to demystify the technology and explain how it can present opportunities to the financial industry as a whole. While AI seems to have only crept into mainstream culture and business vernacular in the last decade, it was first coined by John McCarthy in 1956. A researcher at Dartmouth, McCarthy thought that any aspect of learning or intelligence could be taught to a machine. Broadly, AI can be defined as a machine’s ability to perform cognitive functions we associate with humans, i.e. interacting with an environment, perceiving, learning and solving problems. Machine learning vs. AI Machine learning is not the same thing as AI. Machine learning is the application of systems or algorithms to AI to complete various tasks or solve problems. Machine learning algorithms can process data inputs and new experiences to detect patterns and learn how to make the best predictions and recommendations based on that learning, without explicit programming or directives. Moreover, the algorithms can take that learning and adapt and evolve responses and recommendations based on new inputs to improve performance over time. These algorithms provide organizations with a more efficient path to leveraging advanced analytics. Descriptive, predictive, and prescriptive analytics vary in complexity, sophistication, and their resulting capability. In simplistic terms, descriptive algorithms describe what happened, predictive algorithms anticipate what will happen, and prescriptive algorithms can provide recommendations on what to do based on set goals. The last two are the focus of machine learning initiatives used today. Machine learning components - supervised, unsupervised and reinforcement learning Machine learning can be broken down further into three main categories, in order of complexity: supervised, unsupervised and reinforcement learning. As the name might suggest, supervised learning involves human interaction, where data is loaded and defined and the relationship to inputs and outputs is defined. The algorithm is trained to find the relationship of the input data to the output variable. Once it delivers accurately, training is complete, and the algorithm is then applied to new data. In financial services, supervised learning algorithms have a litany of uses, from predicting likelihood of loan repayment to detecting customer churn. With unsupervised learning, there is no human engagement or defined output variable. The algorithm takes the input data and structures it by grouping it based on similar characteristics or behaviors, without a defined output variable. Unsupervised learning models (like K-means and hierarchical clustering) can be used to better segment or group customers by common characteristics, i.e. age, annual income or card loyalty program. Reinforcement learning allows the algorithm more autonomy in the environment. The algorithm learns to perform a task, i.e. optimizing a credit portfolio strategy, by trying to maximize available rewards. It makes decisions and receives a reward if those actions bring the machine closer to achieving the total available rewards, i.e. the highest acquisition rate in a customer category. Over time, the algorithm optimizes itself by correcting actions for the best outcomes. Even more sophisticated, deep learning is a category of machine learning that involves much more complex architecture where software-based calculators (called neurons) are layered together in a network, called a neural network. This framework allows for much broader, complex data ingestion where each layer of the neural network can learn progressively more complex elements of the data. Object classification is a classic example, where the machine ‘learns’ what a duck looks like and then is able to automatically identify and group images of ducks. As you might imagine, deep learning models have proved to be much more efficient and accurate at facial and voice recognition than traditional machine learning methods. Whether your financial institution is already seeing the returns for its AI transformation or is one of the 61% of companies investing in this data initiative in 2019, having a clear picture of what is available and how it can impact your business is imperative. How do you see AI and machine learning impacting your customer acquisition, underwriting and overall customer experience?

To provide consumers with clear-cut protections against disturbance by debt collectors, the Consumer Financial Protection Bureau (CFPB) issued a Notice of Proposed Rulemaking (NPRM) to implement the Fair Debt Collection Practices Act (FDCPA) earlier this year. Among many other things, the proposal would set strict limits on the number of calls debt collectors may place to reach consumers weekly and clarify requirements for consumer-facing debt collection disclosures. A bigger discussion Deliberation of the debt collection proposal was originally scheduled to begin on August 18, 2019. However, to allow commenters to further consider the issues raised in the NPRM and gather data, the comment period was extended by 20 days to September 18, 2019. It is currently still being debated, as many argue that the proposed rule does not account for modern consumer preferences and hinders the free flow of information used to help consumers access credit and services. The Association of Credit and Collection Professionals (ACA International) and US House lawmakers continue to challenge the proposal, stating that it doesn’t ensure that debt collectors’ calls to consumers are warranted, nor does it do enough to protect consumers’ privacy. Many consumer advocates have expressed doubts about how effective the proposed measures will be in protecting debtors from debt collector harassment and see the seven-calls-a-week limit on phone contact as being too high. In fact, it’s difficult to find a group of people in full support of the proposal, despite the CFPB stating that it will help clarify the FDCPA, protect lenders from litigation and bring consumer protection regulation into the 21st century. What does this mean? Although we don’t know when, or if, the proposed rule will go into effect, it’s important to prepare. According to the Federal Register, there are key ways that the new regulation would affect debt collection through the use of newer technologies, required disclosures and limited consumer contact. Not only will the proposed rules apply to debt collectors, but its provisions will also impact creditors and servicers, making it imperative for everyone in the financial services space to keep watch on the regulation’s status and carefully analyze its proposed rules. At Experian, our debt collection solutions automate and moderate dialogues and negotiations between consumers and collectors, making it easier for collection agencies to connect with consumers while staying compliant. Our best-in-class data and analytics will play a key role in helping you reach the right consumer, in the right place, at the right time. Learn more

The future is, factually speaking, uncertain. We don't know if we'll find a cure for cancer, the economic outlook, if we'll be living in an algorithmic world or if our work cubical mate will soon be replaced by a robot. While futurists can dish out some exciting and downright scary visions for the future of technology and science, there are no future facts. However, the uncertainty presents opportunity. Technology in today's world From the moment you wake up, to the moment you go back to sleep, technology is everywhere. The highly digital life we live and the development of our technological world have become the new normal. According to The International Telecommunication Union (ITU), almost 50% of the world's population uses the internet, leading to over 3.5 billion daily searches on Google and more than 570 new websites being launched each minute. And even more mind-boggling? Over 90% of the world's data has been created in just the last couple of years. With data growing faster than ever before, the future of technology is even more interesting than what is happening now. We're just at the beginning of a revolution that will touch every business and every life on this planet. By 2020, at least a third of all data will pass through the cloud, and within five years, there will be over 50 billion smart connected devices in the world. Keeping pace with digital transformation At the rate at which data and our ability to analyze it are growing, businesses of all sizes will be forced to modify how they operate. Businesses that digitally transform, will be able to offer customers a seamless and frictionless experience, and as a result, claim a greater share of profit in their sectors. Take, for example, the financial services industry - specifically banking. Whereas most banking used to be done at a local branch, recent reports show that 40% of Americans have not stepped through the door of a bank or credit union within the last six months, largely due to the rise of online and mobile banking. According to Citi's 2018 Mobile Banking Study, mobile banking is one of the top three most-used apps by Americans. Similarly, the Federal Reserve reported that more than half of U.S. adults with bank accounts have used a mobile app to access their accounts in the last year, presenting forward-looking banks with an incredible opportunity to increase the number of relationship touchpoints they have with their customers by introducing a wider array of banking products via mobile. Be part of the movement Rather than viewing digital disruption as worrisome and challenging, embrace the uncertainty and potential that advances in new technologies, data analytics and artificial intelligence will bring. The pressure to innovate amid technological progress poses an opportunity for us all to rethink the work we do and the way we do it. Are you ready? Learn more about powering your digital transformation in our latest eBook. Download eBook Are you an innovation junkie? Join us at Vision 2020 for future-facing sessions like: - Cloud and beyond - transforming technologies - ML and AI - real-world expandability and compliance
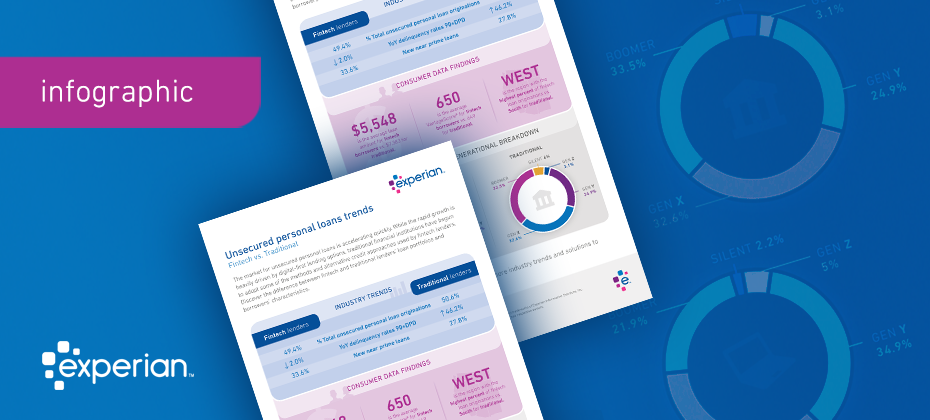
In today’s age of digital transformation, consumers have easy access to a variety of innovative financial products and services. From lending to payments to wealth management and more, there is no shortage in the breadth of financial products gaining popularity with consumers. But one market segment in particular – unsecured personal loans – has grown exceptionally fast. According to a recent Experian study, personal loan originations have increased 97% over the past four years, with fintech share rapidly increasing from 22.4% of total loans originated to 49.4%. Arguably, the rapid acceleration in personal loans is heavily driven by the rise in digital-first lending options, which have grown in popularity due to fintech challengers. Fintechs have earned their position in the market by leveraging data, advanced analytics and technology to disrupt existing financial models. Meanwhile, traditional financial institutions (FIs) have taken notice and are beginning to adopt some of the same methods and alternative credit approaches. With this evolution of technology fused with financial services, how are fintechs faring against traditional FIs? The below infographic uncovers industry trends and key metrics in unsecured personal installment loans: Still curious? Click here to download our latest eBook, which further uncovers emerging trends in personal loans through side-by-side comparisons of fintech and traditional FI market share, portfolio composition, customer profiles and more. Download now

What do movie actors Adam Sandler and Hugh Grant, jazz singer Michael Bublé, Russian literary giant Leo Tolstoy, and Colonel Sanders, the founder of KFC, have in common? Hint, it’s not a Nobel Prize for Literature, a Golden Globe, a Grammy Award, a trademark goatee, or a “finger-lickin’ good” bucket of chicken. Instead, they were all born on September 9, the most common birth date in the U.S. Baby Boom According to real birth data compiled from 20 years of American births, September is the most popular month to give birth to a child in America – and December, the most popular time to make one. With nine of the top 10 days to give birth falling between September 9 and September 20, one may wonder why the birth month is so common. Here are some theories: Those who get to choose their child’s birthday due to induced and elective births tend to stay away from the hospital during understaffed holiday periods and may plan their birth date around the start of the school year. Several of the most common birth dates in September correspond with average conception periods around the holidays, where couples likely have more time to spend together. Some studies within the scientific community suggest that our bodies may actually be biologically disposed to winter conceptions. While you may not be feeling that special if you were born in September, the actual differences in birth numbers between common and less common birthdays are often within just a few thousand babies. For example, September 10, the fifth most common birthday of the year, has an average birth rate of 12,143 babies. Meanwhile, April 20, the 328th most common birthday, has an average birth rate of 10,714 newborns. Surprisingly, the least common birthdays fall on Christmas Eve, Christmas Day and New Year’s Day, with Thanksgiving and Independence Day also ranking low on the list. Time to Celebrate – but Watch out! Statistically, there’s a pretty good chance that someone reading this article will soon be celebrating their birthday. And while you should be getting ready to party, you should also be on the lookout for fraudsters attempting to ruin your big day. It’s a well-known fact that cybercriminals can use your birth date as a piece of the puzzle to capture your identity and commit identity theft – which becomes a lot easier when it’s being advertised all over social media. It’s also important for employers to safeguard their organization from fraudsters who may use this information to break into corporate accounts. While sharing your birthday with a lot of people could be a good or bad thing depending on how much undivided attention you enjoy – you’re in great company! Not only can you plan a joint party with Michelle Williams, Afrojack, Cam from Modern Family, four people I went to high school with on Facebook and a handful of YouTube stars that I’m too old to know anything about, but there will be more people ringing in your birthday than any other day of the year! And that’s pretty cool.

Pickups are the most common vehicle in operation at 20% share today and hold 16.5% of new vehicle registrations in the market in Q1 2019.

Earlier this year, the Consumer Financial Protection Bureau (CFPB) issued a Notice of Proposed Rulemaking (NPRM) to implement the Fair Debt Collection Practices Act (FDCPA). The proposal, which will go into deliberation in September and won't be finalized until after that date at the earliest, would provide consumers with clear-cut protections against disturbance by debt collectors and straightforward options to address or dispute debts. Additionally, the NPRM would set strict limits on the number of calls debt collectors may place to reach consumers weekly, as well as clarify how collectors may communicate lawfully using technologies developed after the FDCPA’s passage in 1977. So, what does this mean for collectors? The compliance conundrum is ever present, especially in the debt collection industry. Debt collectors are expected to continuously adapt to changing regulations, forcing them to spend time, energy and resources on maintaining compliance. As the most recent onslaught of developments and proposed new rules have been pushed out to the financial community, compliance professionals are once again working to implement changes. According to the Federal Register, here are some key ways the new regulation would affect debt collection: Limited to seven calls: Debt collectors would be limited to attempting to reach out to consumers by phone about a specific debt no more than seven times per week. Ability to unsubscribe: Consumers who do not wish to be contacted via newer technologies, including voicemails, emails and text messages must be given the option to opt-out of future communications. Use of newer technologies: Newer communication technologies, such as emails and text messages, may be used in debt collection, with certain limitations to protect consumer privacy. Required disclosures: Debt collectors will be obligated to send consumers a disclosure with certain information about the debt and related consumer protections. Limited contact: Consumers will be able to limit ways debt collectors contact them, for example at a specific telephone number, while they are at work or during certain hours. Now that you know the details, how can you prepare? At Experian, we understand the importance of an effective collections strategy. Our debt collection solutions automate and moderate dialogues and negotiations between consumers and collectors, making it easier for collection agencies to reach consumers while staying compliant. Powerful locating solution: Locate past-due consumers more accurately, efficiently and effectively. TrueTraceSM adds value to each contact by increasing your right-party contact rate. Exclusive contact information: Mitigate your compliance risk with a seamless and unparalleled solution. With Phone Number IDTM, you can identify who a phone is registered to, the phone type, carrier and the activation date. If you aren’t ready for the new CFPB regulation, what are you waiting for? Learn more Note: Click here for an update on the CFPB's proposal.

The fact that the last recession started right as smartphones were introduced to the world gives some perspective into how technology has changed over the past decade. Organizations need to leverage the same technological advancements, such as artificial intelligence and machine learning, to improve their collections strategies. These advanced analytics platforms and technologies can be used to gauge customer preferences, as well as automate the collections process. When faced with higher volumes of delinquent loans, some organizations rapidly hire inexperienced staff. With new analytical advancements, organizations can reduce overhead and maintain compliance through the collections process. Additionally, advanced analytics and technology can help manage customers throughout the customer life cycle. Let’s explore further: Why use advanced analytics in collections? Collections strategies demand diverse approaches, which is where analytics-based strategies and collections models come into play. As each customer and situation differs, machine learning techniques and constraint-based optimization can open doors for your organization. By rethinking collections outreach beyond static classifications (such as the stage of account delinquency) and instead prioritizing accounts most likely to respond to each collections treatment, you can create an improved collections experience. How does collections analytics empower your customers? Customer engagement, carefully considered, perhaps comprises the most critical aspect of a collections program—especially given historical perceptions of the collections process. Experian recently analyzed the impact of traditional collections methods and found that three percent of card portfolios closed their accounts after paying their balances in full. And 75 percent of those closures occurred shortly after the account became current. Under traditional methods, a bank may collect outstanding debt but will probably miss out on long-term customer loyalty and future revenue opportunities. Only effective technology, modeling and analytics can move us from a linear collections approach towards a more customer-focused treatment while controlling costs and meeting other business objectives. Advanced analytics and machine learning represent the most important advances in collections. Furthermore, powerful digital innovations such as better criteria for customer segmentation and more effective contact strategies can transform collections operations, while improving performance and raising customer service standards at a lower cost. Empowering consumers in a digital, safe and consumer-centric environment affects the complete collections agenda—beginning with prevention and management of bad debt and extending through internal and external account resolution. When should I get started? It’s never too early to assess and modernize technology within collections—as well as customer engagement strategies—to produce an efficient, innovative game plan. Smarter decisions lead to higher recovery rates, automation and self-service tools reduce costs and a more comprehensive customer view enhances relationships. An investment today can minimize the negative impacts of the delinquency challenges posed by a potential recession. Collections transformation has already begun, with organizations assembling data and developing algorithms to improve their existing collections processes. In advance of the next recession, two options present themselves: to scramble in a reactive manner or approach collections proactively. Which do you choose? Get started

There are thousands of potential car buyers heading into dealerships and browsing websites for their next vehicle every day. And that means thousands of opportunities for automotive manufacturers to market their vehicles to prospective buyers. But not every vehicle is going to meet the needs and wants of every car buyer. So, how do automotive brand marketers reach the individuals most likely to be interested in their products? Simply put, it comes down to better understanding the brand’s audience. But, today’s digitally-driven world creates a significant challenge for brand marketers – the overreliance on mobile devices and digital channels creates hundreds of digital touchpoints for brand marketers to consider. But, the data also creates an opportunity. If automotive marketers can bridge the gap between online and offline touchpoints, they’ll be better positioned to develop messages that resonate with their desired audience and deliver communications through the most effective channels. The end result? More meaningful interaction with potential car buyers. To get there, automotive marketers need to consider these concepts: Navigate the identity resolution process The secret to a more relevant conversation begins and ends with knowing who you are addressing. People interact with brands through a variety of channels. For example, a person may see an advertisement for a new vehicle on their smartphone, later research the same vehicle at home on their desktop or on a mobile app and test drive the vehicle a few days later. The automotive marketer that can reconcile these three different interactions will be able to deliver relevant advertisements to the individual and cut down on wasted advertising spend. Knowledge-based identity resolution is what allows you to be smarter with your marketing. Present the right offer People are bombarded with hundreds, if not thousands, of advertisements daily. Automotive marketers need to cut through the noise and deliver messages that resonate with the target audience – whether it’s through e-newsletters, 30-second TV spots, banner ads or direct mail pieces. If automotive manufacturers miss the mark, it could lead to a frustrated consumer and poor brand reputation. For instance, an automotive marketer would not want to advertise the latest minivan to a couple who are empty nesters. Create customer loyalty It’s important to stay on top of current market statistics and data to fine-tune marketing campaigns. Vehicle ownership and purchase patterns can vary greatly in each market, and that means brands might need to fine-tune long-term loyalty strategies. A loyalty program that works in the Northeast might not work well for the Midwest market based on car buying patterns and the reasons behind owning a car. Data can help prioritize resources in areas with the highest potential for sales growth. Experian Marketing EngineTM helps automotive manufacturers engage customers across every channel while making the most of a marketing budget. It’s designed to seamlessly collect, consolidate and use customer data by connecting offline and online identifiers to create a single customer view. Experian’s North American Vehicle Database alone has over 11 billion records and over 900 million vehicles, of which over 68 million are Canadian vehicles. Marketing Engine leverages automotive specific insights, including vehicle purchase behaviors and ownership data, and combines that with other marketing data such as demographics and lifestyle interests. These automotive tools provide a more unified approach so that brands can make more informed decisions, gain and retain new customers, and drive sales. Learn more at https://www.experian.com/automotive/marketing.

Have you seen the latest Telephone Consumer Protection Act (TCPA) class action lawsuit? TCPA litigations in the communications, energy and media industries are dominating the headlines, with companies paying up to millions of dollars in damages. Consumer disputes have increased more than 500 percent in the past five years, and regulations continue to tighten. Now more than ever, it’s crucial to build effective and cost-efficient contact strategies. But how? First, know your facts. Second, let us help. What is the TCPA? As you’re aware, TCPA aims to safeguard consumer privacy by regulating telephone solicitations and the use of prerecorded messages, auto-dialed calls, text messages and unsolicited faxes. The rule has been amended and more tightly defined over time. Why is TCPA compliance important? Businesses found guilty of violating TCPA regulations face steep penalties – fines range from $500 to $1500 per individual infraction! Companies have been delivered hefty penalties upwards of hundreds of thousands, and in some cases, millions of dollars. Many have questions and are seeking to understand how they might adjust their policies and call practices. How can you protect yourself? To help avoid risk for compliance violations, it’s integral to assess call strategies and put best practices in place to increase right-party contact rates. Strategies to gain compliance and mitigate risk include: Focus on right and wrong-party contact to improve customer service: Monitoring and verifying consumer contact information can seem like a tedious task, but with the right combination of data, including skip tracing data from consumer credit data, alternative and other exclusive data sources, past-due consumers can be located faster. Scrub often for updated or verified information: Phone numbers can continuously change, and they’re only one piece of a consumer’s contact information. Verifying contact information for TCPA compliance with a partner you can trust can help make data quality routine. Determine when and how often you dial cell phones: Or, given new considerations proposed by the CFPB, consider looking at collections via your consumers’ preferred communication channel – online vs. over the phone. Provide consumers user-friendly mechanisms to opt-out of receiving communications At Experian, our TCPA solutions can help you monitor and verify consumer contact information, locate past-due consumers, improve your right-party contact rates and automate your collections process. Get started

Alex Lintner, Group President at Experian, recently had the chance to sit down with Peter Renton, creator of the Lend Academy Podcast, to discuss alternative credit data,1 UltraFICO, Experian Boost and expanding the credit universe. Lintner spoke about why Experian is determined to be the leader in bringing alternative credit data to the forefront of the lending marketplace to drive greater access to credit for consumers. “To move the tens of millions of “invisible” or “thin file” consumers into the financial mainstream will take innovation, and alternative data is one of the ways which we can do that,” said Lintner. Many U.S. consumers do not have a credit history or enough record of borrowing to establish a credit score, making it difficult for them to obtain credit from mainstream financial institutions. To ease access to credit for these consumers, financial institutions have sought ways to both extend and improve the methods by which they evaluate borrowers’ risk. By leveraging machine learning and alternative data products, like Experian BoostTM, lenders can get a more complete view into a consumer’s creditworthiness, allowing them to make better decisions and consumers to more easily access financial opportunities. Highlights include: The impact of Experian Boost on consumers’ credit scores Experian’s take on the state of the American consumer today Leveraging machine learning in the development of credit scores Expanding the marketable universe Listen now Learn more about alternative credit data 1When we refer to "Alternative Credit Data," this refers to the use of alternative data and its appropriate use in consumer credit lending decisions, as regulated by the Fair Credit Reporting Act. Hence, the term "Expanded FCRA Data" may also apply in this instance and both can be used interchangeably.