Tag: Decisioning

Time – it’s the only resource we can’t get more of, which is why we tend to obsess over saving it. Despite this obsession, it can be hard for us to identify time-wasting activities. From morning habits to credit decisioning, processes and routines that seem, well, routine, can get in the way of maximizing how we use our time. Identifying the Problem Every morning, I used to turn on my coffee maker, walk to the bathroom to take my multivitamin, then walk back into the kitchen to finish making my coffee. This required maybe twenty steps to the bathroom and twenty steps back, and while this isn’t a huge amount of time—half a minute at best—it’s not insignificant, especially in the morning when time feels particularly precious. One day, I realized I could eliminate the waste by moving my multivitamin to the cabinet above my coffeemaker. What if we could all make minor changes to enhance our efficiency both at home and at work? Imagine how much time we could save by cutting out unnecessary steps. And how saving that time could help drive significant revenue increases. Time Equals Money When businesses waste time with unnecessary steps, that’s money from their bottom line, and out of the pockets of people who are connected to them. Over the last several years, a new time saver has emerged – Application Programming Interface (API). APIs allow application programs to communicate with other operating systems or control programs through a series of server requests or API calls, enabling seamless interaction, data sharing and decisioning. Experian’s partners utilize our ever-growing suite of APIs to quickly access better data, making existing processes more effective and routines more efficient. In the past, banks and other partners had to send files back and forth to Experian when they needed decisioning on a customer’s credit-worthiness prior to approving a new loan or extending a credit limit increase. Now, partners can have their origination system call an Experian API and send their data through that. Our system processes it and sends it back in milliseconds, giving the lenders real-time decisioning rather than shuttling information back and forth unnecessarily. Instead of effectively walking away from one process (assisting the customer/making coffee) to start another (retrieving credit info/walking down the hall to take the multivitamin), our partners are able to link these processes up and save time, allowing them to capitalize on the presence and interest of their customer. The Proof When Washington State Employees Credit Union, the second-largest credit union in the state, realized they needed to make a change to keep pace with increasing competition, they turned to Experian. With our solution, the credit union is now able to provide its members with instant credit decisioning through their online banking platform. This real-time decisioning at the point of member-initiated contact increased the credit union’s loan and credit applications by 25%. Additionally, member satisfaction increased, with 90% of members finding the simplified prequalification process to be more efficient. By accessing Experian’s decisioning services through your existing connection, lenders can to save time and match consumers with the products that match their credit profile before they apply – increasing approval rates once the application is submitted. Best of all, the entire process with the consumers is completed within seconds. Find out how Experian’s solutions can help you improve your existing processes and cut out unnecessary steps. Get started

Many companies rely on attributes for decisioning but lack the resources needed to invest in developing, managing, and updating the attributes themselves. Experian is there to guide you every step of the way with our Attribute Toolbox – our source independent solution that provides maximum flexibility and multiple data sources you can use in the calculation and management of attributes. To create and manage our attributes, Experian has established development principles and created a set methodology to ensure that our attribute management system works across the attribute life cycle. Here’s how it works: Develop Attributes The attribute development process includes: discovery, exploratory data analysis, filter leveling, and the development of attributes. When we create attributes, Experian takes great care to ensure that we: Analyze the available data elements and how they are populated (the frequencies of fields). Determine a “sensible” definition of the attribute. Evaluate attribute frequencies. Review consumer credit reports, where possible. Refine the definition and assess more frequencies and examples. Test Attributes Before implementing, Experian performs an internal audit of filters and attributes. Defining, coding and auditing filters is 80% of the attribute development process. The main objective of the auditing process is to ensure both programming and logical accuracy. This involves electronic and manual auditing and requires a thorough review of all data elements used in development. Deploy Attributes Deployment is very similar to attribute testing. However, in this case, the primary objective of the deployment audit is to ensure both the programming and logical accuracy of the output is executing correctly on various platforms. We aim to maintain consistency among various business lines and products, between batch and online environments across the life cycle, and wherever your models are deployed: on premises, in the cloud, and off-site in your partners’ systems. Govern Attributes Experian places a robust attribute governance process in place to ensure that our attributes remains up-to-date and on track with internal and external compliance regulations and audits. New learnings, industry and regulatory changes can lead to updated attributes or new attributes over time. Because attributes are ever-changing, we take great care to expand, update and add new attributes over time based on three types of external changes: economic, bureau, and reporting changes. Fetch Data While we gather the data, we ensure that you can integrate a variety of external data sources, including: consumer bureau, business, fraud, and other data sources. Attributes need to be: Highly accurate. Suitable for use across the Customer Life Cycle. Suitable for use in credit decisioning and model development. Available and consistent across multiple platforms. Supportive and adaptable to ever-evolving regulatory considerations. Thoroughly documented and monitored. Monitor Performance We generate attribute distribution reports and can perform custom validations using data from credit reporting agencies (CRAs) and other data providers. This is based on monthly monitoring to ensure continued integrity and stability to stand up to regulatory scrutiny and compliance regulations. Variations that exceed predetermined thresholds are identified, quantified, and explained. If new fields or data values within existing fields are announced, we assess the impact and important of these values on attributes – to determine if revisions are needed. Maintain Attributes Credit bureau data updates, new attributes in response to market needs, compliance requirements, corrections in logic where errors are identified or improvements to logic often lead to new version releases of attributes. With each new version release, Experian takes care to conduct thorough analyses comparing the previous and current set of attributes. We also make sure to create detailed documentation on what’s changed between versions, the rationale for changes and the impact on existing attributes. Experian Attributes are the key to unlocking consistent, enhanced and more profitable decisions. Our data analysts and statisticians have helped hundreds of clients build custom attributes and custom models to solve their business problems. Our Attribute Toolbox makes it easier to deploy and manage attributes across the customer lifecycle. We give companies the power to code, manage, test, and deploy all types of attributes, including: Premier AttributesSM, Trended 3DTM, and custom attributes – without relying on a third-party. We do the heavy lifting so that you don’t have to. Learn More

Alex Lintner, Group President at Experian, recently had the chance to sit down with Peter Renton, creator of the Lend Academy Podcast, to discuss alternative credit data,1 UltraFICO, Experian Boost and expanding the credit universe. Lintner spoke about why Experian is determined to be the leader in bringing alternative credit data to the forefront of the lending marketplace to drive greater access to credit for consumers. “To move the tens of millions of “invisible” or “thin file” consumers into the financial mainstream will take innovation, and alternative data is one of the ways which we can do that,” said Lintner. Many U.S. consumers do not have a credit history or enough record of borrowing to establish a credit score, making it difficult for them to obtain credit from mainstream financial institutions. To ease access to credit for these consumers, financial institutions have sought ways to both extend and improve the methods by which they evaluate borrowers’ risk. By leveraging machine learning and alternative data products, like Experian BoostTM, lenders can get a more complete view into a consumer’s creditworthiness, allowing them to make better decisions and consumers to more easily access financial opportunities. Highlights include: The impact of Experian Boost on consumers’ credit scores Experian’s take on the state of the American consumer today Leveraging machine learning in the development of credit scores Expanding the marketable universe Listen now Learn more about alternative credit data 1When we refer to "Alternative Credit Data," this refers to the use of alternative data and its appropriate use in consumer credit lending decisions, as regulated by the Fair Credit Reporting Act. Hence, the term "Expanded FCRA Data" may also apply in this instance and both can be used interchangeably.
Many may think of digital transformation in the financial services industry as something like emailing a PDF of a bank statement instead of printing it and sending via snail mail. After working with data, analytics, software and fraud-prevention experts, I have found that digital transformation is actually much more than PDFs. It can have a bigger and more positive influence on a business’s bottom line – especially when built on a foundation of data. Digital transformation is the new business model. And executives agree. Seventy percent of executives feel the traditional business model will disappear in the next five years due to digital transformation, according to recent Experian research. Our new e-book, Powering digital transformation: Transforming the customer experience with data, analytics and automation, says, “we live in a world of ‘evolve or fail.’ From Kodak to Blockbuster, we’ve seen businesses resist change and falter. The need to evolve is not new. What is new is the speed and depth needed to not only compete, but to survive. Digital startups are revolutionizing industries in months and years instead of decades and centuries.” So how do businesses evolve digitally? First, they must understand that this isn’t a ‘one-and-done’ event. The e-book suggests that the digital transformation life cycle is a never-ending process: Cleanse, standardize and enrich your data to create features or attributes Analyze your data to derive pertinent insights Automate your models and business practices to provide customer-centric experiences Test your techniques to find ways to improve Begin the process again Did you notice the key word or phrase in each of these steps is ‘data’ or ‘powered by data?’ Quality, reliable data is the foundation of digital transformation. In fact, almost half of CEOs surveyed said that lack of data or analytical insight is their biggest challenge to digital transformation. Our digital world needs better access to and insight from data because information derived from data, tempered with wisdom, provides the insight, speed and competitive advantage needed in our hypercompetitive environment. Data is the power behind digital transformation. Learn more about powering your digital transformation in our new e-book>

The universe has been used as a metaphor for many things – vast, wide, intangible – much like the credit universe. However, while the man on the moon, a trip outside the ozone layer, and all things space from that perspective may seem out of touch, there is a new line of access to consumers. In Experian's latest 2019 State of Alternative Credit Data report, consumers and lenders alike weigh in on the growing data set and how they are leveraging the data in use cases across the lending lifecycle. While the topic of alternative credit data is no longer as unfamiliar as it may have been a year or two ago, the capabilities and benefits that can be experienced by financial institutions, small businesses and consumers are still not widely known. Did you know?: - 65% of lenders say they are using information beyond the traditional credit report to make a lending decision. - 58% of consumers agree that having the ability to contribute payment history to their credit file make them feel empowered. - 83% of lenders agree that digitally connecting financial account data will create efficiencies in the lending process. These and other consumer and lender perceptions of alternative credit data are now launched with the latest edition of the State of Alternative Credit Data whitepaper. This year’s report rounds up the different types of alternative credit data (from alternative financial services data to consumer-permissioned account data, think Experian BoostTM), as well as an overview of the regulatory landscape, and a number of use cases across consumer and small business lending. In addition, consumers also have a lot to say about alternative credit data: With the rise of machine learning and big data, lenders can collect more data than ever, facilitating smarter and more precise decisions. Unlock your portfolio’s growth potential by tapping into alternative credit data to expand your consumer universe. Learn more in the 2019 State of Alternative Credit Data Whitepaper. Read Full Report View our 2020 State of Alternative Credit Data Report for an updated look at how consumers and lenders are leveraging alternative credit data.

If your company is like many financial institutions, it’s likely the discussion around big data and financial analytics has been an ongoing conversation. For many financial institutions, data isn’t the problem, but rather what could or should be done with it. Research has shown that only about 30% of financial institutions are successfully leveraging their data to generate actionable insights, and customers are noticing. According to a recent study from Capgemini, 30% of US customers and 26% of UK customers feel like their financial institutions understand their needs. No matter how much data you have, it’s essentially just ones and zeroes if you’re not using it. So how do banks, credit unions, and other financial institutions who capture and consume vast amounts of data use that data to innovate, improve the customer experience and stay competitive? The answer, you could say, is written in the sand. The most forward-thinking financial institutions are turning to analytical environments, also known as a sandbox, to solve the business problem of big data. Like the name suggests, a sandbox is an environment that contains all the materials and tools one might need to create, build, and collaborate around their data. A sandbox gives data-savvy banks, credit unions and FinTechs access to depersonalized credit data from across the country. Using custom dashboards and data visualization tools, they can manipulate the data with predictive models for different micro and macro-level scenarios. The added value of a sandbox is that it becomes a one-stop shop data tool for the entire enterprise. This saves the time normally required in the back and forth of acquiring data for a specific to a project or particular data sets. The best systems utilize the latest open source technology in artificial intelligence and machine learning to deliver intelligence that can inform regional trends, consumer insights and highlight market opportunities. From industry benchmarking to market entry and expansion research and campaign performance to vintage analysis, reject inferencing and much more. An analytical sandbox gives you the data to create actionable analytics and insights across the enterprise right when you need it, not months later. The result is the ability to empower your customers to make financial decisions when, where and how they want. Keeping them happy keeps your financial institution relevant and competitive. Isn’t it time to put your data to work for you? Learn more about how Experian can solve your big data problems. >> Interested to see a live demo of the Ascend Sandbox? Register today for our webinar “Big Data Can Lead to Even Bigger ROI with the Ascend Sandbox.”

Big Data is no longer a new concept. Once thought to be an overhyped buzzword, it now underpins and drives billions in dollars of revenue across nearly every industry. But there are still companies who are not fully leveraging the value of their big data and that’s a big problem. In a recent study, Experian and Forrester surveyed nearly 600 business executives in charge of enterprise risk, analytics, customer data and fraud management. The results were surprising: while 78% of organizations said they have made recent investments in advanced analytics, like the proverbial strategic plan sitting in a binder on a shelf, only 29% felt they were successfully using these investments to combine data sources to gather more insights. Moreover, 40% of respondents said they still rely on instinct and subjectivity when making decisions. While gut feeling and industry experience should be a part of your decision-making process, without data and models to verify or challenge your assumptions, you’re taking a big risk with bigger operations budgets and revenue targets. Meanwhile, customer habits and demands are quickly evolving beyond a fundamental level. The proliferation of mobile and online environments are driving a paradigm shift to omnichannel banking in the financial sector and with it, an expectation for a customized but also digitized customer experience. Financial institutions have to be ready to respond to and anticipate these changes to not only gain new customers but also retain current customers. Moreover, you can bet that your competition is already thinking about how they can respond to this shift and better leverage their data and analytics for increased customer acquisition and engagement, share of wallet and overall reach. According to a recent Accenture study, 79% of enterprise executives agree that companies that fail to embrace big data will lose their competitive position and could face extinction. What are you doing to help solve the business problem around big data and stay competitive in your company?

Once a scorecard has been redeveloped, it is important to measure the impact of changes within the strategy by replacing the old model with the new one. This impact assessment can be completed with a swap set analysis. The term swap set refers to “swapping out” a set of bad accounts and replacing them with or “swapping in” a set of good accounts. Different approaches can be used when evaluating swap sets to optimize your strategy and keep: The same overall bad rate while increasing the approval rate. The same approval rate while lowering the bad rate. The same approval and bad rates but an increase in customer activation or customer response rates. When measuring your swap sets, remember to also include the population that doesn’t change — those accounts that would be approved or declined using either the old or new model. Learn more>

With 81% of Americans having a social media profile, you may wonder if social media insights can be used to assess credit risk. When considering social media data as it pertains to financial decisions, there are 3 key concerns to consider. The ECOA requires that credit must be extended to all creditworthy applicants regardless of race, religion, gender, marital status, age and other personal characteristics. Social media can reveal these characteristics and inadvertently affect decisions. Social media data can be manipulated. Individuals can represent themselves as financially responsible when they’re not. On the flip side, consumers can’t manipulate their payment history. When it comes to credit decisions, always remember that the FCRA trumps everything. Data is essential for all aspects of the financial services industry, but it’s still too early to click the “like” button for social media. Make more insightful decisions with credit attributes>
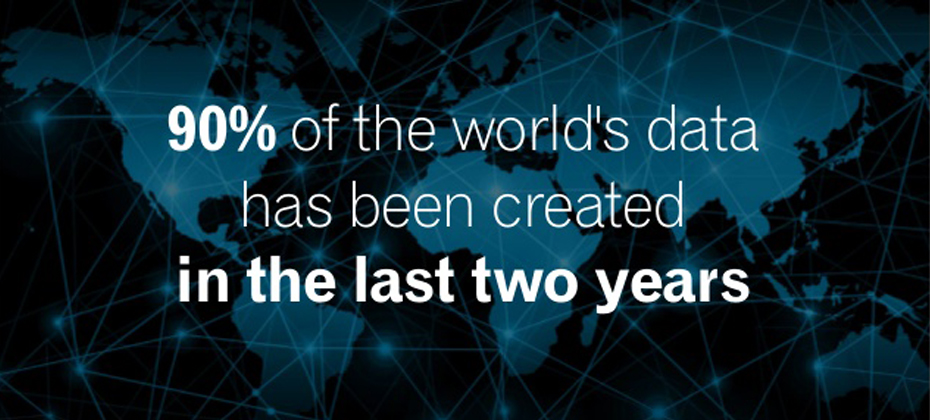
Call it big data, smart data or evidence-based decision-making. It’s not just the latest fad, it’s the future of how business will be guided and grow. Here are a few telling stats that show data is exploding and a new age is upon us: Data is growing faster than ever before, and we’re on track to create about 1.7 megabytes of new information per person every second by 2020. The social universe—which includes every digitally connected person—doubles in size every two years. By 2020, it will reach 44 zettabytes or 44 trillion gigabytes, according to CIO. In 2015, more than 1 billion people used Facebook and sent an average of 31.25 million messages and viewed 2.77 million videos each minute. More than 100 terabytes of data is uploaded daily to the social channel. By 2020, more than 6.1 billion smartphone users will exist globally. And there will be more than 50 billion smart connected devices in the world, all capable of collecting, analyzing and sharing a wealth of data. More than one-third of all data will pass through or exist in the cloud by 2020. The IDC estimates that by 2020, business transactions on the internet—business-to-business and business-to-consumer—will reach 450 billion per day. All of this new data means we’ll be looking at a whole new set of possibilities and a new level of complexity in the years ahead. The data itself is of great value, however, lenders need the right automated decisioning platform to store, collect, quickly process and analyze the volumes of consumer data to gain accurate consumer stories. While lenders don’t necessarily need to factor in decisioning on social media uploads and video views, there is an expectation for immediacy to know if a consumer is approved, denied or conditioned. Online lenders have figured out how to quickly capture and understand big data, and are expected to account for $122 billion in lending by 2020. This places more pressure on banks and credit unions to enhance their technology to cut down on loan approval times and move away from various manual touch points. Critics of automated decisioning solutions used in lending cite compliance issues, complacency by lenders and lack of human involvement. But a robust platform enables lenders to improve and supplement their current decisioning processes because it is: Agile: Experian hosts our client’s solutions and decisioning strategies, so we are able to make and deploy changes quickly as the needs of the market and business change, and deliver real-time instant decisions while a consumer is at the point of sale. A hosted environment also means reduced implementation timelines, as no software or hardware installation is required, allowing lenders to recognize value faster. A data work horse: Internal and external data can be pulled from multiple sources into a lender’s decisioning model. Lenders may also access an unlimited number of scores and attributes—including real-time access to credit bureau data—and integrate third-party data sources into the decisioning engine. Powerful: A robust decision engine is capable of calculating numerous predictive attributes and custom scoring models, and can also test new strategies against current decision models or perform “what if” simulations on historical data. Data collection, storage and analysis are here to stay. As will be the businesses which are savvy enough to use a solution that can find opportunities and learnings in all of that complex data, quickly curate the best possible actions to take for positive outcomes, and allow lenders and marketers to execute on those recommendations with the click of a button. To learn more about Experian’s decisioning solutions, you can additionally explore our PowerCurve and Attribute Toolbox solutions.

The 1990s brought us a wealth of innovative technology, including the Blackberry, Windows 98, and Nintendo. As much as we loved those inventions, we moved on to enjoy better technology when it became available, and now have smartphones, Windows 10 and Xbox. Similarly, technological and modeling advances have been made in the credit scoring arena, with new software that brings significant benefits to lenders who use them. Later this year, FICO will retire its Score V1, making it mandatory for those lenders still using the old software to find another solution. Now is the time for lenders to take a look at their software and myriad reasons to move to a modern credit score solution. Portfolio Growth As many as 70 million Americans either have no credit score or a thin credit file. One-third of Millennials have never bothered to apply for a credit card, and the percentage of Americans under 35 with credit card debt is at its lowest level in more than 25 years, according to the Federal Reserve. A recent study found that Millennials use cash and debit cards much more than older Americans. Over time, Millennials without credit histories could struggle to get credit. Are there other data sets that provide a window into whether a thin file consumer is creditworthy or not? Modern credit scoring models are now being used in the marketplace without negatively impacting credit quality. For example, the VantageScore® credit score allows for the scoring of 30 million to 35 million more people consumers who are typically unscoreable by other traditional generic credit models. The VantageScore® credit score does this by using a broader, deeper set of credit file data and more advanced modeling techniques. This allows the VantageScore® credit score model to more accurately predict unique consumer behaviors—is the consumer paying his utility bill on time?—and better evaluate thin file consumers. Mitigate Risk In today’s ever-changing regulatory landscape, lenders can stay ahead of the curve by relying on innovative credit score models like the VantageScore® credit score. These models incorporate the best of both worlds by leaning on innovative scoring analytics that are more inclusive, while providing marketplace lenders with assurances the decisioning is both statistically sound and compliant with fair lending laws. Newer solutions also offer enhanced documentation to ease the burden associated with model risk management and regulatory compliance responsibilities. Updated scores Consumer credit scores can vary depending on the type of scoring model a lender uses. If it's an old, outdated version, a consumer might be scored lower. If it's a newer, more advanced model, the consumer has a better shot at being scored more fairly. Moving to a more advanced scoring model can help broaden the base of potential borrowers. By sticking to old models—and older scores—a sizable number of consumers are left at a disadvantage in the form of a higher interest rate, lower loan amount or even a declined application. Introducing advanced scoring models can provide a more accurate picture of a consumer. As an example, for many of the newest consumer risk models, like FICO Score 9, a consumer’s unpaid medical collection agency accounts will be assessed differently from unpaid non-medical collection agency accounts. This isn't true for most pre-2012 consumer risk score versions. Each version contains different nuances for increasing your score, and it’s important to understand what they are. Upgrading your credit score to the latest VantageScore® credit score or FICO solution is easier than you think, with a switch to a modern solution taking no longer than eight weeks and your current business processes still in place. Are you ready to reap the rewards of modern credit scoring?

Key drivers to auto financial services are speed and precision. What model year is your decisioning system? In the auto world the twin engineering goals are performance and durability. Some memorable quotes have been offered about the results of all that complex engineering. And some not so complex observations. The world of racing has offered some best examples of the latter. Here’s a memorable one: “There’s no secret. You just press the accelerator to the floor and steer left. – Bill Vukovich When considering an effective auto financial services relationship one quickly comes to the conclusion that the 2 key drivers of an improved booking rate is the speed of the decision to the consumer/dealer and the precision of that decision – both the ‘yes/no’ and the ‘at what rate’. In the ‘good old days’ a lender relied upon his dealer relationship and a crew of experienced underwriters to quickly respond to a sales opportunities. Well, these days dealers will jump to the service provider that delivers the most happy customers. But, for all too many lenders some automated decisioning is leveraged but it is not uncommon to still see a significantly large ‘grey area’ of decisions that falls to the experienced underwriter. And that service model is a failure of speed and precision. You may make the decision to approve but your competition came in with a better price at the same time. His application got booked. Your decision and the cost incurred was left in the dust – bin. High on the list of solutions to this business issue is an improved use of available data and decisioning solutions. Too many lenders still underutilize available analytics and automated decisions to deliver an improved booking rate. Is your system last year’s model? Does your current underwriting system fully leverage available third party data to reduce delays due to fraud flags. Is your ability to pay component reliant upon a complex application or follow-up requests for additional information to the consumer? Does your management information reporting provide details to the incidence and disposition of all exception processes? Are you able to implement newer analytics and/or policy modifications in hours or days versus sitting in the IT queue for weeks or months? Can you modify policies to align with new dealer demographics and risk factors? The new model is in and Experian® is ready to help you give it a ride. Purchase auto credit data now.
As Big Data becomes the norm in the credit industry and others, the seemingly non-stop efforts to accumulate more and more data leads me to ask the question - when is Big Data too much data? The answer doesn’t lie in the quantity of data itself, but rather in the application of it – Big Data is too much data when you can’t use it to make better decisions. So what do I mean by a better decision? From any number of perspectives, the answer to that question will vary. From the viewpoint of a marketer, maybe that decision is about whether new data will result in better response rates through improved segmentation. From a lender perspective, that decision might be about whether a borrower will repay a loan or the right interest rate to charge the borrower. That is one the points of the hype around Big Data – it is helping companies and individuals in all sorts of situations make better decisions – but regardless of the application, it appears that the science of Big Data must not just be based on an assumption that more data will always lead to better decisions, but that more data can lead to better decisions – if it is also the “right data”. Then how does one know when another new data source is helping? It’s not obvious that additional data won’t help make a better decision. It takes an expert to understand not only the data employed, but ultimately the use of the data in the decision-making process. It takes expertise that is not found just anywhere. At Experian, one of our core capabilities is based on the ability to distinguish between data that is predictive and can help our clients make better decisions, and that which is noise and is not helpful to our clients. Our scores and models, whether they be used for prospecting new customers, measuring risk in offering new credit, or determining how to best collect on an outstanding receivable, are all designed to optimize the decision making process. Learn more about our big data capabilities

In today's data driven world, decisioning strategies can no longer be one-dimensional and only risk-focused. By employing a multidimensional decisioning approach, companies can deliver the products and services customers need and want.
When we think about fraud prevention, naturally we think about mininizing fraud at application. We want to ensure that the identities used in the application truly belong to the person who applies for credit, and not from some stolen identities. But the reality is that some fraudsters do successfully get through the defense at application. In fact, according to Javelin’s 2011 Identity Fraud Survey Report, 2.5 million accounts were opened fraudulently using stolen identities in 2010, costing lenders and consumers $17 billion. And these numbers do not even include other existing account fraud like account takeover and impersonation (limited misusing of account like credit/debit card and balance transfer, etc.). This type of existing account fraud affected 5.5 million accounts in 2010, costing another $20 billion. So although it may seem like a no brainer, it’s worth emphasizing that we need to continue to detect fraud for new and established accounts. Existing account fraud is unlikely to go away any time soon. Lending activities have changed significantly in the last couple of years. Origination rate in 2010 is still less than half of the volume in 2008, and booked accounts become riskier. In this type of environment, when regular consumers are having hard time getting new credits, fraudsters are also having hard time getting credit. So naturally they will switch their focus to something more profitable like account takeover. Does your organization have appropriate tools and decisioning strategy to fight against existing account fraud?