In this blog post…
In the American political landscape, understanding the intricacies of voters’ attitudes and behaviors has never been more crucial. With the 2024 election season on the horizon, the challenge lies in moving beyond broad categorizations like “Democrat,” “Republican,” or “Independent.” Voters seek candidates who resonate with their beliefs and values.
To meet this challenge, Experian has created political personas that offer a nuanced understanding of American voters. In this blog post, we’ll explore how these Experian audiences can help you tailor your engagement strategies for the upcoming election cycle.
Before we dive into our political personas, let’s break down what political campaign marketing is and six benefits of using digital marketing in political campaigns.
What is political campaign marketing?
Political campaign marketing is the strategic engine that drives candidates toward electoral success. It involves crafting and sending out tailored messages to effectively reach constituents to inform them about candidates’ stances on key issues. Think of it as the art of narrative construction, using various communication channels—from traditional media to digital platforms—to engage and mobilize supporters. In an era marked by information saturation, effective campaign marketing serves to cut through the noise to deliver compelling messages that inform, inspire, and spur action.
Benefits of digital marketing in political campaigns
As the 2024 election approaches, using digital marketing in political campaigns becomes paramount to effectively reach and influence voters where they spend a significant portion of their time—online.
Kamala Harris’s entry into the race has shifted spending priorities, particularly in critical states such as Ohio, where the Senate race has already attracted $300 million in ad spending. Political ad spend on connected TV (CTV) is expected to rise significantly, from 2.7% in 2020 to 12.8% this year. The Harris campaign is spearheading this trend, dedicating $200 million to digital ads, with a substantial portion directed toward streaming platforms.
Embracing digital marketing can help campaigns effectively shape opinions and mobilize support. Here are five key benefits of integrating digital marketing strategies into political campaigns:
- Unparalleled reach with targeted advertising: A well-connected digital platform partner can help you reach your target audiences across the ecosystem – from social to the open web.
- Optimization flexibility: Digital marketing allows for quick adjustments in response to real-time data and evolving circumstances.
- Interactive engagement: The interactive nature of digital channels creates meaningful engagement and dialogue between candidates and voters, building connections and community.
- Insights: Robust analytics provide valuable insights into audience behavior and preferences, facilitating continuous optimization and refinement of outreach efforts.
- Amplified messaging: Through digital marketing, political campaigns can amplify their message, mobilize support, and forge deeper connections with voters.
Data serves as the foundation for these benefits. Interactivity hinges on data to deliver the right message and creative for engagement. Insights are gained through pre-campaign research, analyzing audience attributes to grasp their interests and behaviors. Flexibility relies on real-time campaign data, a unique advantage in digital marketing.
In an era where audiences are available readily on most major activation platforms, advertisers need to understand how audiences are built to be privacy conscious and consistent in a cookieless environment.
Experian’s political personas
Digital marketing in political campaigns is crucial to reach and influence voters online. Integrating Experian’s political personas into your political campaign strategy can help you grasp the complexities of today’s American voter landscape and craft tailored engagement strategies. These personas offer invaluable insights into voter viewpoints on key political issues, enriching digital marketing efforts and empowering campaigns to connect with constituents more effectively.
Experian has created 10 political personas to help you better understand today’s American voter so you can reach consumers based on their viewpoints into key political issues.
Our political personas group voters along the political spectrum from most “committed” on the ends of the spectrum.
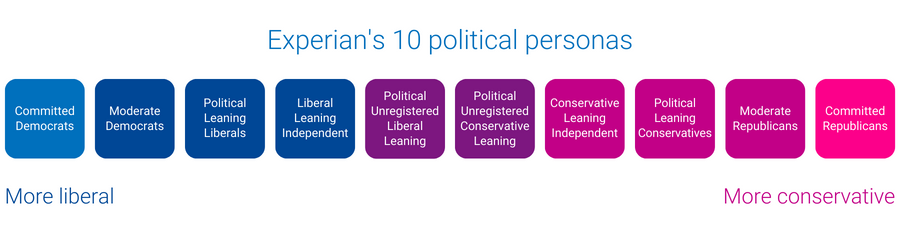
Let’s walk through how we define each persona starting from the most “committed” personas on the ends of the spectrum.
Committed Democrats
This audience contains consumers who are likely to have a “very liberal” outlook on political issues. They have strong liberal opinions on various topics including key issues and the economy and are very involved in their communities.
Committed Republicans
This audience contains consumers who are likely to have a “very conservative” outlook on political issues. They are well-informed, community-minded individuals with strong opinions that reflect their conservatism. They have very conservative attitudes regarding key social issues.
Moderate Democrats
This audience contains consumers who are likely to have a “somewhat liberal” outlook on political issues.
Moderate Republicans
This audience contains consumers who are likely to have a “somewhat conservative” outlook on political issues.
Political Leaning Liberals
This audience contains consumers who are likely to have strong opinions on key issues that may not align with the traditional Democrat point of view.
Political Leaning Conservatives
This audience contains consumers who are likely on-the-fence on traditional Republican points of view on key issues.
Liberal Leaning Independents
This audience contains consumers who are registered independents and who are likely to have a “middle of the road” outlook on political issues while tending to lean more liberal.
Conservative Leaning Independents
This audience contains consumers who are likely registered independents and likely have a “middle-of-the-road” outlook on political issues while tending to lean more conservative.
Political Unregistered Liberal Leaning
This audience contains consumers who are not likely to have aligned with a specific party, but have a more liberal attitude. They are well-informed and are aware of important political issues. They frequently align with but are not necessarily completely aligned with liberal points of view.
Political Unregistered Conservative Leaning
This audience contains consumers who are not likely to have aligned with a specific party, but have a more conservative attitude. They are well-informed and are aware of important political issues. They frequently align with but are not necessarily completely aligned with conservative points of view.
These 10 personas can help you better understand who the American voter is, but when combined with our 200 politically relevant audiences, such as watches political TV, donations to charitable causes, engagement channel preferences, hobbies, and more, the ability to study and improve engagement for each persona is considerably magnified.
How to combine our political personas with other audiences
If you’re a political candidate looking to reach an important population, Experian audiences are available on-the-shelf of major platforms. For example, if you want to reach unregistered voters and independent voters to influence green initiatives within your community, you can focus on unregistered and moderate personas in the area and combine that with audiences interested in green initiatives, like our GreenAware segments – which predict a consumer’s attitude and point of view on environmental issues.
You can use our “Political Unregistered Liberal Leaning”, “Liberal Leaning Independents,” and GreenAware “Think Greens” audience segments to reach constituents who are likely to be most interested in your message.
To reach voters based on their regional voting patterns, you can use our new battleground counties and district audiences:
- Affiliation Switcher Counties
- Battleground Counties
- House Battleground Districts
- Democrat Counties
- Republican Counties
- Independent Counties
Add Experian’s audiences to your 2024 election strategy
Political advertising spend is projected to surpass $12 billlion in the 2024 election cycle, generating the largest amount of voter outreach in the history of American elections. Experian’s audiences are available on major activation platforms allowing you to strategically reach constituents who would be most impacted and interested in your initiatives.
As we approach a cookieless future, Experian’s political personas are cookie resilient. Our data is rooted in both offline and online data that doesn’t rely on third-party cookies. The personas do not rely on an individual’s browsing behavior. Experian can help our partners understand and engage with these political audiences.
Over 200 politically relevant Experian audiences are available for activation on-the-shelf of the leading TV, demand, and supply platforms. Here are the platforms where you can find our political audiences:
- ArcSpan
- Audigent
- Cadent
- Eyeota
- Magnite
- Microsoft
- Nexxen
- Pandora
- Permutive
- Samsung Ads
- The Trade Desk
- Verizon Media
- Viant
- Videoamp
- Yieldmo
Can’t find the audience you’re looking for or need a custom audience? Connect with our audience team for more information.
Latest posts

While the weather outside is frightfully hot this summer, it’s never too soon to start thinking about the holidays – and consumers are more likely to start their holiday shopping early this year. To get you ready for the 2022 holiday shopping season, we looked back at consumer shopping trends from 2019-2021. What did we learn and what trends do we expect to see this year? Let’s look back. A look back Over the last three years, average consumer spending has increased. Record 2021 holiday sales came amidst a wave of COVID-19 cases, rising inflation, labor shortages, and supply chain problems. Despite these challenges, consumers continued to let it snow when it came to spending during the holiday season. 2022 has been a year with its own economic roadblocks – the war in Ukraine, rising gas prices, and recession concerns. Yet 2021 was a banner year for holiday sales despite its obstacles, and we predict similar trends in the 2022 holiday shopping season. What trends do we expect to see for the most wonderful time of the year? 2022 predictions While consumer spending remains strong, changing economic conditions continue to shape shopper behavior. To develop our predictions for 2022 holiday shopper behavior, we focused on four key areas: When consumers shop Where consumers shop What consumers purchase Consumer media preferences Now, let's make our holiday campaign planning checklist and check it twice. When consumers shop Chestnuts roasting on an open fire. Jack Frost nipping at your nose. Those aren’t the only ways to know when the holiday season has begun. Shoppers tend to spread out their holiday purchases across multiple months and were more likely to start shopping earlier. To understand holiday retail sales trends from 2019-2021, we identified four shopper segments: Early Shoppers Traditional Shoppers Late Shoppers Random Shoppers What differences did we see between our four shopper segments? Early shoppers made almost half of their holiday purchases in October Random shoppers spread out their holiday purchases evenly across multiple months Late shoppers made almost half of their holiday purchases in December Traditional shoppers made almost half of their holiday purchases in November While December continues to dominate holiday sales, October has started to gain traction over the last three years, and November remains a core shopping month. Everybody knows a turkey and a mistletoe help to make the season bright but knowing when your consumers are most likely to shop will help deck your campaign planning halls. Jingle bell rock your way to holiday sales that shine bright with our tips to prepare for earlier shoppers: Offer targeted promotions earlier in the shopping season Target your ads based on the shopping habits of your customers throughout the season Where consumers shop There’s no place like home for the holidays but most consumers aren’t shopping from home. Despite the rise in online shopping, brick and mortar locations continue to dominate holiday sales. October is the most popular month to take a one-horse open sleigh to a store, and consumers gather around the fire to online shop in November and December. With most shoppers preferring to shop in-store, and e-commerce popularity growing, it’s critical to think about bridging the gap between your online and offline presence for the consumer. Are you offering multiple paths to purchase with solutions such as BOPIS (Buy Online, Pickup In-Store)? Go down in history like Rudolph with our tips to prepare for more in-store shopping: Focus on in-store shopping experience technology (self-checkout, VR, QR codes, scan to pay, etc.) Offer multiple paths to purchase to connect your online and physical presence through methods such as BOPIS (Buy Online, Pickup In-Store), BORIS (Buy Online, Return In-Store), and ROPO (Research Online, Purchase Offline), etc. What consumers purchase When it comes to holiday gifts, for some, only a hippopotamus will do. Compared to pre-pandemic, shoppers are spending more at apparel stores and mass retailers. Spending at specialty retailers, warehouse clubs, and on office, electronic, and games is almost the same across holiday and non-holiday shopping months. Time for toys and time for cheer may be year-round, but are there any correlations between where consumers shop (online vs. in-store) and what they purchase? Our data found that shoppers who bought from mass retailers were more likely to shop online, while shopping for apparel and warehouse clubs was done at a physical store location. Put this insight to the test by thinking through how you can target your consumer based on where they shop in-store and online. You just might find that hippopotamus at a brick and mortar mass retailer location! Consumer media preferences Do you see what I see? While we are seeing a shift to digital media channel preference, consumers still engage with traditional media channels like direct mail and the traditional newspaper. Successfully connecting with your customers involves capturing their attention through the right channel. We found that our four shopping groups prefer a mix of traditional and digital media channels. What does your media channel mix look like? Hark! The herald angels sing of ways to adapt to the change in holiday spend and media preferences: Align your activation efforts to digital, but don't forget about traditional channels Expand your targeting and activation focus beyond in-store vs. online Download our new 2024 report For a deeper dive into our predictions and actionable insights you can use to take your holiday campaign planning home for the holidays, download our new 2024 report. Experian data can help you refine your content and creative strategy to achieve maximum ROI for each campaign across all your channels. Download now

Fluctuation in consumers' behaviors and preferences during the pandemic has prompted a shift in the practices and patterns that we are accustomed to. Powerful market forces are emerging as society builds a new normal, forcing marketers to rethink their strategy, activation, and measurement. It is important for marketers to understand the forces that influence the industry, and to learn about alternative approaches that can be applied to help reach their goals. In our recent webinar, ‘How to Adjust to the New World of Advertising,’ Experian’s Chris Feo and guest speaker Tina Moffett, Principal Analyst at Forrester Research, lead an in-depth discussion of the market dynamics and developments guiding us to this new era of advertising. They talked about: The pandemic changing consumer behavior Emerging media channels Data deprecation The pandemic and increased media consumption The pandemic caused seismic shifts in consumer behaviors and business operations. Work from home became the norm, consumers made drastic changes in their routines, and businesses had to adjust to new operating models as local economies shrank and supply chains strained. As stay-at-home orders were put into effect, consumers increased their media consumption drastically as more time was spent at home in front of their devices. According to Forrester, by June 2020, 48% of US online adults subscribed to at least one streaming service, while 34% had signed up for multiple. Forrester contends that: Social and online video/OTT will grow fastest among other categories of ad spend Connected TV outpaces other video advertising channels 55% of consumers plan to continue watching movies at home rather than in theatres after the pandemic Data deprecation The ways that marketers can personalize content and measure the effectiveness of campaigns is changing with data deprecation. Consumer preferences, regulations, and technology providers are evolving the way advertisers understand consumers, causing changes to existing identity-based marketing strategies. According to Forrester, 66% of marketers are investing in first-party data collection strategies to adapt to these market forces. Marketers need to adjust Demand for a new advertising approach Changes in consumer behavior, evolving media consumption patterns, and data deprecation have marketers looking at new approaches to targeting and measurement. However, with the future uncertain in many of these areas, marketers need to test and experiment to determine which approach is best for them in particular use cases. Shifting to a new world of experimentation Advertisers need to start by assessing their current environment to determine where they have exposure today, which methods of identification they are using, and how those channels may be impacted by the market forces outlined earlier. From there, they need to start asking themselves how they can assess identity in the future or if there is another way to approach advertising in that specific channel. There are specific areas where marketers can look to make investments in terms of experimentation: Adoption of cleanrooms to support analytics and audience targeting Investment in first-party data to overcome the issue of data deprecation Shifting to a value-based, omni-channel advertising mindset to address customers’ needs Investment in data-savvy resources to manage media insights Adoption of consistent cross-platform advertising metrics and currencies to inform better planning If you missed our recent webinar ‘How to Adjust to the New World of Advertising,’ you can listen to the full discussion here.

Hashed Email is a privacy-safe digital identifier that can further enrich and expand the functionality and utility of The Tapad Graph with access to Tapad + Experian’s universe of email data. This provides maximum coverage for targeting and measurement when combined with household and individual IDs such as Cookies, MAIDs, CTV IDs, and IP Addresses. Gain back a clearer view Recent data from DMA shows that 51% of people have held the same email address for over 10 years. Email address data by its nature is authenticated and reliable due to its longevity. When leveraging Hashed Email as an extended functionality of The Tapad Graph, we are able to link on average 5 email addresses to each individual, reaching up to 90% of households across the US. Hashed Email expands the customer view by adding new email address identifiers into The Tapad Graph that associate with traditional digital IDs and cookie-less IDs emerging in the marketplace. Reduce fragmentation; and instead of viewing the emails as multiple customers, with Hashed Email they can be viewed as one user profile. When enabled, clients who wouldn’t traditionally have access to first-party customer emails are able to associate and link privacy-safe emails to individuals and their households. Brands and retailers can use Hashed Email to extend these linkages across offline purchases associated with each email; connecting traditional digital identifiers between walled gardens, activation in programmatic media buys, and addressable TV. With the holiday season quickly approaching, access to Hashed Emails will instantly increase scale, connectivity and improve measurement when efficiency, personalization and holistic attribution are pivotal to marketing strategies. Let’s visualize how quickly the customer journey can become fragmented when email addresses that belong to the same person are not associated. Mary has 3 email addresses that she frequently uses. One for social media accounts Email ID 1, one for shopping accounts Email ID 2, and another for work Email ID 3. Mary is a brand loyalist to a top national retailer and whenever there is a new season, there is a high likelihood that she will purchase the latest seasonal decor from that store. She recently did some holiday shopping in-store where she purchased nearly the whole holiday line. Email ID 2 was used to send her a receipt. However, Mary annoyingly receives the store's ads on Facebook for holiday decor that she had already purchased. This is because the retailer has not yet identified that Email ID 1 and Email ID 2 belong to the same consumer. If the retailer were to leverage Hashed Email, they would be able to identify that both email addresses used belong to Mary. This association connects her multiple email addresses together, enables her offline purchases to sync with her online activity, and helps to determine the most accurate ROAS. Hashed Email is a cookie-free added view into consumer behavior for control over messaging and for measurement. When leveraging it’s possible to report back across all channels and devices in a universal format to know when and how conversions are taking place. Don't leave valuable data on the table Hashed Email has use cases beyond reducing wasted media impressions. Hashed Email’s full capabilities extend to campaign measurement and attribution modeling. When utilizing The Tapad Graph combined with Hashed Email, know from the first touchpoint to the last where your customers are engaging. But more importantly, know where households and the individuals inside of those households are converting across all of their digital devices, by using traditional digital IDs, cookie-less IDs, and Hashed Email to associate, measure, and correlate online and offline purchases. Imagine what your campaigns could look like this holiday season if you expanded your graph with up to 5 additional IDs per household. This impact could be a game-changer to scale this holiday season. Hashed Email is a reliable cookie-less digital identifier that expands your customer universe that connects online and offline activity while improving the customer experience and reducing wasted media spend. Enabling Hashed Email for the holiday season is not an opportunity that should be passed on. Where do you sign up, you ask? Get started with The Tapad Graph For personalized consultation on the value and benefits of The Tapad Graph for your business, email Sales@tapad.com today!