
In this blog post…
In the American political landscape, understanding the intricacies of voters’ attitudes and behaviors has never been more crucial. With the 2024 election season on the horizon, the challenge lies in moving beyond broad categorizations like “Democrat,” “Republican,” or “Independent.” Voters seek candidates who resonate with their beliefs and values.
To meet this challenge, Experian has created political personas that offer a nuanced understanding of American voters. In this blog post, we’ll explore how these Experian audiences can help you tailor your engagement strategies for the upcoming election cycle.
Before we dive into our political personas, let’s break down what political campaign marketing is and six benefits of using digital marketing in political campaigns.
What is political campaign marketing?
Political campaign marketing is the strategic engine that drives candidates toward electoral success. It involves crafting and sending out tailored messages to effectively reach constituents to inform them about candidates’ stances on key issues. Think of it as the art of narrative construction, using various communication channels—from traditional media to digital platforms—to engage and mobilize supporters. In an era marked by information saturation, effective campaign marketing serves to cut through the noise to deliver compelling messages that inform, inspire, and spur action.
Benefits of digital marketing in political campaigns
As the 2024 election approaches, using digital marketing in political campaigns becomes paramount to effectively reach and influence voters where they spend a significant portion of their time—online.
Kamala Harris’s entry into the race has shifted spending priorities, particularly in critical states such as Ohio, where the Senate race has already attracted $300 million in ad spending. Political ad spend on connected TV (CTV) is expected to rise significantly, from 2.7% in 2020 to 12.8% this year. The Harris campaign is spearheading this trend, dedicating $200 million to digital ads, with a substantial portion directed toward streaming platforms.
Embracing digital marketing can help campaigns effectively shape opinions and mobilize support. Here are five key benefits of integrating digital marketing strategies into political campaigns:
- Unparalleled reach with targeted advertising: A well-connected digital platform partner can help you reach your target audiences across the ecosystem – from social to the open web.
- Optimization flexibility: Digital marketing allows for quick adjustments in response to real-time data and evolving circumstances.
- Interactive engagement: The interactive nature of digital channels creates meaningful engagement and dialogue between candidates and voters, building connections and community.
- Insights: Robust analytics provide valuable insights into audience behavior and preferences, facilitating continuous optimization and refinement of outreach efforts.
- Amplified messaging: Through digital marketing, political campaigns can amplify their message, mobilize support, and forge deeper connections with voters.
Data serves as the foundation for these benefits. Interactivity hinges on data to deliver the right message and creative for engagement. Insights are gained through pre-campaign research, analyzing audience attributes to grasp their interests and behaviors. Flexibility relies on real-time campaign data, a unique advantage in digital marketing.
In an era where audiences are available readily on most major activation platforms, advertisers need to understand how audiences are built to be privacy conscious and consistent in a cookieless environment.
Experian’s political personas
Digital marketing in political campaigns is crucial to reach and influence voters online. Integrating Experian’s political personas into your political campaign strategy can help you grasp the complexities of today’s American voter landscape and craft tailored engagement strategies. These personas offer invaluable insights into voter viewpoints on key political issues, enriching digital marketing efforts and empowering campaigns to connect with constituents more effectively.
Experian has created 10 political personas to help you better understand today’s American voter so you can reach consumers based on their viewpoints into key political issues.
Our political personas group voters along the political spectrum from most “committed” on the ends of the spectrum.
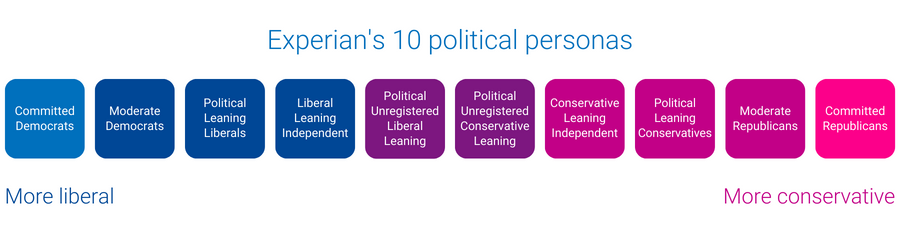
Let’s walk through how we define each persona starting from the most “committed” personas on the ends of the spectrum.
Committed Democrats
This audience contains consumers who are likely to have a “very liberal” outlook on political issues. They have strong liberal opinions on various topics including key issues and the economy and are very involved in their communities.
Committed Republicans
This audience contains consumers who are likely to have a “very conservative” outlook on political issues. They are well-informed, community-minded individuals with strong opinions that reflect their conservatism. They have very conservative attitudes regarding key social issues.
Moderate Democrats
This audience contains consumers who are likely to have a “somewhat liberal” outlook on political issues.
Moderate Republicans
This audience contains consumers who are likely to have a “somewhat conservative” outlook on political issues.
Political Leaning Liberals
This audience contains consumers who are likely to have strong opinions on key issues that may not align with the traditional Democrat point of view.
Political Leaning Conservatives
This audience contains consumers who are likely on-the-fence on traditional Republican points of view on key issues.
Liberal Leaning Independents
This audience contains consumers who are registered independents and who are likely to have a “middle of the road” outlook on political issues while tending to lean more liberal.
Conservative Leaning Independents
This audience contains consumers who are likely registered independents and likely have a “middle-of-the-road” outlook on political issues while tending to lean more conservative.
Political Unregistered Liberal Leaning
This audience contains consumers who are not likely to have aligned with a specific party, but have a more liberal attitude. They are well-informed and are aware of important political issues. They frequently align with but are not necessarily completely aligned with liberal points of view.
Political Unregistered Conservative Leaning
This audience contains consumers who are not likely to have aligned with a specific party, but have a more conservative attitude. They are well-informed and are aware of important political issues. They frequently align with but are not necessarily completely aligned with conservative points of view.
These 10 personas can help you better understand who the American voter is, but when combined with our 200 politically relevant audiences, such as watches political TV, donations to charitable causes, engagement channel preferences, hobbies, and more, the ability to study and improve engagement for each persona is considerably magnified.
How to combine our political personas with other audiences
If you’re a political candidate looking to reach an important population, Experian audiences are available on-the-shelf of major platforms. For example, if you want to reach unregistered voters and independent voters to influence green initiatives within your community, you can focus on unregistered and moderate personas in the area and combine that with audiences interested in green initiatives, like our GreenAware segments – which predict a consumer’s attitude and point of view on environmental issues.
You can use our “Political Unregistered Liberal Leaning”, “Liberal Leaning Independents,” and GreenAware “Think Greens” audience segments to reach constituents who are likely to be most interested in your message.
To reach voters based on their regional voting patterns, you can use our new battleground counties and district audiences:
- Affiliation Switcher Counties
- Battleground Counties
- House Battleground Districts
- Democrat Counties
- Republican Counties
- Independent Counties
Add Experian’s audiences to your 2024 election strategy
Political advertising spend is projected to surpass $12 billlion in the 2024 election cycle, generating the largest amount of voter outreach in the history of American elections. Experian’s audiences are available on major activation platforms allowing you to strategically reach constituents who would be most impacted and interested in your initiatives.
As we approach a cookieless future, Experian’s political personas are cookie resilient. Our data is rooted in both offline and online data that doesn’t rely on third-party cookies. The personas do not rely on an individual’s browsing behavior. Experian can help our partners understand and engage with these political audiences.
Over 200 politically relevant Experian audiences are available for activation on-the-shelf of the leading TV, demand, and supply platforms. Here are the platforms where you can find our political audiences:
- ArcSpan
- Audigent
- Cadent
- Eyeota
- Magnite
- Microsoft
- Nexxen
- Pandora
- Permutive
- Samsung Ads
- The Trade Desk
- Verizon Media
- Viant
- Videoamp
- Yieldmo
Can’t find the audience you’re looking for or need a custom audience? Connect with our audience team for more information.
Latest posts

Combined technology gives marketers an enhanced view of the customer for improved planning, targeting and optimization NEW YORK, July 12, 2016/PR Newswire/ - Tapad, the leader in cross-device marketing technology and now a part of Experian, today announced a partnership with Conversion Logic, the martech industry's most accurate unified marketing attribution provider. Conversion Logic will incorporate unified cross-screen data from Tapad's Device Graph™ to identify related devices and media exposures to enhance reporting on the path to conversion. By connecting Conversion Logic's proprietary Ensemble Method, which combines numerous state-of-the-art machine learning algorithms, tuned for each customer use-case for the most accurate results, with Tapad's unified, cross-device technology, marketers will benefit from a highly scientific approach to assessing advertising effectiveness with full, comprehensive customer insights. Linking these technologies will increase marketers' real-time ability to optimize brands' marketing channel spend and creative at a more granular level. During the past six months, Tapad has rapidly grown its data business, doubling the number of companies integrating the Device Graph™ into their platforms and growing the annualized revenue run rate by 210%. Tapad's highly scalable, cross-device data has been confirmed by Nielsen to be very precise. Tapad augments platforms' and publishers' tech stacks with additional scale and relevancy, granting advertisers amplified targeting and analysis options. The growth of the Device GraphTM has allowed Tapad to provide a growing network that benefits all partners with more efficient, effective consumer engagement. "Combining highly accurate data from Tapad with our own user ID technology and understanding how devices may be related at an individual level provides additional visibility into the path to conversion," said Alison Lohse, COO and co-founder of Conversion Logic. "The more we know about the customer journey, the more effective, efficient and customized marketers can be with marketing efforts. With Tapad, we have achieved a unified customer view that helps us piece together the purchase journey while preserving proven accuracy." "Conversion Logic's Ensemble Method delivers singularly customized and precise results that are not just accurate, but actionable," said Dave Fall, COO of Tapad. "The combination of powerful technology and a user-friendly interface, plus Tapad's ability to only consider relevant and scalable components in the marketplace, creates a more concentrated and beneficial environment for both its partners and clients." Contact us today!
B2B marketers can now deliver the right message to the right user at the right time across devices and channels NEW YORK, NY–(Marketwired – Jun 1, 2016) – Madison Logic, one of the world's fastest growing companies dedicated to solving the digital needs of B2B marketers, is partnering with Tapad, the leading provider of unified and now a part of Experian, cross-screen marketing technology solutions. Now business-to-business (B2B) marketers can power targeted advertising and content syndication programs across all channels, including smartphones, computers and tablets. The increasing shift in content consumption across mobile devices makes cross-device identification and attribution a top priority for B2B marketers. The Madison Logic and Tapad partnership gives B2B marketers unprecedented reach and scale with the ability to run always-on, cross-device, account-based marketing programs targeting decision makers who are actively researching similar products and services. "Screens are everywhere and so is the B2B buyer," said Vin Turk, SVP of Audience Development for Madison Logic. "This partnership allows marketers to harness the power of Madison Logic's intent data and combine it with Tapad's cross-device solutions to connect with the most-likely-to-convert prospects with hyper-relevant content wherever and whenever they're doing their research." "Relevance is essential to the success of B2B marketers, particularly now, when breaking through the clutter is difficult," said Dave Fall, COO of Tapad. "This partnership with Madison Logic allows marketers to leverage their existing customers while identifying and reaching new audiences with messaging tailored to every device." For more information about Madison Logic's account-based marketing platform, please visit https://www.madisonlogic.com/account-based-marketing/. For more information about Tapad's cross-platform advertising solutions, please visit https://www.experian.com/marketing/consumer-sync. Contact us today!
NEW YORK, June 1, 2016 /PRNewswire/ — Are Traasdahl, CEO and founder of Tapad, the leader in cross-device marketing technology and now a part of Experian, has been named Founder of the Year by the Nordic Startup Awards. The Nordic Startup Awards' Founder of the Year Award recognizes an individual that has shown exceptional achievements in fundraising, customer growth, financial savvy, and/or leadership throughout the past year. The Nordic Startup Awards evaluates hundreds of players in the startup ecosystem, ranging from investors and founders, to developers and journalists in Denmark, Sweden, Iceland, Norway and Finland. Taking place in two stages, each country selects its nominees for consideration for the regional awards which were held in Iceland on May 31, 2016. Traasdahl is recognized for his continuous investment in Tapad as a whole, as well as his dedication to growing and developing Tapad since founding the company in 2010. He has led Tapad from startup through a steady period of growth resulting in an acquisition by the Telenor Group for $360 million in February 2016. "I am truly honored to be named Founder of the Year by the Nordic Startup Awards, among so many other remarkable leaders in the space," said Traasdahl. "That said, this has always been a team effort. We started Tapad with the goal of giving employees unprecedented growth opportunities while developing breakthrough solutions for our clients. This is a win for everyone at Tapad who has committed themselves to these principles over the past four-and-a-half years." Tapad is reinforcing its commitment to fostering entrepreneurship with the launch of their new Propeller Program. Through Propeller, Tapad will host five early-stage companies at Tapad's New York headquarters for a year to set them up for global expansion. In its inaugural year, the first participants will come from Traasdahl's native Norway. For more information on the Nordic Startup Awards, please visit: http://www.nordicstartupawards.com/. Contact us today!